Analysis of Platform Dynamic Response With a 3 × 3 Mooring System for the DTU 10 MW Wind Turbine Based on OpenFAST
Abstract
A novel 3 × 3 mooring system was designed for the DTU 10 MW wind turbine based on the floating platform OOStar. This new mooring system was compared with the original mooring system using OpenFAST. Dynamic response analyses were conducted considering different hawse pipe heights and scenarios of maximum tension mooring line breakage. The results indicated that the novel 3 × 3 mooring system significantly improved stability compared to the 3 × 1 mooring system. This conclusion was drawn by comparing the maximum tension in mooring lines, surge, heave, pitch, and the fore-aft acceleration of the nacelle between the two mooring configurations.
1. Introduction
Compared to onshore wind turbines, offshore wind turbines face stronger winds and larger wave loads, which increase their instability and adversely affect their fatigue life. Currently, mooring systems for offshore wind turbines do not provide adequate restoring force to floating platforms under extreme weather conditions. This is particularly problematic when wind and wave forces combine, leading to a higher likelihood of mooring line failure. Therefore, it is necessary to optimize the original mooring systems to enhance the stability of floating platforms.
Zhouquan Feng proposed a double-rope mooring system, which significantly reduces the vibration response of the floating wind turbine compared to the original single-rope mooring system under both normal operating conditions and storm self-existing conditions [1]. Cai and Zhang optimized the tuned mass damper (TMD) and compared the dynamic responses of the floating wind turbine before and after optimization. The optimized floating wind turbine effectively controlled amplitude in the high-frequency range, especially demonstrating excellent control over lateral displacement and loads [2]. Gao et al. utilized the finite element method to analyze the dynamic response of offshore wind turbine monopile structures and found that multipile platform structures had a concentrated frequency range, experiencing lower wave forces in the sway direction and higher wave forces in the pitch direction [3]. Johlas et al. simulated the operation of the NREL 5 MW wind turbine on OC3 and OC4 platforms under irregular waves and extremely low wind speeds using OpenFAST. The study revealed that pitch motion led to a decrease in power output, while sway motion resulted in an increase in power output. The balance between these two effects was crucial in determining the power output of offshore wind turbines under extremely low wind speed conditions [4]. To address power reduction caused by wake effects, Liang and Liu optimized the distribution of offshore wind farms by arranging more wind turbines on a single floating platform and re-configuring the layout of the floating platforms, thereby improving the power generation efficiency of the wind farm [5].
Zhang et al. addressed the issue of damage to mooring systems from long-term use by designing a fully submerged platform with circumferential mooring chains. Simulations of the dynamic response in the event of mooring line failure revealed that such failures significantly impacted surge, pitch, and yaw motions of the platform, and increased the likelihood of other mooring line failures [6]. Feng et al., through numerical simulations and scaled model tests, discovered patterns in how surge and pitch motions affect wind turbine power output [7]. Arabgolarcheh et al. studied the impact of platform phase differences on offshore wind turbine power generation and thrust, finding that different rotor phases significantly affected the bending moments at the blade roots [8]. Fenu et al. designed a novel hybrid platform with three additional pontoons around a monopile structure and investigated the effects of wind loads and pontoon damping on platform dynamic response. The study found that wind loads increased yaw motion and overall dynamic response of the platform, while pontoon damping mainly affected the wind turbine’s power output [9]. He and Zhong developed a new Fourier random wave spectrum and analyzed the dynamic response of a 3.6 MW offshore wind turbine. The study showed that insufficient foundation treatment could lead to excessive monopile tilt, further impacting the normal operation of the wind turbine [10].
Wu and Zhong designed a novel semisubmersible offshore wind turbine platform and conducted numerical simulations and hydrodynamic tests to compare the platform’s dynamic response with and without heave plates. The findings indicated that heave plates play a crucial role in enhancing system stability [11]. Zhu et al. designed and analyzed a new hinged offshore wind turbine suitable for a water depth of 75 m, examining its dynamic response under operational and extreme sea conditions. The study explored the composition patterns of horizontal and axial forces at the hinge point [12]. Barooni et al. proposed an ice load model using an aero-hydro-servo-elastic numerical model to study the dynamic response of floating offshore wind turbines (FOWTs) in cold regions with sea ice. This open-source numerical model provides a modular framework to study common wind turbine configurations, support structure systems, and mooring lines under various environmental conditions. Validation studies demonstrated the model’s accuracy, indicating it provides reasonable results for calculating ice loads on offshore wind turbine structures and their dynamic responses [13]. Deng et al. investigated the frequency-dependent characteristics of aerodynamic damping and their impact on the dynamic response of FOWTs. An aero-hydro-servo-structural coupled model was established for the OC4 DeepCWind turbine, validated against thrust, mooring stiffness, hydrodynamic damping, and the natural period of platform motion. The study identified and analyzed both constant and frequency-dependent aerodynamic damping for the reference wind turbine, highlighting their effects on platform motion, nacelle acceleration, and tower bending moments. The results emphasized the critical relationship between aerodynamic damping and the natural period of platform motion in either suppressing or amplifying dynamic effects [14].
Current research on floating platforms and mooring systems primarily focuses on analyzing the dynamic response of platforms in six degrees of freedom. The main objective of these studies is to enhance platform stability, but there is a notable lack of optimization efforts directed towards mooring systems. This paper addresses this gap by using the platform’s six degrees of freedom as evaluation criteria to study the optimized mooring system, aiming to determine the motion patterns of the platform under the combined effects of wind and waves.
2. Numerical Model
2.1. Structure Model
This study focuses on a semisubmersible offshore wind turbine, utilizing the DTU 10 MW wind turbine model and the OOStar floating platform. The main parameters of the platform are listed in Table 1, and the complete model is shown in Figure 1.
| Parameter | Value |
|---|---|
| Draft (m) | 22 |
| Height from waterline to platform top (m) | 11 |
| Displacement (m3) | 2.3509 × 10⁴ |
| Mass (kg) | 2.1709 × 10⁷ |
| Length from anchor point to connection point (m) | 585 |
| Length from connection point to hawse pipe (m) | 118 |
| Ballast block mass (kg) | 50,000 |
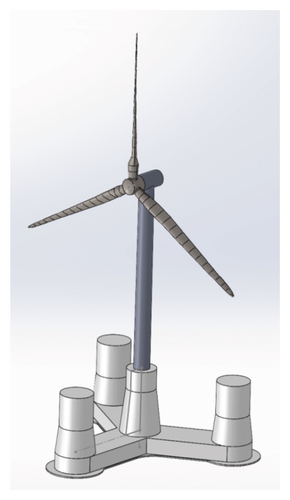
In OpenFAST, the positive direction of the X-axis corresponds to the wind flow direction, the positive direction of the Y-axis is determined by the right-hand rule and is in the same horizontal plane as the X-axis, and the positive direction of the Z-axis is vertically upward. The six degrees of freedom of the platform are surge, sway, heave, roll, pitch, and yaw. The simulation of the FOWT’s operation is controlled through code to coordinate the multiple internal modules of OpenFAST.
2.2. Model Reliability Verification
This section conducts a free decay study on the platform’s six degrees of freedom. An initial displacement of 10 m is assigned to surge and sway, 5 m to heave, and an initial angle of 5° to roll, pitch, and yaw. The results are compared with those in Reference [15]. As shown in Table 2, the maximum deviation is 2.06%, indicating that the model has sufficient reliability.
| Natural frequencies | Surge (Hz) | Sway (Hz) | Heave (Hz) | Roll (Hz) | Pitch (Hz) | Yaw (Hz) |
|---|---|---|---|---|---|---|
| Model | 0.0053 | 0.0053 | 0.0476 | 0.0317 | 0.0317 | 0.0095 |
| Paper | 0.0054 | 0.0054 | 0.0478 | 0.0316 | 0.0316 | 0.0097 |
| Deviation | 1.85% | 1.85% | 0.41% | 0.31% | 0.31% | 2.06% |
2.3. Design of the 3 × 3 Mooring System
A new mooring scheme has been designed for the floating platform OOStar, and dynamic response analyses have been conducted under three different operating conditions.
Compared to onshore wind turbines, offshore floating wind turbines are exposed to not only stronger wind loads but also complex and variable wave loads. Therefore, the stability of offshore floating wind turbines is crucial. To stabilize the floating platform, two methods can be employed: mooring positioning systems and dynamic positioning systems. Compared to dynamic positioning systems, mooring positioning systems are more cost-effective and have a simpler structure. Consequently, mooring positioning systems are widely used in offshore floating wind turbines.
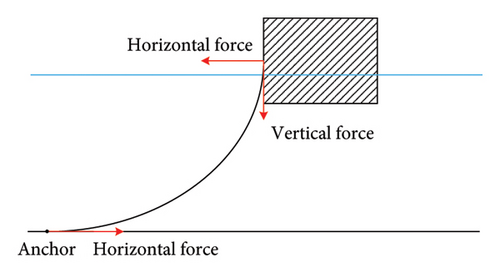
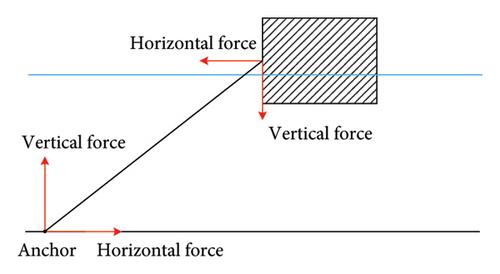
Existing mooring positioning systems can be classified into two types based on the working condition of the mooring chain: taut-leg and catenary mooring systems. The catenary mooring system is generally used in shallower water depths, as illustrated in Figure 2(a). In this system, the mooring line at the anchor end is in contact with the seabed, and the restoring force is provided by gravity. The system is relatively heavy, and the anchor point is primarily subjected to horizontal forces. In contrast, the taut-leg mooring system is used in deep water areas, as shown in Figure 2(b). In this system, the mooring line from the anchor point to the platform hawse pipe is nearly a straight line. The contact area between the anchor point and the seabed is relatively small, and the anchor point experiences both horizontal and vertical forces. Because the restoring force for the floating platform is provided through tension rather than its own weight, the taut-leg mooring system is relatively lighter. The mooring cable parameters used in this study are listed in Table 3.
| Material | Diameter (m) | Weight per unit length (kg/m) | Elastic modulus (N) |
|---|---|---|---|
| Anchor chain | 0.246 | 375.38 | 1.506 × 10⁹ |
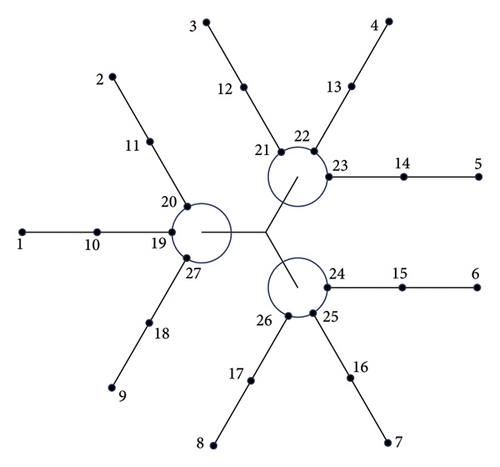
A new mooring configuration has been designed, as illustrated in Figure 3. This configuration uses 9 anchor points and 9 hawse pipes, with a single pontoon connecting three mooring lines, resulting in a 3 × 3 mooring arrangement. All other parameters remain unchanged. The coordinates of each hawse pipe and anchor point are provided in Table 4.
| Serial number | X (m) | Y (m) | Z (m) |
|---|---|---|---|
| Anchor 1 | −691.00 | 0.00 | −130.00 |
| Anchor 2 | −363.17 | 564.95 | −130.00 |
| Anchor 3 | −308.09 | 595.94 | −130.00 |
| Anchor 4 | 345.50 | 598.42 | −130.00 |
| Anchor 5 | 672.50 | 32.04 | −130.00 |
| Anchor 6 | 672.50 | −32.04 | −130.00 |
| Anchor 7 | 345.50 | −598.42 | −130.00 |
| Anchor 8 | −308.09 | −595.94 | −130.00 |
| Anchor 9 | −363.17 | −564.95 | −130.00 |
| Fairlead 19 | −51.00 | 0.00 | 9.50 |
| Fairlead 20 | −44.00 | 12.12 | 9.50 |
| Fairlead 21 | 11.50 | 43.94 | 9.50 |
| Fairlead 22 | 22.00 | 38.10 | 9.50 |
| Fairlead 23 | 32.50 | 32.04 | 9.50 |
| Fairlead 24 | 32.50 | −32.04 | 9.50 |
| Fairlead 25 | 22.00 | −38.10 | 9.50 |
| Fairlead 26 | 11.50 | −43.94 | 9.50 |
| Fairlead 27 | −44.00 | −12.12 | 9.50 |
Three predetermined operating conditions were selected, with the yaw angle set to 0° and the wind-wave angle set to 0°. The total simulation duration was 1000 s, and the initial 300 s of unstable data were discarded.
2.4. Numerical Settings
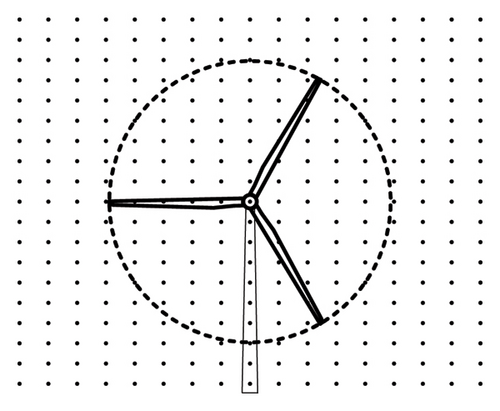
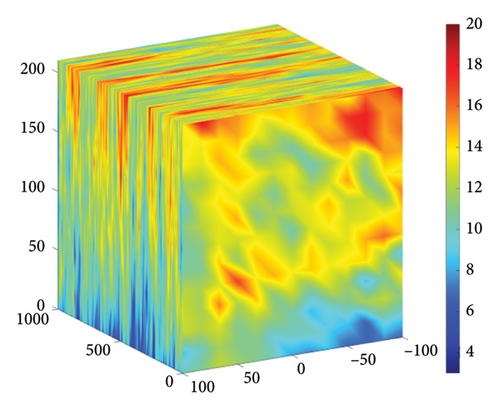
The TurbSim module in OpenFAST was utilized for turbulent wind modeling. The wind field was set up to fully cover the area above the horizontal plane of the floating platform, including the rotor and tower regions. Figure 4 illustrates the schematic diagram of the wind field grid.
Based on the cut-in wind speed, rated wind speed, and cut-out wind speed of the DTU 10 MW wind turbine, three operating conditions were set. Due to the computational requirements of the multi-physics simulation platform OpenFAST, the minimum wind speed must not be less than 8 m/s. Furthermore, wind speeds above the gale level may significantly impact the structural stability and reliability due to dynamic responses. Therefore, in this study, the minimum wind speed for the calculation conditions was set to be above 8 m/s, as shown in Table 5.
| Operating condition | Wind speed (m/s) | Significant wave height (m) | Zero-crossing period (s) | Wave spectrum |
|---|---|---|---|---|
| 1 | 8.0 | 2.6 | 9.5 | P-M |
| 2 | 11.4 | 3.2 | 10.1 | P-M |
| 3 | 25.0 | 6.0 | 11.4 | P-M |
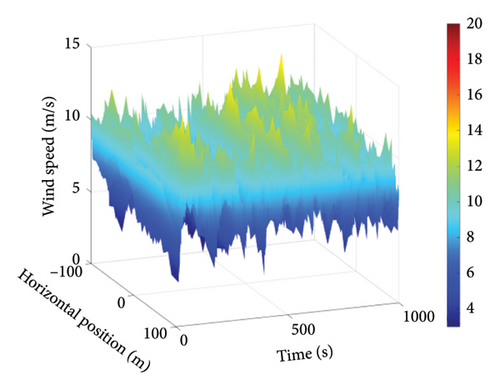
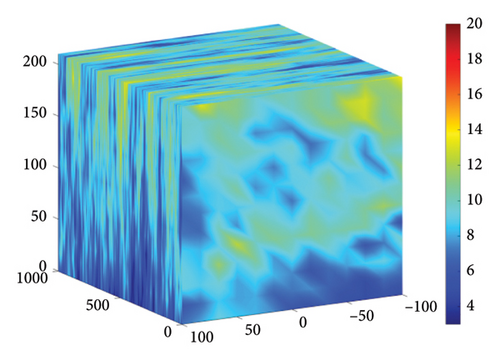
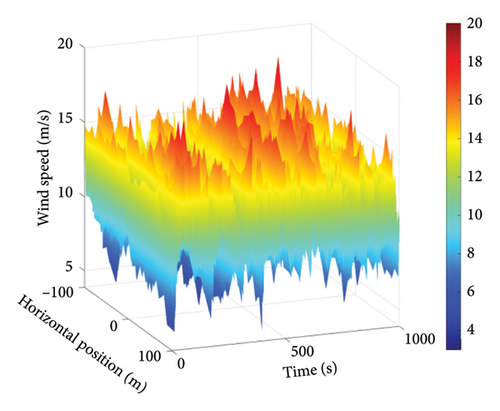
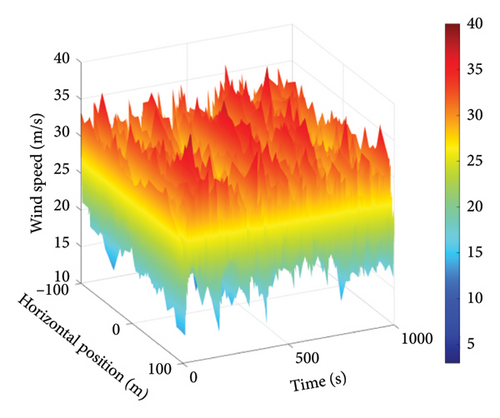
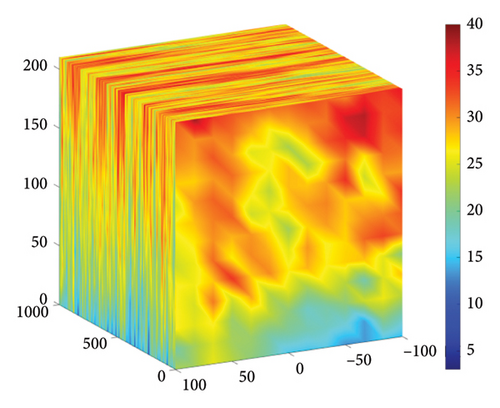
Based on the above parameters, the turbulent wind spectrum model adopts the Kaimal model. Using TurbSim, turbulent wind fields were generated for wind speeds of 8 m/s, 11.4 m/s, and 25 m/s. The wind speed variations at the hub center and the wind speeds across the entire wind field for 8 m/s, 11.4 m/s, and 25 m/s are shown in Figures 5, 6, and 7.
3. Simulation Results and Analysis
The mooring cables serve as the primary components providing restoring force for floating platforms, which is crucial for the stability of FOWTs. Currently, floating platforms equipped with offshore wind turbines typically use a mooring system consisting of three mooring lines arranged at 120° angles relative to each other. This configuration is simple and practical, making it widely used in mooring systems for floating platforms. In this section, the dynamic responses of two mooring systems under three different operating conditions are compared. Figure 8 shows the time history curves of the maximum tension in the mooring cables, surge, heave, pitch, and the fore-and-aft acceleration of the nacelle under Condition 1 for both mooring configurations.
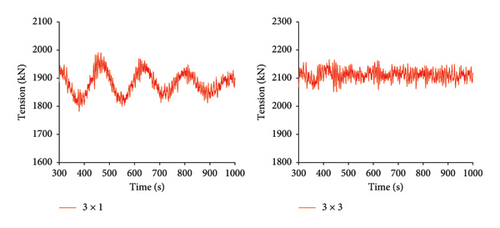
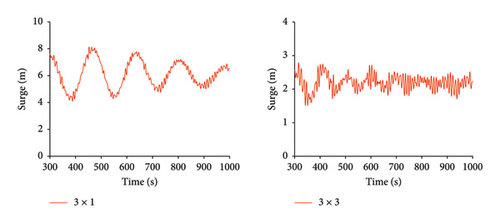

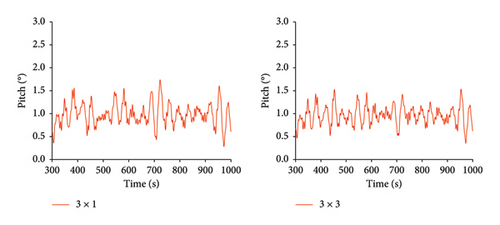
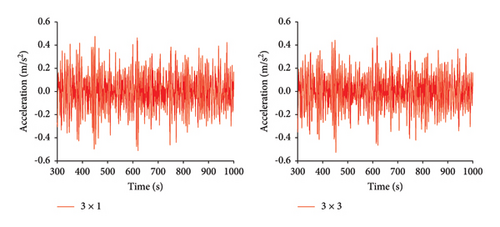
The simulation duration was 1000 s. To eliminate the effects of transient responses, the first 300 s of data were discarded, and the data from 300 s to 1000 s were analyzed. From Tables 6, 7, and 8, it can be seen that under Condition 1, the average maximum tension of the 3 × 3 mooring system is slightly higher than that of the 3 × 1 mooring system, with a difference of only 12.2%. This is because the 3 × 3 mooring system adds six more mooring lines, increasing the overall mass, which in turn increases the maximum tension in the mooring lines. However, the standard deviation of the maximum tension for the 3 × 3 mooring system is much lower than that of the 3 × 1 mooring system, indicating that the platform stability is further improved under the 3 × 3 mooring system.
| The maximum tension (kN) | Surge (m) | Heave (m) | Pitch (°) | Acceleration (m/s2) | |
|---|---|---|---|---|---|
| 3 × 1 | 1882.0 | 6.1 | 1.23 | 0.98 | −2.83 × 10⁻⁴ |
| 3 × 3 | 2111.2 | 2.2 | 0.01 | 0.96 | −2.75 × 10⁻⁴ |
| Reduction percentage | −12.2% | 63.9% | 99.1% | 2.0% | 2.8% |
| The maximum tension (kN) | Surge (m) | Heave (m) | Pitch (°) | Acceleration (m/s2) | |
|---|---|---|---|---|---|
| 3 × 1 | 38.6 | 0.99 | 0.108 | 0.23 | 0.146 |
| 3 × 3 | 18.5 | 0.22 | 0.105 | 0.20 | 0.139 |
| Reduction percentage | 52.1% | 77.7% | 2.8% | 13.0% | 4.8% |
| The maximum tension (kN) | Surge (m) | Heave (/m) | Pitch (°) | Acceleration (m/s2) | |
|---|---|---|---|---|---|
| 3 × 1 | 209 | 4.035 | 0.58 | 1.45 | 0.98 |
| 3 × 3 | 115 | 1.275 | 0.57 | 1.18 | 0.99 |
| Reduction percentage | 45.0% | 68.4% | 1.7% | 18.6% | −1.0% |
Compared to the 3 × 1 mooring system, the 3 × 3 mooring system shows a certain degree of reduction in the average value, standard deviation, and range of heave, pitch, roll, and nacelle fore-and-aft acceleration. Notably, the reductions in heave, pitch, and roll are more significant. The standard deviation of heave motion decreased the most, by 77.7%. The average value of heave motion saw the largest reduction, decreasing by 99.1%. The range of heave motion also had the largest decrease, falling by 68.4%.
The 3 × 1 mooring system exhibits larger range values for heave, pitch, and roll, primarily due to the wave loads acting mainly in the heave and pitch directions. The platform’s natural period and hydrodynamic damping significantly impact the heave motion.
As shown in Figure 9, under Condition 2, the time history curves for the maximum mooring cable tension, heave, pitch, roll, and nacelle fore-and-aft acceleration are compared for both mooring configurations.
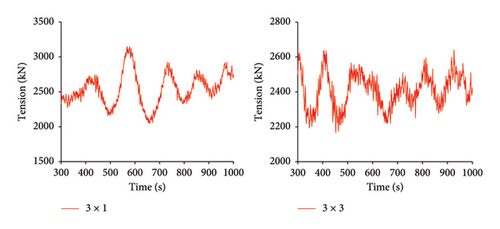
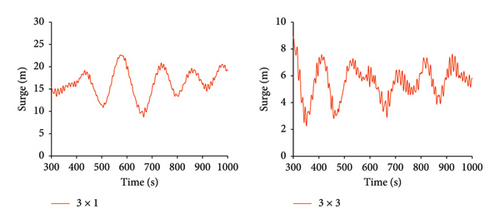
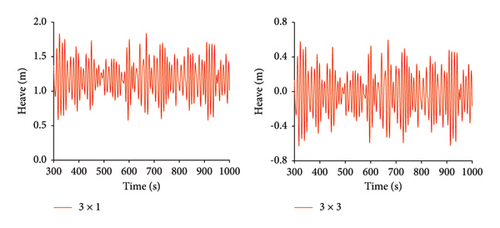
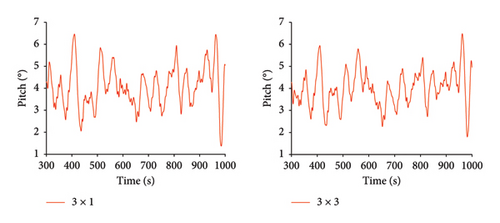
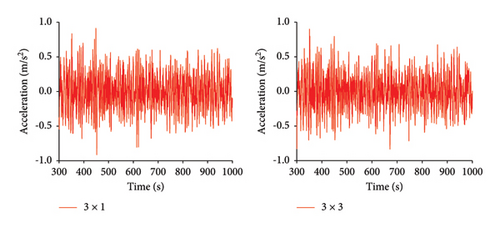
As shown in Tables 9, 10, and 11, under Condition 2, the average values, standard deviations, and ranges of tension, heave, pitch, roll, and nacelle fore-and-aft acceleration are compared between the 3 × 1 and 3 × 3 mooring systems. Compared to the 3 × 1 mooring system, the 3 × 3 mooring system shows a 4.5% reduction in the average maximum tension. However, the standard deviation and range values decrease by approximately 50%, indicating a significant improvement in the stability of the mooring cable tension under Condition 2 for the 3 × 3 mooring system.
| The maximum tension (kN) | Surge (m) | Heave (m) | Pitch (°) | Acceleration (m/s2) | |
|---|---|---|---|---|---|
| 3 × 1 | 2521.9 | 16.3 | 1.182 | 4.05 | −7.77 × 10⁻⁴ |
| 3 × 3 | 2407.1 | 5.5 | −0.028 | 4.00 | −9.89 × 10⁻⁴ |
| Reduction percentage | 4.5% | 66.3% | 102.4% | 1.2% | −27.3% |
| The maximum tension (kN) | Surge (m) | Heave (m) | Pitch (°) | Acceleration (m/s2) | |
|---|---|---|---|---|---|
| 3 × 1 | 229.5 | 3.0 | 0.245 | 0.937 | 0.244 |
| 3 × 3 | 95.6 | 1.2 | 0.238 | 0.821 | 0.237 |
| Reduction percentage | 58.3% | 60.0% | 2.9% | 12.3% | 2.9% |
| The maximum tension (kN) | Surge (m) | Heave (m) | Pitch (°) | Acceleration (m/s2) | |
|---|---|---|---|---|---|
| 3 × 1 | 1104.0 | 13.91 | 1.259 | 5.089 | 1.82 |
| 3 × 3 | 474.0 | 6.63 | 1.225 | 4.684 | 1.73 |
| Reduction percentage | 57.1% | 52.3% | 2.7% | 7.9% | 4.9% |
Surge motion shows a reduction exceeding 50% in the average value, standard deviation, and range. This is because the additional mooring cables at positions 2, 3, 8, and 9 enhance the restoring force on the platform, thereby limiting its surge motion. However, the pitch motion exhibits a less significant reduction, with the average value decreasing by 1.2%, the standard deviation by 12.3%, and the range by 7.9%. This indicates that the stability improvement in pitch motion with the 3 × 3 mooring system is relatively small. The average value of heave motion decreased to below zero, which is due to the increased overall weight from the six additional mooring cables, causing the platform to sink slightly.
When the range of nacelle acceleration exceeds 6 m/s2, the risk of nacelle failure significantly increases [16]. The fore-and-aft acceleration is much greater than the lateral acceleration. The new mooring system reduces the fore-and-aft acceleration of the nacelle from 1.82 m/s2 to 1.73 m/s2, further reducing the risk of nacelle failure.
As shown in Figure 10, under Condition 3, the time history curves for the maximum mooring cable tension, surge, heave, pitch, and nacelle fore-and-aft acceleration are compared for both mooring configurations.
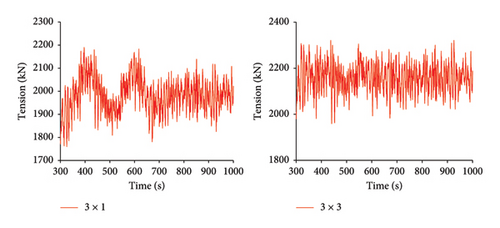
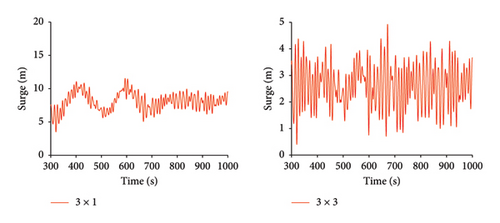
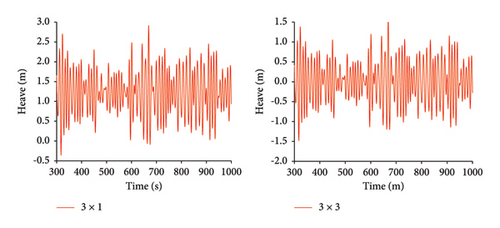
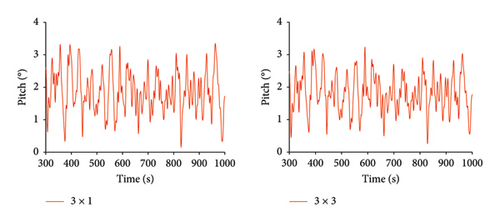
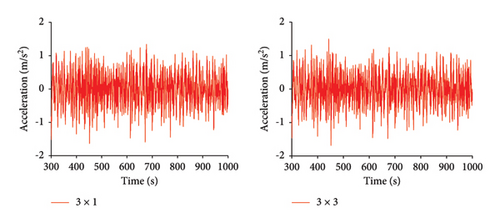
As shown in Tables 12, 13, and 14, under Condition 3, the average values, standard deviations, and ranges of the maximum mooring cable tension, surge, heave, pitch, and nacelle fore-and-aft acceleration are compared between the 3 × 1 and 3 × 3 mooring systems. Under the 3 × 3 mooring system, the standard deviation of each parameter has decreased. The maximum tension decreased by 17.0%, and surge motion decreased by 40.9%, indicating a significant improvement in the stability of the maximum tension mooring cable and surge motion. The decrease in range values also supports this observation, with the range of surge motion decreasing by 43.8%, heave motion by 6.4%, and pitch motion by 7.2%.
| The maximum tension (kN) | Surge (m) | Heave (m) | Pitch (°) | Acceleration (m/s2) | |
|---|---|---|---|---|---|
| 3 × 1 | 1983.1 | 8.07 | 1.235 | 1.860 | −4.51 × 10⁻⁴ |
| 3 × 3 | 2157.7 | 2.63 | 0.012 | 1.814 | −4.92 × 10⁻⁴ |
| Reduction percentage | −8.8% | 67.4% | 99.0% | 2.4% | −9.1% |
| The maximum tension (kN) | Surge (m) | Heave (m) | Pitch (°) | Acceleration (m/s2) | |
|---|---|---|---|---|---|
| 3 × 1 | 71.5 | 1.321 | 0.55 | 0.640 | 0.4459 |
| 3 × 3 | 59.3 | 0.78 | 0.52 | 0.574 | 0.4294 |
| Reduction percentage | 17.0% | 40.9% | 5.5% | 10.3% | 3.7% |
| The maximum tension (kN) | Surge (m) | Heave (m) | Pitch (°) | Acceleration (m/s2) | |
|---|---|---|---|---|---|
| 3 × 1 | 430.0 | 8.03 | 3.27 | 3.19 | 2.97 |
| 3 × 3 | 362.0 | 4.51 | 3.06 | 2.96 | 3.18 |
| Reduction percentage | 15.8% | 43.8% | 6.4% | 7.2% | −7.1% |
In terms of the average values, the average maximum tension slightly increased by 8.8%, while surge motion decreased by 67.4%, pitch motion decreased by 2.4%, and heave motion decreased by 99.0%. The significant decrease in heave motion is primarily due to the increased overall mass of the mooring cables, which enhances the platform’s stability in heave motion.
Considering Conditions 1, 2, and 3, the 3 × 1 mooring system exhibits smaller fluctuations in the average tension compared to the 3 × 3 mooring system. However, the standard deviation and range show a greater reduction, indicating a more uniform load distribution in the mooring lines, thereby reducing local overload or insufficient tension and enhancing the overall system stability. Therefore, it can be concluded that the stability improvement of the 3 × 3 mooring system primarily stems from a more even load distribution rather than redundancy design.
4. Conclusions
- 1.
Enhanced Platform Stability: The 3 × 3 mooring configuration significantly improves platform stability under all conditions. Notably, in surge and heave motions, there are substantial reductions in the average values, standard deviations, and ranges, indicating a significant enhancement in platform stability for these motion modes.
- 2.
Optimized Mooring Tension Distribution: Compared to the 3 × 1 mooring configuration, the 3 × 3 mooring configuration exhibits a more balanced mooring tension distribution under different conditions. Although the average maximum tension slightly increased, the standard deviation and range significantly decreased. Particularly under Condition 2, the standard deviation and range decreased by approximately 50%, indicating a marked improvement in the stability of mooring cable tension.
- 3.
Reduced Nacelle Motion Risk: The 3 × 3 mooring configuration effectively reduces the fore-and-aft acceleration of the nacelle, decreasing the risk of nacelle failure. Under Condition 2, the range of nacelle fore-and-aft acceleration decreased from 1.82 m/s2 to 1.73 m/s2, further demonstrating the advantage of the new mooring configuration in reducing nacelle motion risk.
- 4.
The 3 × 3 mooring system requires an additional six mooring chains, which means a greater demand for materials such as steel cables, mooring equipment (e.g., anchors, anchor piles), and connectors (e.g., shackles, chain links). Therefore, in practical engineering applications, it is essential to comprehensively consider the balance between cost and performance and make a reasonable trade-off between economic feasibility and system stability.
The 3 × 3 mooring configuration consistently demonstrates higher stability across various conditions, especially in enhancing the stability of surge and heave motions. This indicates that the newly developed 3 × 3 mooring system has significant advantages in improving platform dynamic response and enhancing the operational stability of the wind turbine.
Conflicts of Interest
The authors declare no conflicts of interest.
Author Contributions
Hao Zhang designed and supervised the experiments. Hao Zhang conducted the experiments and drafted the manuscript. Mocheng Yi, Dazhao Sun and Zhipeng Chen carried out some experiments and evaluated the data. Hao Zhang revised this paper. All authors read and approved the final manuscript.
Funding
This research was not supported. We appreciate ChatGPT’s assistance in the translation and language polishing of this paper.
Acknowledgments
This research was not supported. We appreciate ChatGPT’s assistance in the translation and language polishing of this paper.
Open Research
Data Availability Statement
The data that support the findings of this study are available on request from the corresponding author. The data are not publicly available due to privacy or ethical restrictions.


