Prediction of Rock Damage Depth Using Blasting Vibration Monitoring
Abstract
This study conducted vibration monitoring and acoustic testing on rock slopes subjected to blasting operations within the elevation range of 988.0–898.0 m at the left bank abutment slot of the Wudongde Hydropower Station. Systematic investigations were performed on the vibration attenuation patterns across nine excavation benches. By incorporating elevation parameters, a regression-based correlation was established between distance-dependent peak particle velocity (PPV) measurements and the depth of rock mass damage, thereby facilitating predictive assessments of structural deterioration. The analysis revealed that in slopes characterized by homogeneous lithology and an absence of significant structural discontinuities, PPV induced by bench presplit blasting exhibited a strong exponential correlation with the depth of retaining rock mass damage. Validation of the proposed exponential model demonstrated prediction errors of 9.43% for maximum damage depth and 8.70% for average values when compared with field measurements. The close alignment between predicted and observed data confirms the reliability of this model for estimating blast-induced rock damage, providing an effective alternative to extensive acoustic testing programs in large-scale slope engineering projects.
1. Introduction
Drill-and-blast methods remain prevalent for high rock slope excavation across transportation infrastructure, hydropower construction, and mining sectors due to cost efficiency, operational reliability, and productivity [1–3]. During contour blasting, detonation forces near exposed surfaces inevitably damage retaining rock masses, creating blast-affected zones that compromise structural integrity and residual strength in foundation strata critical for dams and bridges [4, 5]. This blast-initiated deterioration progresses through construction-phase disturbances—repeated detonations, weathering, and hydrological infiltration—potentially triggering partial or complete geotechnical failures with significant financial implications and regional safety risks [6, 7]. Consequently, precise methodologies for defining slope damage parameters and controlling explosive impact boundaries are essential for maintaining geomechanical stability and preventing catastrophic failures.
Current blast damage assessment techniques in rock slope engineering comprise two principal approaches: direct quantification and indirect evaluation [8]. Direct methods characterize microdefect parameters (density, dimensions, morphology, and spatial distribution) as fundamental damage indicators. These metrics serve as fundamental indicators for damage evaluation. Based on defect localization, these approaches are further categorized into surface morphology analysis, utilizing advanced optical microscopy [9], electron microscopy systems [10, 11], 3D laser scanning technology [12, 13], and borehole imaging devices [14, 15], alongside subsurface structure investigation employing x-ray computed tomography (CT) [16, 17]. Indirect methodologies primarily focus on analyzing alterations in geomechanical properties to derive damage indices through measurable physical parameters. Common evaluation criteria include deformation characteristics [18], seismic wave propagation velocities [19, 20], electromagnetic response patterns [21, 22], acoustic emission signatures [23, 24], thermal radiation profiles [25, 26], and resistivity variations [27, 28]. While most of abovementioned measurement techniques, for example, CT scanning and thermal imaging, are limited in laboratory tests, so it is troublesome and impractical to apply them to evaluate the blast-induced damage in on-site operations. Conventional field measurement practices often face limitations including operational complexity, extended duration requirements, and substantial financial investments. Among the available options for evaluating slope excavation damage in situ, seismic velocity analysis has emerged as the predominant technique due to its operational simplicity, cost-effectiveness, and time-efficient implementation within high rock slope engineering projects [29].
The extent of rock damage caused by blasting exhibits a strong correlation with peak particle velocity (PPV), prompting significant research efforts to establish predictive models through rock damage–PPV relationships [6]. This methodological approach considerably reduces both time and financial costs associated with field damage assessments. Pioneering work by Imashev et al. [29] introduced a contour-blasting damage prediction framework that utilized vibration-damage correlations. Simangunsong et al. [30] analyzed vibration-induced damage in slopes across open pit mines to revise regulatory PPV limits based on joint spacing and dominant frequency. Kumar et al. [31] calibrated the USBM scaled-distance equation using 214 blasts in quarries, incorporating anisotropic factors like bedding plane orientation, and improved PPV prediction accuracy by 32% in stratified slopes. Complementary studies by Tang et al. [32] employed acoustic testing to establish relationships between vibration and damage depth in slope engineering, while Khandelwal and Saadat [33] integrated field monitoring with computational modeling to validate the correlations between PPV and damage. The continuum of research expanded through the systematic exploration of PPV’s predictive capacity for rock mass integrity conducted by many researchers also [34–38]. Continuous refinement of empirical formulations has enhanced their practical applicability within blast engineering contexts [39–41], with modern approaches increasingly incorporating intelligent algorithms [42–44] that effectively manage data ambiguity without necessitating explicit theoretical frameworks.
A critical yet underexplored factor in blasting vibration prediction is the elevation-dependent amplification effect, particularly in rock slopes with significant topographic variations. Traditional empirical models (e.g., the Sadowsky formula) predominantly correlate vibration attenuation with scaled distance (i.e., charge weight and source distance) but neglect the role of elevation differences. This omission introduces substantial prediction errors in terrains with steep gradients, where the ‘whiplash effect’—a phenomenon where vibration velocity amplifies with increasing elevation due to resonance between the blast load frequency and the natural frequency of slope structures—becomes pronounced [45, 46]. Field studies confirm that such amplification can elevate PPV by 30∼60% at higher elevations compared with base levels, rendering conventional models inadequate (average errors: 42∼59%) [47, 48]. Current methodologies predominantly neglect elevation differentials in vibration propagation analysis, despite empirical evidence indicating significantly amplified vibration parameters at elevated monitoring positions compared with equivalent horizontal plane locations [49]. This phenomenon of elevation-induced amplification underscores the necessity for systematic integration of topographic factors when analyzing vibration attenuation patterns during high rock slope-blasting operations.
This study pioneers the development of a relationship between blast-induced damage and PPV that explicitly incorporates elevation difference. Blast-induced damage was quantified through acoustic testing, while PPV values were derived from blasting vibration monitoring records. Leveraging this relationship alongside vibration and acoustic datasets, a predictive model for blast-induced damage was established via regression analysis. By inputting PPV values into the model, we successfully forecasted blast-induced damage for the 10th bench blasting operation in the left bank abutment slot at Wudongde Hydropower Station. Results confirm the feasibility and efficacy of the proposed predictive model.
2. Engineering Geology and Blasting Design
2.1. Engineering Geology
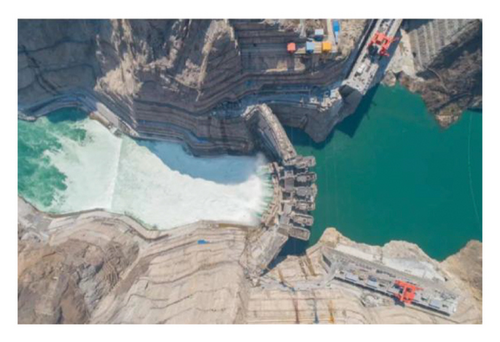
The Wudongde Hydropower Station is located within an asymmetrical V-shaped gorge along the lower Jinsha River basin, straddling the border between Luquan County in Yunnan Province and Huidong County in Sichuan Province. This engineering marvel ranks as the fourth-largest hydropower facility in China and seventh globally, with a remarkable generation capacity of 10,200 MW. The structure features a concrete hyperbolic arch design that reaches a maximum elevation of 270 m, with its crest situated at an altitude of 988.0 m above the sea level. Geological surveys indicate distinct slope characteristics: the left bank exhibits a high rock slope with a natural inclination of approximately 42°, while the right bank presents a steeper angle of 65°. Both abutment slopes flanking the dam structure have vertical elevations ranging from 200 to 300 m (Figure 1(a)).
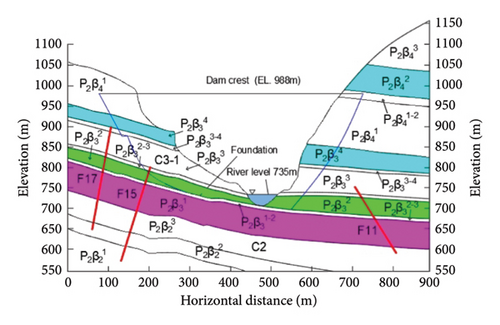
The surrounding bedrock of the dam site is fully exposed, with slopes predominantly characterized by weakly weathered rock formations that exhibit favorable structural integrity. The foundation of the abutment consists of robust geological materials, primarily composed of basaltic rocks from the Emeishan Formation. The arch abutment slope structure mainly contains basalts from the P2β3 to P2β4 series, with stratigraphic orientations measuring N40°–55°E and SE∠20°–25° (Figure 1(b)). Within the elevation range of 988.0–828.0 m, the geological profile of the left dam foundation primarily includes and basalt strata. The elevation range from 988.0 to 975.0 m features Class III2 bedrock characterized by microcrystalline basalt exhibiting moderate weathering in its lower sections. From elevations between 975.0 and 828.0 m, the foundation transitions into Class III1 bedrock consisting of clinopyroxene-rich basalt that displays similar weathering patterns, demonstrating uniaxial compressive strength values ranging from 75 to 97 MPa.
2.2. Bench-Blasting Design
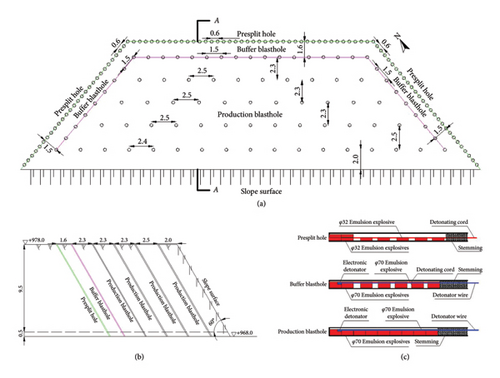
This investigation focuses on the construction of the high rock slope at the left abutment of the dam project. The design specifies a bench height of 10 m, with excavation slopes ranging from 1:0.74 to 1:0.95. Field-derived experimental data optimized explosive parameters for slope formation, with comprehensive blasting specifications detailed in Table 1. Initiation networks and charge configurations exhibited fundamental similarities across blasting operations, as schematically illustrated in Figure 2. To preserve slope integrity, presplitting techniques were implemented along designated contours, effectively mitigating blast-induced damage to the retaining rock masses. Production holes employed axial continuous charging, while both presplit and buffer holes utilized decoupled intermittent charging patterns. Electronic detonators ensured precise timing sequences: presplit holes were detonated first, followed by production holes and, subsequently, buffer holes. Temporal control parameters included intrahole delays of 18 ms for presplit operations and 25 ms for buffer charges. Production hole sequencing incorporated 17 ms interhole intervals combined with 31 ms inter-row delays to optimize fragmentation efficiency.
| Blasthole | Drilling parameter | Charging parameter | |||||
|---|---|---|---|---|---|---|---|
| Diameter (mm) | Length (m) | Spacing (m) | Burden (m) | Stemming (m) | Charge diameter (mm) | Weight per hole (kg) | |
| Presplit hole | 90 | 1.1∼12.5 | 0.6∼0.8 | — | 0.5∼0.7 | 32 | 0.6∼6.9 |
| Buffer blasthole | 90 | 1.1∼12.5 | 1.5∼1.6 | — | 0.7∼1.5 | 70 | 2.0∼22.0 |
| Production blasthole | 90 | 1.4∼12.5 | 2.4∼2.5 | 2.3∼2.5 | 0.6∼2.4 | 70 | 4.0∼40.0 |
3. Damage Depth Measurement
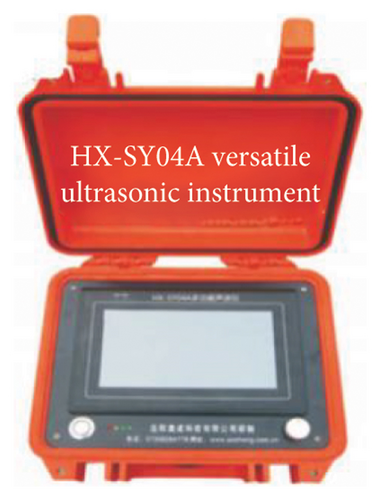
To evaluate postblast damage extent in slope benches, acoustic measurements were conducted pre- and postblasting using the HX-SY04A acoustic detection system (Hunan Aocheng Technology Co., Ltd., Changsha, China; Figure 3). This apparatus features a sampling interval of 0.1∼499 ms, operates within a 10∼200,000 Hz frequency bandwidth, and achieves 0.1 ms accuracy in acoustic wave travel time measurements. During testing, dual-transducer configurations were utilized: cross-hole devices (Figure 3(b)) and single-hole probes (Figure 3(c)). This approach ensured comprehensive data acquisition across homogeneous rock masses.
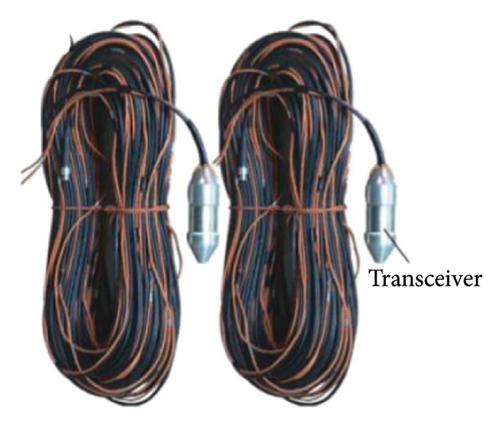
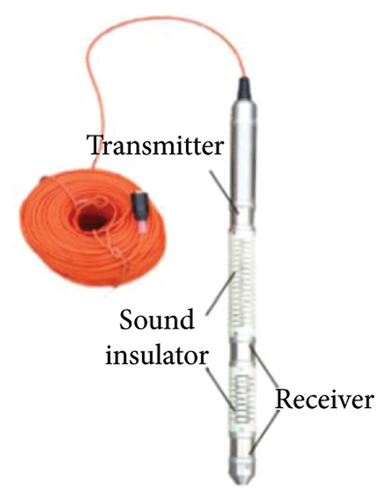
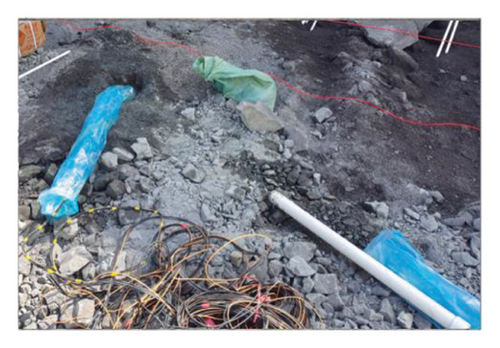
Hydraulic structure engineering standards for rock foundation excavation define geological formations as critically compromised when the damage index η exceeds 10%, indicating significant structural degradation. This parameter serves as an industry-standard metric for quantifying blast-induced rock mass deterioration. Subsurface fracture characteristics are evaluated through depth-dependent η-value profiling across excavated surfaces. The acoustic testing methodology and field implementation for rock mass damage assessment are detailed in Figure 3.
- 1.
Acoustic holes were drilled prior to the explosive charging holes. Inclined acoustic holes were drilled from the surface of the blast area, penetrating through the blast zone to reach the preserved presplit plane, extending 6 m beyond this plane, resulting in a total hole depth of 8–10 m, with a diameter of 90 mm. Two sets of acoustic holes were drilled in the blasting test area. As different benches have distinct excavation faces, the spacing between the two sets of acoustic holes was determined based on the size of the blasting zone to ensure the representativeness of the acoustic test results. Each set comprises three mutually parallel boreholes.
- 2.
During acoustic testing, the acoustic hole must first be filled with fresh water (acting as the coupling agent for acoustic testing). It is essential to ensure the acoustic probe is fully submerged in water throughout the testing process while also maintaining stable water levels within the hole. The first acoustic test (including both single-hole and cross-hole measurements) was conducted 1∼2 days before the trial bench blasting. Upon completion of the acoustic test, the fresh water in the hole was pumped out. Subsequently, high-pressure air was used to dry the moisture on the hole walls. Finally, the acoustic holes were filled with fine sand to prevent the crushed stones during blasting process from entering the acoustic holes.
- 3.
After the blastholes were drilled and charged, blasting was initiated. Subsequent to the blast, once the muck pile was cleared to an appropriate height, the fine sand within the acoustic holes were removed using high-pressure air. The acoustic holes were then refilled with fresh water, and postblast acoustic testing (including both single-hole and cross-hole measurements) was performed.
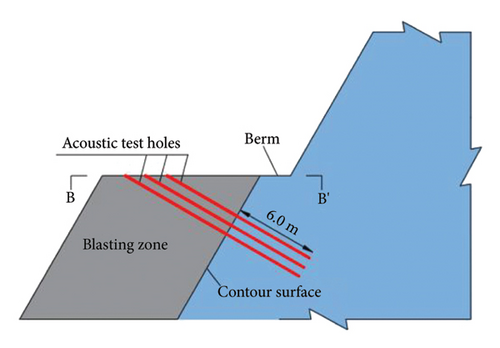

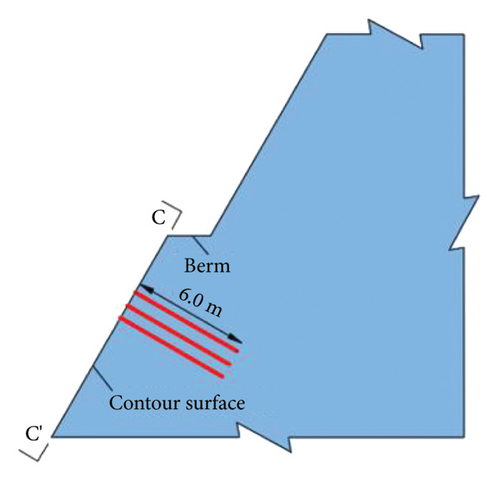
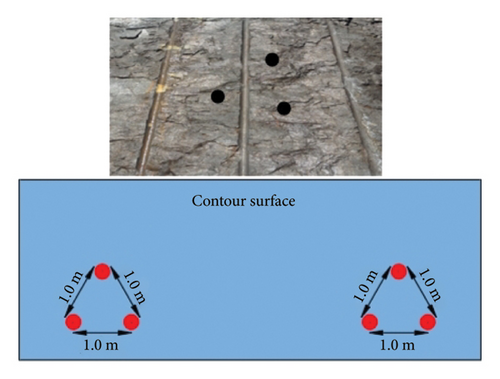
Prior to bench excavation, twelve acoustic surveys (six each of cross-hole and single-hole measurements) established baseline VP in rock masses beneath the contour surface. Postblasting, the remaining boreholes exhibited the configuration shown in Figure 5. Following removal of stemming fine sand, an additional twelve acoustic tests (six cross-hole and six single-hole) determined postblast VP values in residual rock masses.
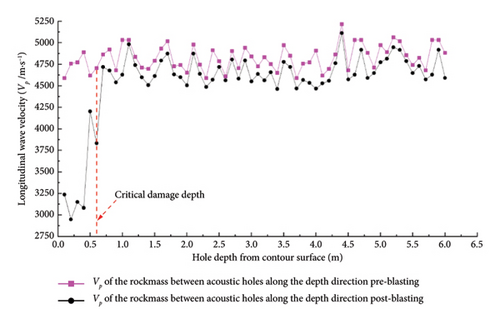
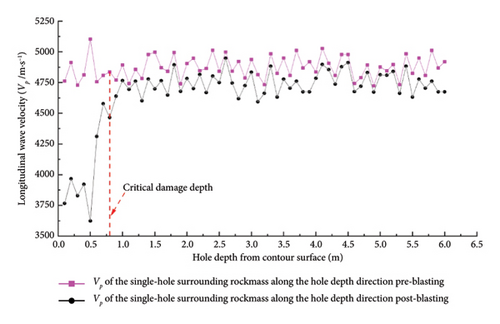
Figure 6 illustrates VP variations pre- and postbench blasting. By integrating acoustic test results with equation (3), mean damage extent for individual slope benches was quantified through combined cross-hole and single-hole analyses. Damage depths in retaining rock masses following each bench blast are summarized in Table 2.
| Number of bench | Minimum damage depth d1 (m) | Maximum damage depth d2 (m) | Average damage depth dp (m) |
|---|---|---|---|
| 1 | 0.39 | 0.63 | 0.51 |
| 2 | 0.30 | 0.58 | 0.44 |
| 3 | 0.39 | 0.43 | 0.49 |
| 4 | 0.31 | 0.51 | 0.41 |
| 5 | 0.33 | 0.53 | 0.43 |
| 6 | 0.36 | 0.62 | 0.49 |
| 7 | 0.27 | 0.51 | 0.39 |
| 8 | 0.25 | 0.53 | 0.39 |
| 9 | 0.27 | 0.57 | 0.42 |
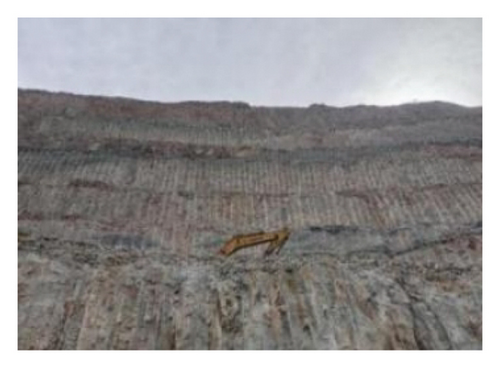
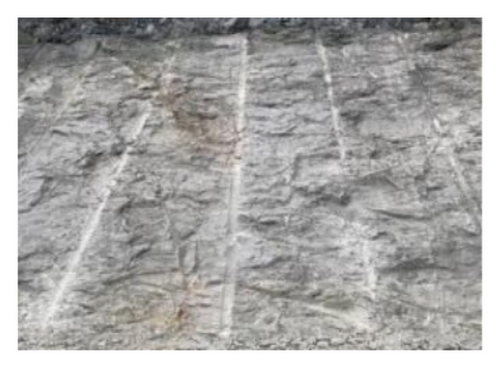
Presplitting blasting is extensively employed in high-slope rock excavation due to its efficacy in stress wave attenuation. During implementation, charges in presplit holes detonate prior to production blasts, generating engineered fracture planes along designed interfaces between excavation zones and protected slopes. These precursor discontinuities effectively intercept and attenuate stress waves from subsequent production blasting, limiting energy transfer to adjacent rock masses and thereby minimizing structural damage to retained slopes. Under optimal presplitting conditions, damage in retaining rock masses can be exclusively attributed to the presplit blast itself [51–54]. Figure 7 illustrates the resultant slope profile achieved through this technique.
4. Blasting Vibration Monitoring
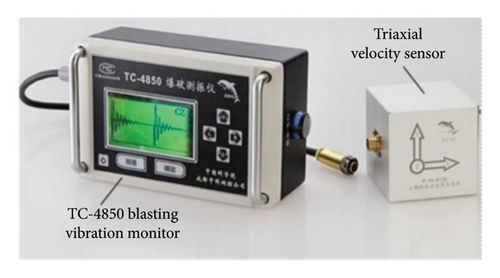
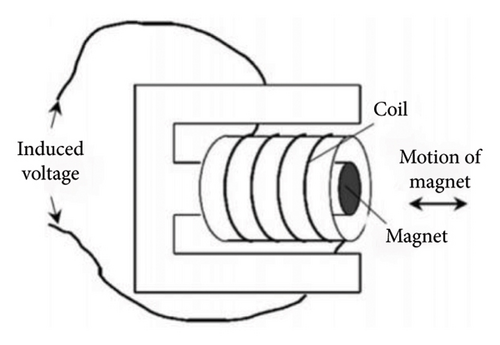
To characterize vibration propagation in rock masses during bench blasting, specialized monitoring was implemented using TC-4850 blast vibration recorders (Chengdu Zhongke Measurement and Control Co., Ltd., China) paired with triaxial velocity sensors (Figure 8(a)). This instrumentation incorporates moving-coil transducers, featuring magnetic suspension systems interacting with induction coils (Figure 8(b)). The system operates within a velocity range of 0.001∼35.0 cm/s and frequency bandwidth of 5∼300 Hz, achieving a velocity resolution of 0.01 cm/s.
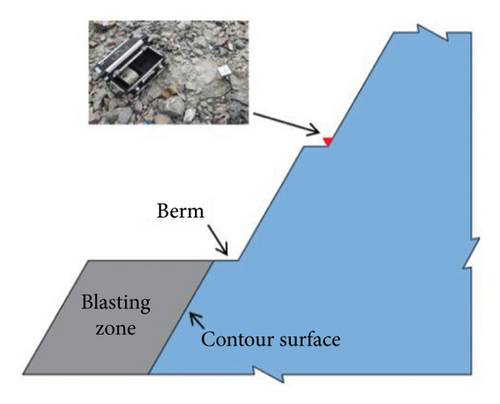
To characterize blast vibration attenuation while ensuring measurement fidelity, a monitoring network was established at upper slope bench toes (Figure 9(a)). For the fifth bench blasting, ten vibration monitoring points were strategically positioned at bench toes behind the blasting zone, accounting for site-specific conditions (Figure 9(b)).
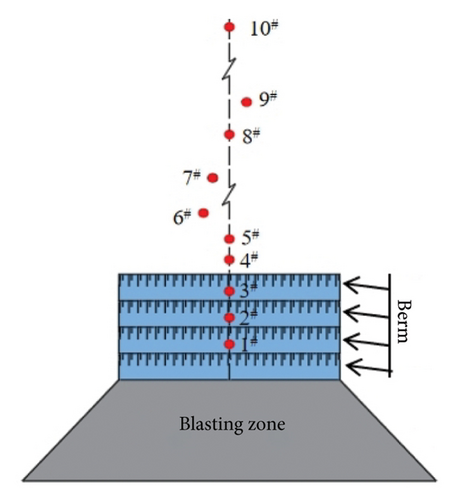
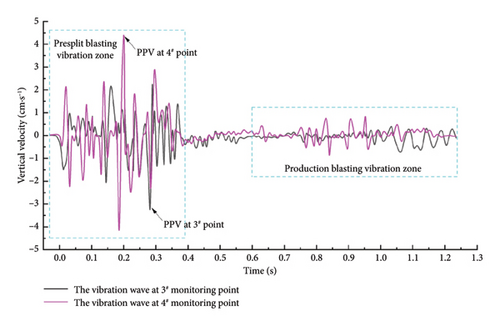
Given elevation variations between monitoring stations and the excavation level, vertical vibration waveforms were analyzed to evaluate altitude-dependent attenuation mechanisms. Representative vertical vibration records from EL. 978 m (Point 3#) to EL. 988 m (Point 4#) exhibit distinct seismic profiles (Figure 10). Leveraging the detonation sequence (Figure 2(a)) and established analytical principles, PPV measurements from presplit blasting provide the basis for estimating damage extent in retaining rock masses adjacent to the detonation zone.
| Number of testing bench | Coefficient of equation (4) | R2 | Quantity of monitoring points | Maximum single dose (kg) | ||
|---|---|---|---|---|---|---|
| K | α | β | ||||
| T1 | 49.7 | 1.171 | 0.082 | 0.80 | 7 | 6.9 |
| T2 | 44.2 | 1.052 | 0.089 | 0.82 | 11 | 6.9 |
| T3 | 33.7 | 1.133 | 0.104 | 0.85 | 11 | 6.9 |
| T4 | 41.3 | 1.102 | 0.097 | 0.87 | 17 | 6.6 |
| T5 | 39.4 | 1.084 | 0.107 | 0.84 | 10 | 6.6 |
| T6 | 35.9 | 1.149 | 0.183 | 0.89 | 15 | 6.9 |
| T7 | 33.7 | 1.057 | 0.091 | 0.87 | 17 | 6.9 |
| T8 | 39.6 | 1.144 | 0.113 | 0.85 | 16 | 6.6 |
| T9 | 34.9 | 1.201 | 0.093 | 0.88 | 17 | 6.9 |
5. Damage Prediction
5.1. Relationship Between Blasting Damage Depth and PPV
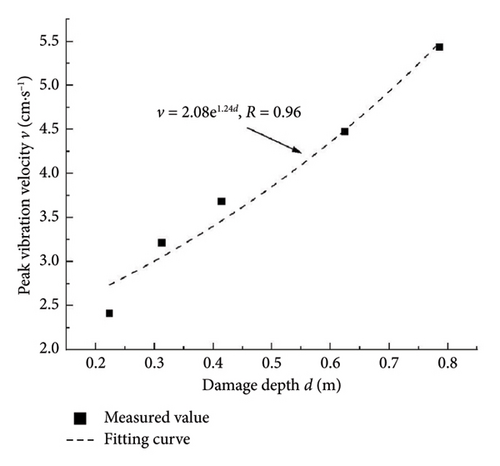
5.2. Rock Damage Depth Prediction
Through synergistic integration of retaining rock mass damage depths with field vibration monitoring data, regression analysis establishes the relationship between rock damage depth and PPV across variable horizontal distances (D) and elevation differentials (H). PPV values corresponding to discrete D and H combinations were derived via the vibration attenuation law (equation (4)), calibrated using first-to-ninth bench blasting data (Table 4).
| D (m) | H (m) | PPV (cm·s−1) | ||||||||
|---|---|---|---|---|---|---|---|---|---|---|
| T1 | T2 | T3 | T4 | T5 | T6 | T7 | T8 | T9 | ||
| 20 | 10 | 5.88 | 4.53 | 6.35 | 4.38 | 4.69 | 5.58 | 4.39 | 5.54 | 4.91 |
| 25 | 20 | 5.31 | 3.77 | 5.89 | 3.59 | 3.90 | 5.35 | 3.85 | 4.67 | 4.26 |
| 30 | 30 | 4.77 | 3.62 | 5.03 | 3.38 | 3.79 | 4.31 | 3.52 | 3.76 | 4.04 |
| 35 | 40 | 4.72 | 3.55 | 4.79 | 3.06 | 3.20 | 4.12 | 3.14 | 3.60 | 3.47 |
| 40 | 50 | 4.35 | 3.69 | 4.31 | 2.86 | 2.99 | 3.71 | 2.88 | 3.29 | 3.33 |
| 45 | 60 | 3.69 | 2.88 | 3.73 | 2.43 | 2.31 | 3.06 | 2.26 | 2.22 | 2.36 |
| 50 | 70 | 3.19 | 2.01 | 3.61 | 2.26 | 1.58 | 2.99 | 1.49 | 1.48 | 1.78 |
| 55 | 80 | 2.74 | 1.38 | 2.30 | 2.04 | 1.20 | 2.71 | 1.06 | 1.01 | 1.35 |
| 60 | 90 | 2.51 | 2.20 | 1.87 | 0.89 | 0.99 | 2.35 | 0.86 | 0.96 | 1.33 |
| 65 | 100 | 2.01 | 0.55 | 1.33 | 1.06 | 0.65 | 1.33 | 0.43 | 0.55 | 0.50 |
| 70 | 110 | 1.17 | 0.39 | 1.24 | 0.82 | 0.43 | 1.04 | 0.35 | 0.29 | 0.35 |
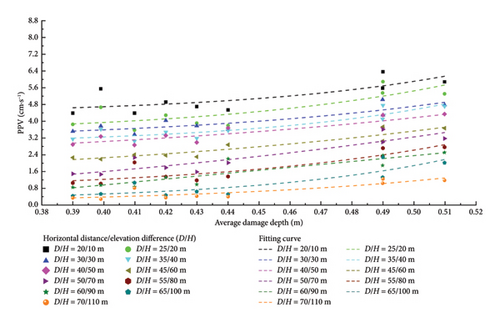
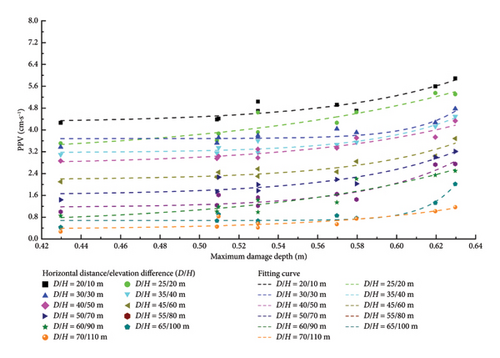
Incorporating measured damage depths (Table 2) and calculated PPV values (Table 4), equation (5) models the damage depth–PPV relationship through multivariable regression. Results are presented in Figure 12 and tabulated in Table 5. The regression parameters in Table 5 enable predictive modeling of retaining rock mass damage depths for subsequent bench-blasting operations.
| D (m) | H (m) | Average damage depth (m) | Maximum damage depth (m) | ||
|---|---|---|---|---|---|
| Fitting formula | R2 | Fitting formula | R2 | ||
| 20 | 10 | 0.80 | 0.85 | ||
| 25 | 20 | 0.82 | 0.81 | ||
| 30 | 30 | 0.83 | 0.83 | ||
| 35 | 40 | 0.89 | 0.86 | ||
| 40 | 50 | 0.87 | 0.88 | ||
| 45 | 60 | 0.85 | 0.88 | ||
| 50 | 70 | 0.80 | 0.89 | ||
| 55 | 80 | 0.85 | 0.80 | ||
| 60 | 90 | 0.82 | 0.85 | ||
| 65 | 100 | 0.80 | 0.85 | ||
| 70 | 110 | 0.83 | 0.81 | ||
5.3. Actual Testing and Verification
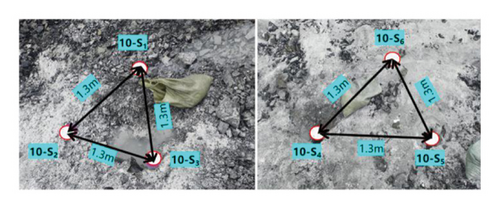
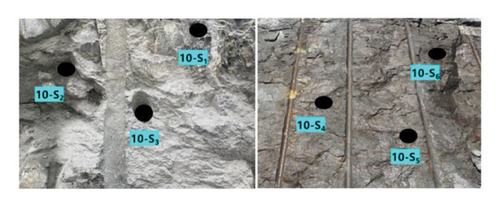
Six acoustic boreholes enabled single- and cross-hole testing to assess postblast damage depth in retaining rock masses. Figure 13 documents borehole configurations pre- and postblasting. Acoustic testing revealed marked VP reduction near contour surfaces versus intact rock masses, indicating damage development in adjacent retaining rock masses. Measured damage depths after the 10th bench blasting are quantified in Table 6.
| Number of hole | Damage depth (m) |
|---|---|
| 10-S11 | 0.37 |
| 10-S2 | 0.41 |
| 10-S3 | 0.50 |
| 10-S1S22 | 0.49 |
| 10-S1S3 | 0.46 |
| 10-S2S3 | 0.51 |
| 10-S4 | 0.43 |
| 10-S5 | 0.41 |
| 10-S6 | 0.46 |
| 10-S4S5 | 0.42 |
| 10-S4S6 | 0.53 |
| 10-S5S6 | 0.47 |
- 1Represents single-hole acoustic tests.
- 2Represents cross-hole acoustic tests.
Applying equation (6), we computed location-specific PPV values. These were input into Table 5 empirical correlation between PPV and damage depth, generating predicted damage depths (Table 7).
| D (m) | H (m) | PPV (cm·s−1) | Average damage depth (m) | Maximum damage depth (m) |
|---|---|---|---|---|
| 20 | 10 | 5.71 | 0.47 | 0.52 |
| 25 | 20 | 5.43 | 0.50 | 0.54 |
| 30 | 30 | 4.59 | 0.44 | 0.51 |
| 35 | 40 | 4.55 | 0.45 | 0.46 |
| 40 | 50 | 4.68 | 0.41 | 0.49 |
| 45 | 60 | 3.29 | 0.44 | 0.48 |
| 50 | 70 | 3.04 | 0.51 | 0.53 |
| 55 | 80 | 2.95 | 0.43 | 0.48 |
| 60 | 90 | 2.17 | 0.50 | 0.54 |
| 65 | 100 | 1.98 | 0.47 | 0.51 |
| 70 | 110 | 1.06 | 0.40 | 0.49 |
According to Tables 6 and 7, the predicted and measured values of the average damage depth of the retaining rock masses following the 10th bench blasting were 0.42 m and 0.46, respectively, resulting in a relative error of 8.70%. The predicted and measured values for the maximum damage depth were recorded at 0.48 m and 0.53, respectively, yielding a relative error of 9.43% (Table 8). The relatively small prediction errors—each less than 10%—demonstrate that the proposed predictive model is both feasible and efficient.
| Project | Maximum damage depth (m) | Average damage depth (m) |
|---|---|---|
| Measured value | 0.53 | 0.46 |
| Predicted value | 0.48 | 0.42 |
| Relative error | 9.43% | 8.70% |
5.4. Theoretical Basis of the PPV–Damage Depth Relationship
5.4.1. Theoretical Link to Wave Attenuation Dynamics
5.4.2. Fracture Mechanics Justification
5.4.3. Model Refinements and Validation
- 1.
Coefficient interpretation:
-
Parameter C now explicitly represents the reference damage depth at zero PPV (theoretically linked to pre-existing fracture networks), while k quantifies the attenuation rate (controlled by rock quality Q-value and damping ratio ζ).
- 2.
Field data correlation:
-
Added validation using ultrasonic testing of blast-damaged rock cores, showing a strong correlation (R2 = 0.91) between measured crack depths and model predictions.
5.5. Limitations and Generalizability
5.5.1. Applicability to Heterogeneous Rock Masses
5.5.2. Implications for Structurally Controlled Slopes
In slopes dominated by discontinuities (e.g., joints, faults, or weak planes), stress waves scatter at structural boundaries, diminishing elevation amplification but increasing diffraction-induced damage. Our model’s damage depth prediction (based on PPV thresholds) remains valid if discontinuities are persistent and oriented parallel to the slope face [64]. However, for adverse geometries (e.g., steeply dipping joints perpendicular to the slope), vibration energy concentrates along planes, potentially localizing damage beyond predictions. In such cases, coupling our PPV model with fracture mechanics criteria (e.g., stress intensity factor KI at crack tips) is recommended [58].
5.5.3. Validation Scope and Future Work
- 1.
Incorporating lithology-dependent attenuation terms (e.g., the geological quality index (Q)).
- 2.
Quantifying structural damping via joint roughness coefficients (JRCs).
- 3.
Field trials in complex formations.
6. Conclusion
- 1.
This vibration monitoring method provides a practical alternative to traditional acoustic testing for assessing blast-induced damage. By establishing the relationship between measured PPV from previous blasts and damage depth in retaining rock masses, it enables rapid, cost-effective prediction of damage depth after subsequent bench blasting. This approach significantly reduces reliance on extensive postblast acoustic surveys, allowing for timely assessment to guide slope support construction while maintaining sufficient accuracy for engineering purposes.
- 2.
Analysis of presplit blasting vibration attenuation revealed a strong correlation (R2 > 0.8) between site-adjusted PPV and damage depth. This robust correlation forms the basis of a simple, efficient, and economical prediction model for estimating damage in subsequent bench blasts. By utilizing routinely monitored blast vibration data (PPV), this model eliminates the resource-intensive requirements of traditional acoustic testing methods, streamlining the damage assessment process for slope operations.
- 3.
Validation of the PPV-based damage depth prediction model against field data (10th bench blast) confirmed its practical engineering utility. With maximum and average damage depth prediction errors below 10% (9.43% and 8.70%, respectively), the model provides sufficiently accurate estimates for onsite decision-making. Crucially, this method serves as a reliable substitute for extensive acoustic testing, enabling efficient, near real-time damage assessment after blasting and enhancing operational efficiency in slope management. Future work will integrate lithology-specific impedance and discrete fracture networks to enhance generalizability.
Conflicts of Interest
The authors declare no conflicts of interest.
Author Contributions
Defeng Hou: methodology, validation, formal analysis, investigation, and writing the original draft. Fuming Liu: reviewing and editing. Zhiyong Yang: validation and reviewing and editing. Haoyu Guo: investigation. Ting Zuo: resources.
Funding
This research was funded by the Natural Science Foundation of Xinjiang Uygur Autonomous Region, grant number 2024D01A102, the third batch of “Tianchi Talents” Introduction Program Youth Doctoral Project Fund of Xinjiang Uygur Autonomous Region, the Special Funding for the R&D and Innovation Team of Key Technologies and Equipment for Intelligent Safety Warning in Open-Pit Mine Blasting Operations, China.
Open Research
Data Availability Statement
The data that support the findings of this study are available on request from the corresponding author. The data are not publicly available due to privacy or ethical restrictions.


