Enhancing Latent Defect Detection in Built-In Spindle Assembly Lines Through Vibration Data Analysis
Abstract
This study proposed a novel machine learning–driven methodology for detecting potential defects in computer numerical control (CNC) spindle manufacturing. The methodology, which analyzes 13 real-world built-in spindles, employs t-distributed stochastic neighbor embedding (t-SNE) for data visualization and enhances k-means++ clustering with the Davies–Bouldin Index (DBI) for the automatic selection of the optimal number of clusters, significantly surpassing traditional inspection methods in identifying subtle yet critical defects. This study utilized the fast Fourier transform (FFT) for precise feature extraction. The integration of these advanced algorithms accurately identified defects and categorized them, thus optimizing manufacturing processes. The inclusion of the DBI in the k-means++ clustering algorithm facilitated an objective evaluation of cluster quality, ensuring that the selected number of clusters accurately represents the underlying data patterns. This automated selection of the optimal k value enhanced the stability and reliability of the defect detection process. The proposed methodology substantially reduced the yield of defective spindles by identifying and addressing defects before spindle installation in CNC machines. The proactive defect detection and intervention system rectified potential failures at an early stage and improved the overall quality control processes. This proactive approach enhanced operational efficiency and reliability, reduced rework and warranty claims costs, and aligned with industrial needs while addressing a critical gap in academic research. This study significantly contributes to spindle manufacturing, ensuring high-quality production outcomes and bridging important gaps in both industrial application and academic research.
1. Introduction
In computer numerical control (CNC) machine manufacturing, spindle quality is crucial for ensuring the precision and efficiency of machining processes. The adoption of machine learning techniques to detect potential defects in spindle production before installation marks a significant technological advancement. This study investigates the use of advanced machine learning algorithms to improve defect detection in spindle manufacturing using a collected dataset from production lines. Traditional spindle QC methods, which typically involve manual inspections and basic mechanical testing, are increasingly inadequate due to complex manufacturing demands. These conventional methods lack the sensitivity to detect subtle defects that could cause significant operational failures, leading to increased operational costs from later-stage corrections and compromised product reliability [1]. Monitoring the condition of spindle assemblies is essential in the broader scientific field of rotary machine maintenance [2–5]. A popular method involves using accelerometers to measure vibrational characteristics, which are highly sensitive to minor defects and facilitate early detection of bearing failures [6]. This sensitivity highlights the importance of vibration signals in identifying incipient damage, with numerous studies focusing on early detection through various signal processing techniques, often employing frequency domain analysis to achieve significant results [7–9]. While extensive research in machine learning and deep learning has been directed at specific fault issues [10–15], the existing literature primarily focuses on condition monitoring [16, 17] and specific types of faults [18, 19] without adequately addressing the identification of underlying causes of spindle failures. This oversight represents an unresolved industrial challenge, particularly on the extended operational lifespan of spindle assemblies, which complicates investigative efforts [20, 21]. In CNC machine tool manufacturing, the integration of interdisciplinary technologies is essential for advancing production quality and sustainability. Recent research, such as the development of the ontoSUSD framework [22] and the LAGSSE framework [23], has demonstrated that merging diverse knowledge and methodologies can establish ontology-based frameworks that enable more efficient and sustainable evaluation and synchronization of various technologies. These studies underscore the importance of interdisciplinary approaches in the ongoing improvement of production processes. Moreover, the application of strategic optimization techniques in artificial intelligence, such as weighted strategy optimization (WSO) and kernel extreme learning machine (KELM) [24], has provided effective solutions to complex pattern recognition and optimization problems. Those sophisticated algorithmic approaches have the potential to address challenges across various fields. This study aims to apply the principles of these technological advancements to the quality monitoring of CNC spindle manufacturing and explore the feasibility and effectiveness of interdisciplinary technology transfer in this domain. The integration of machine learning methodologies into the physical manufacturing environment can construct a more robust and accurate spindle defect detection system.
This study employed an unsupervised learning approach to analyze unknown data to identify potential defects and track spindles through factory QC and customer feedback to address these challenges. Leveraging a dataset from 13 spindles with identical specifications and designs, this study utilized advanced analytical techniques to enhance the accuracy and efficiency of defect identification. Real-world vibration time-domain signals were used to ensure the relevance and applicability of the findings to practical manufacturing scenarios. T-distributed stochastic neighbor embedding (t-SNE), a technique for dimensionality reduction and data visualization, is particularly effective in revealing the underlying structure of high-dimensional data by projecting it into a low-dimensional space while preserving local relationships [25]. This capability makes t-SNE highly suitable for identifying patterns and anomalies that might be missed by other visualization techniques, thus enhancing defect detection. When combined with k-means++, which optimizes the initial cluster centers to improve the convergence and accuracy of the clustering process [26], the overall analytical method becomes significantly more powerful. The Davies–Bouldin Index (DBI) was also employed to evaluate the clustering quality [27], ensuring that the clusters formed are compact and well separated, which is crucial for reliable defect identification. Comparatively, traditional clustering methods like standard k-means often involve issues related to the initial selection of cluster centers, leading to suboptimal clustering results and reduced detection accuracy [28]. Moreover, other dimensionality reduction techniques, such as PCA, might not capture the complex, nonlinear relationships within the vibrational data as effectively as t-SNE [29]. The combination of t-SNE and k-means++ thus offers a superior approach by addressing these limitations, providing a more detailed and accurate analysis of spindle conditions. This method enhances the understanding of spindle conditions, enabling the early detection of defects that could remain unnoticed until after installation.
This study improved the traditional diagnostic process by employing sophisticated analytical tools such as fast Fourier transform (FFT) for extracting features from vibration data and t-SNE for effective data visualization. Combined with k-means++ clustering optimized by the DBI, these methods enhance the understanding of spindle conditions. The focus on preinstallation defect detection ensures that only high-quality defect-free spindles are integrated into CNC machines, thereby enhancing overall production line efficiency and product reliability. The novelty of this study lies in its application of vibrational signal data from spindle assembly lines to analyze potential defect characteristics before the spindles are installed in machine tools. This defect detection and intervention system ensures faults are corrected at the earliest possible stage, enhancing the overall QC process. It also improves the efficiency and reliability of the production process and reduces costs associated with rework and warranty claims. Despite rigorous quality controls at spindle manufacturing facilities, a large number of spindles require repairs shortly after deployment. This approach aligns with industrial needs and fills a critical gap in academic research, which frequently overlooks preinstallation diagnostics. Integrating these advanced diagnostics into spindle production processes increases the yield of fault-free spindles and reduces the costs associated with rework and warranty claims. Additionally, the proposed system can increase customer satisfaction by delivering more reliable products, contributing valuable knowledge to both the manufacturing industry and the academic community.
2. Introduction to the Theory
2.1. Feature Extraction and Real-Time Feasibility
Given its efficiency in processing large volumes of vibration data and its suitability for real-time applications, FFT is employed in this study for feature extraction. FFT is particularly advantageous in industrial settings because it offers rapid frequency domain analysis, which is essential for detecting defects in spindle operations with minimal latency. Compared to other methods such as wavelet transform, FFT provides a simpler and faster approach to facilitate quick decision-making. While methods like wavelet transform can offer detailed time–frequency information, they often involve more complex computations, which can hinder real-time performance. Therefore, FFT is selected in this study for its balance between computational efficiency and effectiveness in identifying critical defect signatures in vibration signals.
2.2. Signal Analysis Using FFT
2.3. Visualization of High-Dimensional Data Using t-SNE
This paper applies t-SNE to project high-dimensional data onto a two-dimensional plane for enhanced visualization. This method can simplify the visualization of complex datasets and preserve the structural integrity of the data, thus making it particularly advantageous for analyzing potential defects in built-in spindle QC within this research. By retaining the original configuration of the data, the method enables accurate interpretation of complex relationships and distributions, which is crucial for detecting subtle discrepancies that may indicate quality deficiencies.
2.4. Enhanced Cluster Analysis Using K-Means++ Algorithm
- 1.
Initial centroid: Select the first centroid randomly from the data points.
- 2.
Distance calculation: For each data point not yet chosen as a centroid, calculate the squared distance from the point to the nearest existing centroid.
- 3.
Probabilistic selection: Select the next centroid from the remaining data points with a probability proportional to its squared distance from the nearest existing centroid. This step biases the selection toward points far from the current centroids and potentially enhances cluster diversity.
- 4.
Repeat: Repeat Steps 2 and 3 until all K centroids are chosen.
Following initialization, K-means++ follows the standard K-means methodology of assigning each data point to the nearest centroid and updating centroid positions based on the means of the assigned points. This iterative process continues until convergence is achieved, indicated by the minimal changes in centroid positions or the completion of a predetermined number of iterations. The enhanced initialization process of K-means++ has demonstrated faster convergence and more stable clustering results than standard K-means, effectively avoiding poor initializations that could compromise cluster quality [39]. Through the improved methodology of K-means++, this analysis explains the dynamic clustering processes within the dataset, identifying intrinsic patterns and relationships essential for advanced data interpretation and decision-making in subsequent analyses. This approach underscores the importance of sophisticated initialization in clustering algorithms to ensure high-quality and reliable clustering results crucial for thoroughly analyzing complex datasets.
2.5. Clustering Evaluation With DBI
The index evaluates the ratio of the sum of within-cluster scatter to between-cluster separation. A lower DBI value enhances the clustering setup, indicating that clusters are compact (low σ) and well separated (high d). The clustering configurations yielding the lowest DBI scores in these experiments are deemed optimal. This evaluation identifies the most suitable settings for the clustering parameters, thereby enhancing the overall reliability of the clustering approach.
3. Framework for Experimental Data and Diagnostic Model
3.1. Data Collection Process
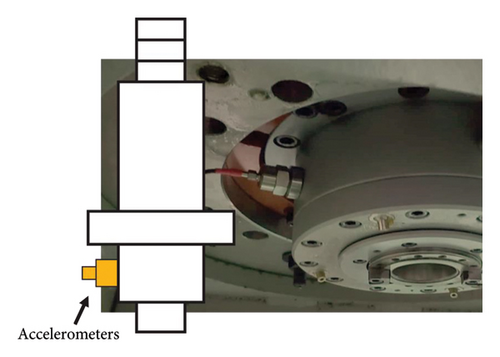
The research data were derived from actual vibration signals recorded in spindle manufacturing facilities. This study analyzed 13 spindles, each with identical design specifications and assembly components. Data were collected in the assembly room of the spindle production line for further analysis. Figure 1 shows that, following assembly, each spindle was subjected to an oil lubrication process to ensure thorough lubrication of the internal bearings. Using a magnetic base, an accelerometer was mounted on the spindle head at the running-in station and operated at a constant speed of 7500 RPM. The data acquisition system captured vibration signals at a sampling rate of 25.6 kHz, collecting data samples of 256 k in length for each spindle.
The experimental procedure is illustrated in Figure 2. At the running-in station, the internal bearings of each spindle were oil lubricated, and the recording of vibration signals was immediately conducted. The spindles were then transported to a CNC machine tool factory for further assembly, QC inspections, and testing. Meanwhile, some spindles underwent additional durability and cutting tests. Spindles that met internal factory standards following QC inspections and necessary additional testing were approved for release. Their maintenance records were monitored over the following year, as documented in Table 1. Based on the standardized testing procedure outlined in Figure 2, the test and maintenance results of the 13 spindles are compiled in Table 1. Observations during each QC process, including those conducted before the spindles were assembled onto the machine, revealed that at least one spindle did not meet the required standards. This is consistently confirmed in Section 5, where all defective spindles were accurately identified. Utilizing this reliable model, further diagnoses were conducted to pinpoint defects that may have been overlooked during these procedures.

| Testing Items | Spindle numbers | |
|---|---|---|
| Initial QC pass | 1, 2, 3, 4, 5, 6, 7, 8, 9, 10, 11, 12, 13 | |
| Durability test results (failed) | 1, 2, 3, 5, 13 | |
| Final QC pass (passed after component replacement) | Drawbar | 1, 2, 3, 5 |
| Bearing | 13 | |
| Maintenance record within 1 year | 4, 5, 7, 11 | |
3.2. Model Training and Diagnostic Process
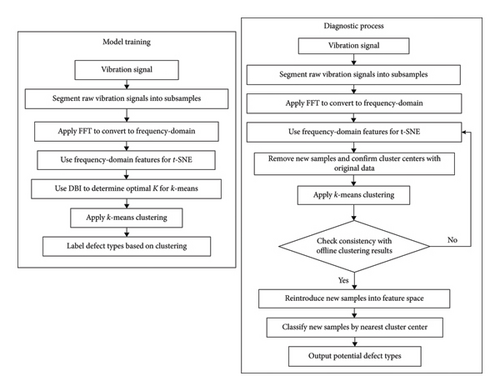
The specific methods for model training and diagnostic process in this study are shown in Figure 3, with a detailed explanation of key steps provided below.
- 1.
Raw vibration signals are segmented into multiple nonoverlapping subsamples, each with a length of 1024.
- 2.
FFT is applied to convert these subsamples from the time domain to the frequency domain.
- 3.
Frequency-domain features are used as inputs for dimensionality reduction via t-SNE to analyze signal correlations.
- 4.
The DBI determines the optimal number of clusters (K) for k-means++ clustering. The steps are as follows:
- 1
Set a range of possible K values (e.g., from 2 to 7).
- 2
For each K value, perform K-means clustering, and calculate the corresponding DBI index after obtaining the clustering results.
- 3
Compare the DBI indices for all K values and select the K value with the minimum DBI index as the optimal number of clusters.
- 1
- 5.
The identified K value is applied in k-means++ for automatic clustering.
- 6.
Clustering results are produced.
- 7.
Potential defect types are labeled based on the clustering results.
- 1.
New vibration signal samples are integrated based on the trained model, segmented, and transformed using FFT.
- 2.
The transformed samples are encoded into t-SNE for dimensionality reduction.
- 3.
After dimensionality reduction via t-SNE, the new samples are temporarily removed from the dataset. The existing k-means model is used to confirm the locations of the cluster centers by clustering the original data only. This step ensures that the cluster centers are consistent with those established during the offline training phase.
- 4.
The new samples are reintroduced into the dimensionality-reduced feature space. Each new sample is classified by determining its nearest cluster center. The sample is assigned to the defect type corresponding to that cluster center, ensuring a consistent and accurate classification without retraining the k-means++ model.
- 5.
Results indicating potential defect types are produced.
4. Experimental Comparison and Analysis
This section analyzes and compares the time-domain and frequency-domain characteristics of vibration signals using the methods proposed in this study. Each spindle dataset comprises segments of 256 k in length, which are subdivided into 250 nonoverlapping samples. These samples are then evenly divided into training and testing sets. Figure 4 shows the differences of time-domain and frequency-domain signals. Time-domain signals readily reveal severe faults, often detectable through auditory analysis due to distinct acoustic anomalies. However, the focus of this research on newly assembled spindles presents challenges to the efficacy of time-domain analysis in isolating subtle or composite anomalies. In contrast, frequency-domain analysis performs better in detecting anomalous signatures, particularly those linked to specific frequencies. It exposes frequency components associated with faults, which may remain obscured in time-domain representations.
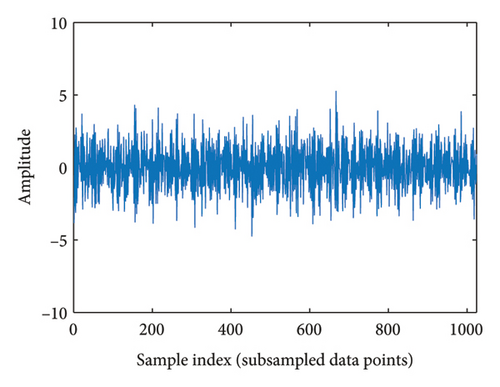
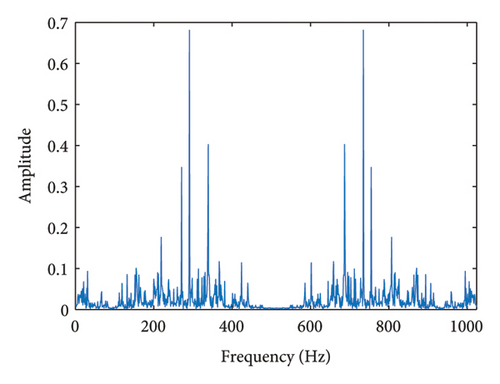
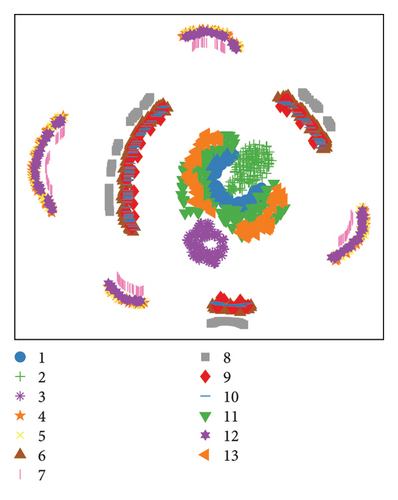
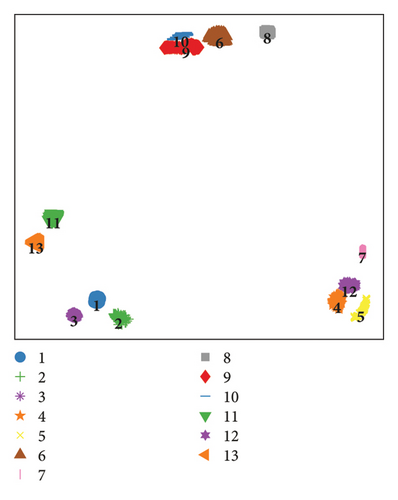
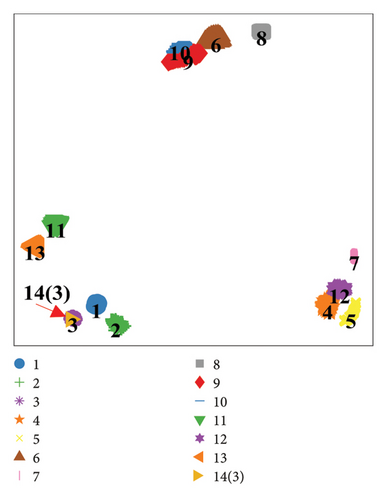
Figure 5 presents the enhanced visualization of both time-domain and frequency-domain features by applying the proposed t-SNE method for dimensionality reduction. The labels in the figure correspond to spindle numbers. Although time-domain features remain complex and difficult to distinguish even after reduction, frequency-domain features form well-defined, discrete clusters. This effective clustering is due to t-SNE’s ability to preserve the local structure of features, manage complex nonlinear relationships, and ensure proximity among similar features after reduction.
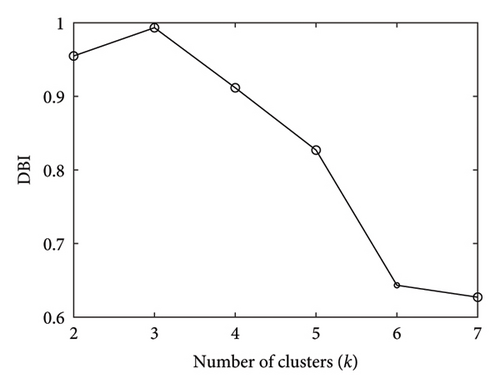
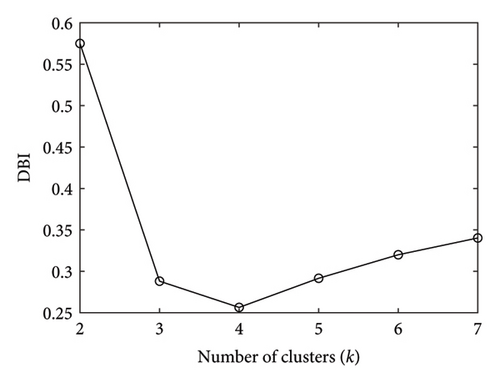
Following the classification of data into distinct clusters using t-SNE, this study introduces the DBI to automatically select an optimized k-value for unsupervised clustering with K-means++. This index evaluates clustering quality based on intracluster coherence and intercluster separation, with DBI lower values (approaching zero) indicating better clustering performance. Figure 6 shows a clear contrast in clustering results: Time-domain features yield suboptimal results, while frequency-domain features significantly outperform, with an optimal k-value of 4 achieving a DBI of 0.25. Results for other k-values are detailed in Table 2. Therefore, this study selects the result with a k-value of 4 to establish the K-means++ classification model.
| k-values | 2 | 3 | 4 | 5 | 6 | 7 |
|---|---|---|---|---|---|---|
| DBI (time-domain) | 0.95 | 0.99 | 0.92 | 0.76 | 0.64 | 0.63 |
| DBI (frequency-domain) | 0.57 | 0.28 | 0.25 | 0.29 | 0.32 | 0.34 |
- Note: The bold values indicate the optimal number of clusters (k), which was determined by the DBI. The bold value represents the case where the DBI value is closest to zero, signifying the most appropriate clustering solution.
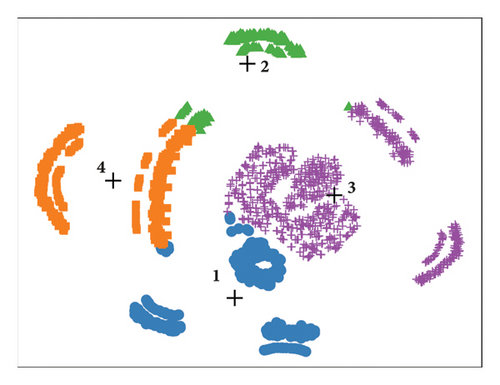
As shown in Figure 7, using a k-value of 4 in K-means++ clustering reveals the limitations of time-domain feature clustering, with nearly 50% of features from the same spindle misclassified into different clusters. Contrastingly, clustering based on frequency-domain features with the same k-value effectively divides each spindle’s signals into coherent clusters. The clusters in Table 3 demonstrate a robust correlation with experimental records presented in Table 1.

| Cluster no. | 1 | 2 | 3 | 4 |
|---|---|---|---|---|
| Spindle number | 1, 2, 3 | 6, 8, 9, 10 | 4, 5, 7, 12 | 11, 13 |
Due to the inherent stochasticity of the t-SNE algorithm, which may yield different results with each execution, multiple iterations are essential to ensure the stability of the results. Hence, this study conducted five random trials of the t-SNE algorithm to assess the consistency of the results. The experimental procedure comprised the following steps: (1) converting all data from time-domain signals to frequency-domain features, (2) randomly shuffling and recombining these frequency-domain features, (3) employing t-SNE for dimensionality reduction, and (4) utilizing the reduced features for k-means++ clustering. Each trial involved a random reorganization of all feature sets, including both training and test datasets, prior to dimensionality reduction with t-SNE, thereby introducing variability into the data used in each experiment. This approach facilitated an analysis of the randomization effects on the proposed model, providing insights into its reliability and consistency under varying initial conditions. Notably, while both training and test set data were shuffled, only the training set data were subjected to t-SNE and k-means++ clustering at this stage. The test set will be introduced in Section 5.2 to evaluate the model’s accuracy. Only the training set underwent dimensionality reduction and clustering in this section, thus ensuring the integrity of the test data for subsequent validation.
Figures 8, 9, 10, 11, and 12 illustrate the results. The left side of each figure shows the results of the dimensionality reduction, annotated with spindle numbers. Meanwhile, the right side shows the k-means++ clustering results, with spindle positions corresponding to those in the dimensionality reduction images. Colors and symbols are used to differentiate clusters, with the plus symbol (+) denoting cluster centroids. The numerical identifiers on the right side serve as cluster labels, devoid of any intrinsic meaning; their variability is contingent on the initial sequencing of the k-means++ algorithm.

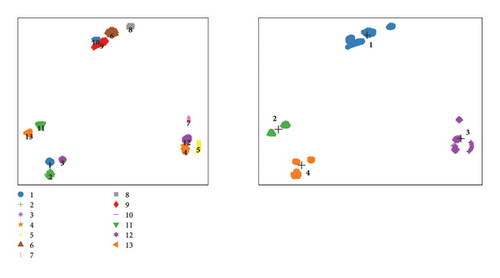
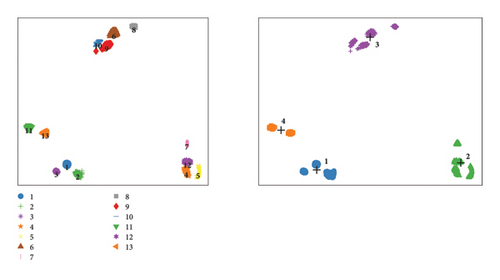
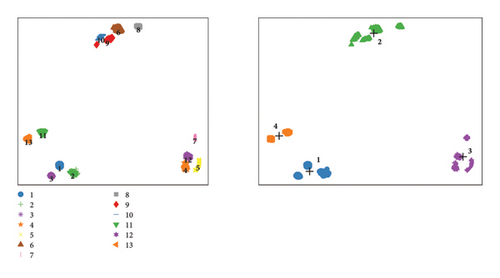
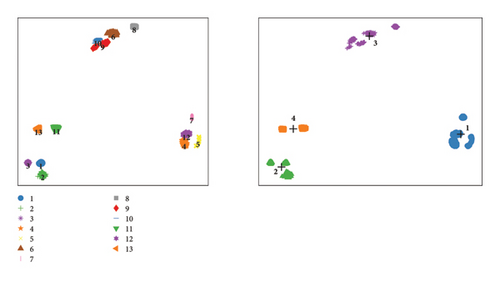
It is important to note that, in this section, the cluster labels lack intrinsic significance. They merely signify that the corresponding spindles have been grouped into the same category. The primary focus here lies in discerning whether the inherent randomness causes the spindles to be incorrectly assigned to different clusters. For example, Spindles 11 and 13, ideally belonging to the same cluster, are occasionally assigned to different clusters due to random variations. The detailed classification of potential spindle defects into specific categories will be explained in Section 5.1.
After conducting five trials, minimal variation is observed in the distribution of clusters, with no significant changes in the relative distances within clusters or in the positions of the spindles. The clustering results from the k-means++ algorithm remain consistent across all tests. These findings underscore the repeatability and efficacy of the proposed model, affirming its capability to manage the inherent variability of the data processing sequence effectively. The consistent performance across multiple trials validates the model’s reliability for analytical purposes, reinforcing its suitability in scenarios where precise data interpretation is crucial.
5. Diagnostic Results and Validation
5.1. Frequency and Energy Signature Analysis for Built-In Spindle Defect Identification
Figure 13 illustrates the primary frequencies within each spindle, with the x-axis representing spindle numbers and the y-axis indicating Hertz (Hz) frequency. Frequency domain analysis reveals a consistent main frequency of 7250 Hz across the signals attributed to the servo frequency. This frequency originates from the spindle power system, persisting even with 0 RPM spindle operation. The magnitude of this frequency, influenced by the set speed, exhibits a consistent pattern of variability. Upon examining the 13 spindles, this study found that the main frequencies for Spindles 2 and 3 deviated from the typical 7250 Hz, signaling a departure from the expected norm. This discrepancy suggests potential issues with these spindles. Factory records support this observation, revealing that these two spindles indicate abnormalities following endurance and cutting tests. Subsequent replacement of the drawbar and satisfactory postrepair inspections allowed these spindles to leave the factory without encountering further maintenance issues within a year. This study correlates the atypical main frequency findings to potential defects in the drawbar. Deviations from the expected servo frequency often signal underlying mechanical issues, typically associated with drawbar components. This analysis validates the initial signal discrepancies and emphasizes the critical role of frequency analysis in preemptive maintenance and QC in spindle manufacturing.
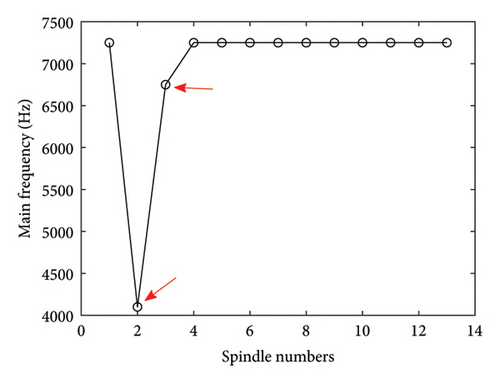
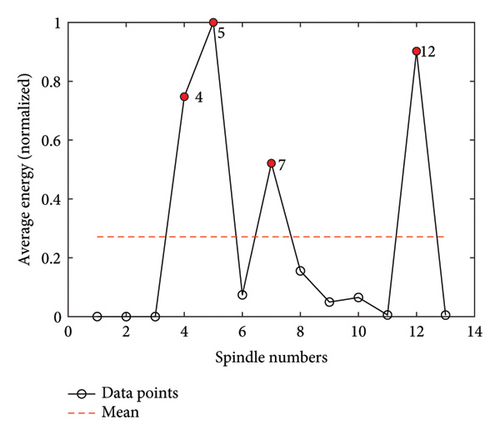
Figure 14 illustrates energy distribution analysis at 7250 Hz across various spindles, offering significant insights. The x-axis of the figure represents spindle numbers, while the y-axis indicates the average energy per second for each sample. A red dashed line across the graph signifies the mean value of the cumulative average energy at 7250 Hz for the 13 spindles, indicating that the energy values have been normalized. Notably, Spindles 1, 2, 3, 11, and 13 exhibit markedly low energy levels, nearly devoid of the servo frequency. This unusual phenomenon suggests potential defects in these spindles. Conversely, the amplitude at 7250 Hz is abnormally high for Spindles 4, 5, 7, and 12, significantly exceeding the mean. This deviation is hypothesized to originate from imbalances during spindle assembly. A review of QC inspection records reveals that Spindles 4, 5, and 12 exhibit unusually high displacement speeds under high-speed operations compared to others. Although Spindle 7 shows no clear signs initially, it requires maintenance shortly after deployment, indicating preexisting defects not detected during the initial quality checks. In contrast, the energy levels for Spindles 6, 8, 9, and 10 at 7250 Hz neither significantly exceed the mean nor approach zero. These spindles demonstrate energy distributions consistent with expected operational patterns, indicating normal functioning without evident defects. The analysis conducted in this study establishes a correlation between the observed spindle conditions and the abnormalities recorded in the QC data. This correlation underscores the importance of integrating spindle energy distribution analysis into routine quality assessments to preemptively identify potential mechanical failures.
Based on the analysis results from t-SNE and k-means++ clustering shown in Figures 8, 9, 10, 11, and 12, it is observed that Spindles 11 and 13 are closely grouped and classified into the same cluster. Notably, Spindle 13 experienced a bearing failure during endurance and cutting tests, indicating preexisting anomalies prior to dispatch from the factory. Although Spindle 11 passed the in-house QC inspections, the analysis suggests potential latent defects, particularly evidenced by a notably weaker energy presence at the 7250-Hz servo frequency. This weakness may have resulted from the substandard assembly processes. Maintenance records within a year of operation reveal that Spindle 11 required repairs shortly after deployment, suggesting significant preexisting defects.
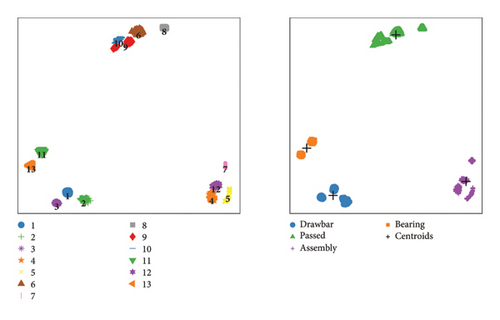
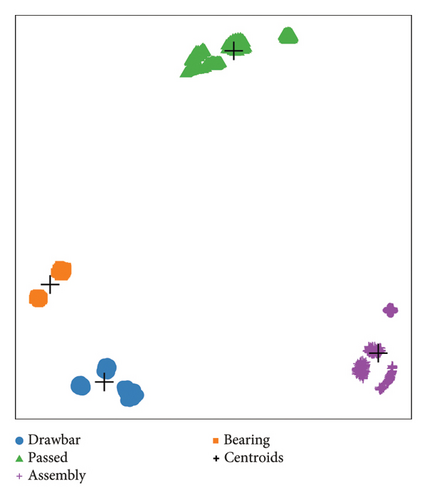
The correlation between the analytical results and factory records underscores the predictive value of such analyses for identifying potential spindle defects. Based on the above analysis and the maintenance tracking table (Table 1), spindles can be categorized into distinct clusters according to potential defects. In Figure 15, the spindles are categorized as follows: Spindles 1, 2, and 3 were grouped under a “Drawbar Defect” cluster; Spindles 4, 5, 7, and 12 fell within an “Assembly Defect” cluster; Spindles 6, 8, 9, and 10 were classified as “Passed,” indicating compliance with standards. Spindles 11 and 13 were identified under a “Bearing Anomaly” cluster. This classification facilitated targeted maintenance strategies and enhanced the predictive maintenance framework within spindle manufacturing. By correlating spindle anomalies with specific defects, manufacturers can refine their assembly and quality assurance processes to minimize the occurrence of defects and ensure higher machinery reliability and performance.
5.2. Validation of the Test Set
- 1.
Test samples were incorporated into the training set and subjected to dimensionality reduction using t-SNE, as shown in Figure 16. Notably, Sample 14 represents test data for Spindle 3.
- 2.
Subsequently, Sample 14 was removed, and unsupervised clustering was performed using the k-means++ algorithm to verify whether the spindle numbers within the same clusters align with the results from the training model. If discrepancies arise, the dimensionality reduction process is reapplied. If the results are consistent, defect categories are systematically assigned to the spindle numbers within each cluster, as shown in Figure 17.
- 3.
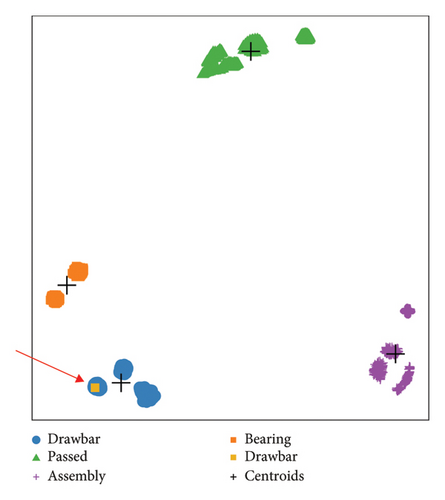
Sample 14 was then reintroduced into the dimensionally reduced space, and each sample was classified by determining its proximity to the nearest cluster center. The defect type corresponding to that cluster center was assigned, ensuring consistent and accurate classification without retraining the k-means++ model. Results indicating potential defect types are shown in Figure 18.
The signal from each spindle was divided into 250 nonoverlapping samples of equal length. These samples were then randomly and evenly divided into training and validation datasets for the verification experiments conducted in this section. The random splitting process ensured no precise correlation between the training and testing datasets, allowing all samples to be used interchangeably. Consequently, the model was not restricted to using specific signal segments exclusively for training. To ensure reliability, the experiment was repeated three times using different random seeds, producing slightly varied data splits while consistently yielding identical results. This approach achieved a 100% correct identification rate, as shown in Table 4, which includes a total of 4875 validation samples (1625 per experiment, with 125 per spindle across 13 spindles) over three trials with no misclassifications. These findings validate the reliability of the diagnostic process and confirm the effectiveness of the proposed methodology.
| Trial number | Misclassified samples | Accuracy (%) |
|---|---|---|
| 1 | 0 | 100 |
| 2 | 0 | 100 |
| 3 | 0 | 100 |
Applying random sampling to divide the dataset into training and validation sets significantly enhanced the model’s generalizability. This approach not only substantiates the strength of the model but also enhances the reliability of predictive diagnostics within spindle manufacturing. The integration of t-SNE and k-means++ clustering techniques formed a reliable framework for defect detection, suggesting potential applicability to other manufacturing components to enhance quality assurance measures. The consistency of results across multiple trials underscores the reproducibility and precision of the model, setting a benchmark for future investigations in similar industrial contexts.
6. Integration Framework
The integration framework between the defect detection system, as proposed in this study, and the QC process on the actual production line is illustrated in Figure 19. The black text in the figure represents the original QC process prior to the proposed improvements. The traditional process relies heavily on manual inspection during Phase 2, which is both time-consuming and labor-intensive. Moreover, manual inspections tend to have a higher error rate compared to machine-based inspections, and the cost and difficulty of training QC personnel are significant.
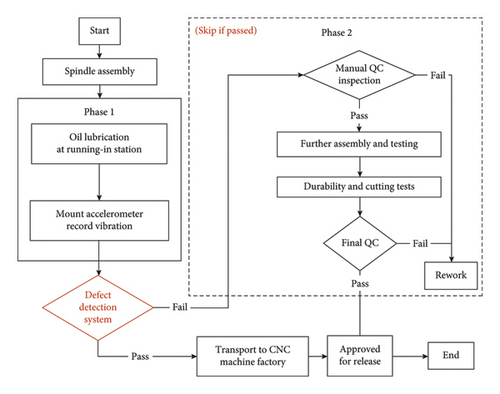
In contrast, the defect detection system developed using the proposed methodology (as indicated by the red text in the figure) automates the inspection process following Phase 1. After the spindle undergoes oil lubrication process, this system provides intuitive warnings (as illustrated by the user interface shown in Figure 20). If the spindle passes the detection process, the system allows it to skip further manual inspection (Phase 2), thereby enabling immediate transport for CNC machine assembly and testing. Conversely, if a defect is detected, the system promptly alerts relevant personnel for further investigation, which involves manual inspection (Phase 2) to diagnose the exact issue.
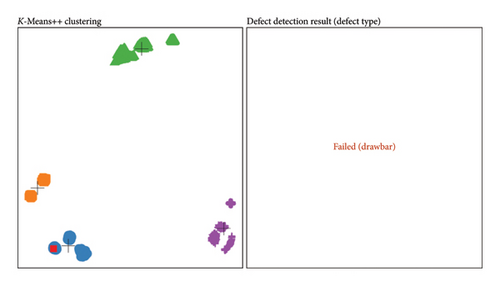
The proposed automated detection system can significantly reduce resource waste and the substantial amount of time previously required for spindle production inspection. This improvement streamlines the QC process, enhances accuracy, and optimizes overall production efficiency.
7. Discussion and Conclusions
This study demonstrated the effectiveness of advanced machine learning techniques in improving defect detection in spindle manufacturing. Utilizing a dataset of 250 samples from each of 13 spindles, totaling 3250 samples, this study obtained consistent results across multiple trials and validated the repeatability and reliability of the proposed model. Using real-world data sourced from a precision assembly line, rather than laboratory-simulated data, this study significantly enhanced the practical relevance and reliability of the findings.
The methodology, which integrated t-SNE and k-means++ clustering techniques, optimized quality assurance and confirmed the model’s generalizability and precision. Specifically, the feature of dimensionality reduction in t-SNE provides clear visualizations that aid in understanding the intrinsic structure of the data. On the other hand, k-means++ enhances clustering performance by effectively initializing centroids to avoid poor cluster configurations. This combination results in more accurate and stable clustering outcomes than other algorithms, such as the traditional k-means or PCA-based methods. Implementing a random split methodology ensures that each sample could be included in either the training or validation set, leading to a 100% identification accuracy rate with no misclassifications. Such high accuracy rate ensures the spindle quality and increases consumer satisfaction. Moreover, applying these sophisticated diagnostic systems at the initial stages of production strategically reduces financial losses associated with after-sales repairs and replacements, thereby maintaining the operational integrity of manufacturing facilities and promoting economic efficiency. By effectively minimizing postpurchase failures, the proposed approach enhanced spindle quality and reduced the failure rate, which are crucial for competitive differentiation in the market. From an academic standpoint, this research advances the existing body of knowledge by detailing the application of real-world data in the machine learning field, addressing a significant gap in current studies, particularly in preinstallation diagnostics. This comprehensive case study contributes significantly to academic discourse and sets a benchmark for future scholarly investigations in similar industrial contexts.
Looking ahead, the proposed methodology is envisioned to evolve into an online diagnostic tool. In its development, several critical factors must be thoroughly considered, including data collection convenience, environmental impact variability, and the timeliness of machinery production schedules. Currently, vibration signal analysis has been selected as the primary method, as it best meets these requirements and provides the most effective diagnostic features. However, further research is necessary to refine the machine learning algorithms for even more precise defect detection and to incorporate larger and more diverse datasets to enhance the generalizability of the findings. The ongoing collaboration with machine tool manufacturers presents challenges in collecting spindle signals and patterns due to the need to align with buyer shipping schedules. Although signals from 13 spindles have been collected and preliminary analyses and model development have yielded promising results, data collection is ongoing. This process requires time and cannot be expedited. It is anticipated that, in the future, a larger dataset of spindle information will be available for further validation and analysis. Future enhancements may include integrating additional signal diagnostic modules to further improve system reliability. The exploration of multisensor data fusion, such as incorporating acoustic and thermal measurements alongside vibration data, could significantly enhance diagnostic capabilities and robustness. Additionally, simplification of the algorithm or the exploration of alternative clustering methods that maintain accuracy while reducing computational demands will be considered. Testing these enhanced methods across various manufacturing settings will be essential to validate their effectiveness and reliability. Continued collaboration with industry partners will remain crucial in customizing these advanced technologies to meet specific operational needs, ensuring their sustained implementation and integration into manufacturing processes.
Conflicts of Interest
The authors declare no conflicts of interest.
Funding
This research received no specific grant from any funding agency in the public, commercial, or not-for-profit sectors.
Open Research
Data Availability Statement
The original dataset involved in this study cannot be shared because the information is confidential.


