Mechanism and Characteristics of Jishixiongguan Failure Induced by Jishishan MS6.2 Earthquake, China
Abstract
On December 18, 2023, the Jishishan MS6.2 earthquake caused serious damage to Jishixiongguan, China, which is a rammed-earth city wall, and was about 14 km away from the epicenter. There was a large area of collapse and part of the vertical ramming overlap separation phenomenon. Based on the results of earthquake field investigation, the dynamic response of Jishixiongguan under the earthquake was studied by analyzing the maximum displacement, peak acceleration (PA) and stress-strain distribution characteristics of wall measuring points at different locations, and the mechanism of Jishixiongguan failure induced by Jishishan MS6.2 earthquake was given. The results show that the plastic zone initially develops from the bottom erosion of the wall and the transverse through crack at the top of the right-end, and it rapidly extends downward along the slope into the interior of the wall, resulting in destructive permanent displacement shortly after the peak ground acceleration (PGA) is reached, the maximum plastic strain and maximum displacement occur at transverse through cracks of the right-wall top. Owing to the wall being constructed against a mountain slope, the amplification effect (AE) of the slope on the displacement of the wall is obvious, and the closer the wall is to the higher parts of the slope, the more significant the AE of the displacement is due to the combined effect of the mountain slope and the wall height. Pre-existing defects in the wall will weaken the AE of the slope and the wall height on the acceleration, however, the transverse through cracks will enhance the AE of the wall height on the acceleration. Stress concentration caused by hollowed-out overhangs and stress discontinuity caused by the transverse through crack is the internal factor of the wall failure, the plastic yield of soil caused by the AE of slope and wall height on displacement is the external factor of large-scale collapse of wall. The research results can provide theoretical guidance for the restoration and reinforcement of ancient sites.
1. Introduction
At 23:59 on December 18, 2023, a MS6.2 earthquake occurred in Jishishan County, Linxia Prefecture, Gansu Province, China. The epicenter of Jishishan MS6.2 earthquake was located at 35.7°N, 102.79°E, with a focal depth of 10 km. The strong earthquake was a north-northwestward thrust faulting event that occurred within the Xining-Lanzhou fault block. The Laji Mountain thrust fault zone, which is closest to the epicenter, constitutes the seismogenic structure of this earthquake [1, 2]. The earthquake wave affected many Provinces and regions, such as Lanzhou, Xi’an, Yinchuan, and so on in China. This strong earthquake further indicates that the eastward extrusion tectonic system on the eastern margin of the Qinghai-Tibet Plateau is still the main seismogenic structure of intracontinental strong earthquake activity in China in recent years. Many studies have shown that the northeastern margin of the Qinghai-Tibet Plateau has been in a new period of seismic activity, and the possibility of strong earthquakes above seven in the future is greater [3, 4].
Soil is used as a building material on earthen sites that have long been exposed to natural environment and human activities in the open air. Therefore, a lot of earthen sites are preserved along the Silk Road with a relatively dry climate [5]. According to literature statistics [6], in addition to the Great Wall and its related affiliated cultural relics, there are 403 national and provincial protected earthen sites in Gansu Province, China, where the epicenter is located, most of them have different degrees of cracks, erosion, gully and collapse. Once subjected to an earthquake, these earthen sites are at risk of serious destruction or even disappearance [7, 8]. The literature records show that many strong earthquakes in history have caused damage to earthen sites. For example, in recent years, the Ming Great Wall site in Shandan County has been attacked by the Minle-Shandan earthquake in 2003 and the Menyuan earthquake in 2022, which led to the collapse of part of the Great Wall [9, 10]. As an important component of cultural heritage, the study of the dynamic response of earthen sites under seismic action is of great significance for the protection of cultural heritage. Understanding the behavior of such sites under seismic loading is essential for developing effective preservation and mitigation strategies.
Model experiments and numerical simulations are two effective methods for studying the seismic dynamic response of earthen sites. By simulating seismic loads, these methods can reveal the failure process and dynamic characteristics of earthen sites. In recent years, scholars both domestically and internationally have conducted extensive research on the seismic dynamic response of earthen sites, achieving fruitful results.
The use of shaking table tests to study earthen structures has been extensively documented in the literature. For instance, Rafi et al. [11] studied the dynamic behaviors of strengthened adobe structures that were strengthened using two different schemes, highlighting the influence of material properties and construction techniques on structural performance. Similarly, Johnson and Lee [12] investigated the dynamic behavior of rammed earth walls under varying seismic intensities, providing valuable insights into the failure mechanisms of these structures. These studies underscore the importance of material characterization and the role of construction methods in determining seismic vulnerability. Brown et al. [13] utilized advanced shaking table setups to examine the seismic response of earthen sites with different foundation types, revealing significant variations in performance based on soil-structure interaction. Garcia et al. [14] explored the effects of seismic retrofitting on the dynamic response of earthen heritage sites, demonstrating the potential of reinforcement techniques to enhance seismic resilience. Taylor et al. [15] combined experimental data with finite element analysis to predict the seismic response of earthen structures, validating the accuracy of their models through shaking table tests. This integrated approach has proven effective in identifying critical failure modes and optimizing retrofitting strategies. Chen et al. [16] employed shaking table tests to validate numerical simulations of the seismic behavior of earthen sites, highlighting the importance of experimental validation in ensuring the reliability of predictive models. The influence of site-specific factors, such as local soil conditions and seismic history, on the dynamic response of earthen heritage sites has also been a focus of recent studies. Martinez et al. [17] conducted shaking table tests on earthen structures from different regions, revealing significant variations in seismic performance based on local geological conditions. Similarly, Wang and Zhang [18] investigated the impact of seismic wave characteristics on the dynamic response of earthen sites, emphasizing the need for site-specific seismic assessments.
Numerical simulations have also played a significant role in studying the dynamic response of earthen sites under seismic action, with various finite element software being used by scholars to investigate the dynamic characteristics of earthen sites. Shi et al. [19, 20] tested the vehicle vibration effect of different factors on the Shandan Ming Great Wall near the driveway, and proposed the safety threshold of vibration safety of different types of earthen sites, which provided important evidence for the vibration safety protection of the earthen sites of the Great Wall. Liang [21] took the south gate of Xi’an ancient city wall as the research object, studied the dynamic characteristics and seismic response of the ancient city wall by using ANASYS finite element software for numerical simulation. Liu et al. [22] used the finite difference software FLAC3D to simulate the three-dimensional seismic dynamic response of the Shiguanmen of the Diaoyucheng Ancient Battlefield Site in Hechuan, Chongqing, which had local cracking, dislocation and other deformation and failure phenomena in the ‘5.12’ Wenchuan earthquake, and analyzed its deformation and failure mechanism. Guo et al. [23] took Liufuzhai watchtower in Shandan County, Gansu Province as an example, and used FLAC3D software to analyze the displacement, stress and acceleration changes of the single earthen sites under vertical and horizontal two-way measured seismic loads. Kong et al. [24] selected three typical Great Wall earthen sites in the west area of the Yellow River as the research object, and studied the dynamic response characteristics and seismic stability of different types of Great Wall under earthquake. Peng et al. [25] proposed a comprehensive evaluation framework of earthen sites containing multiple indicators, which can accurately and quickly reflect the actual vulnerability of earthen sites and provide theoretical support for the formulation of effective protection strategies for earthen sites.
In summary, model experiments and numerical simulations hold significant application value in the study of seismic dynamic responses of earthen sites. They provide a scientific basis for in-depth research into the seismic response mechanisms of earthen sites, the influence of material properties on their seismic responses, and the effectiveness of seismic reinforcement measures. This, in turn, offers theoretical foundations and practical guidance for the protection and restoration of earthen sites. However, there are few reports on the failure mechanism and response characteristics of earthen sites in specific earthquake areas when they are subjected to earthquakes. The author rushed to the earthquake area for seismic intensity assessment and verification at the first time after the Jishishan MS6.2 earthquake, and carried out seismic scientific investigation in the follow-up. On the way of scientific investigation, the severely damaged earthen sites in the Jishishan MS6.2 earthquake was found, which was named Jishixiongguan (Figure 1), it is a rammed-earth city wall. According to the distribution of casualties and the investigation of building damage in the seismic intensity assessment and verification work of the Jishishan MS6.2 earthquake, the Kangdiao village where Jishixiongguan is located is the village with the most serious casualties and earthquake damage. Based on the field investigation of the earthquake, this paper takes the filtered strong earthquake record of Guanting station in Qinghai Province as the input ground motion, and uses the numerical method to study the dynamic response of Jishixiongguan under the action of horizontal earthquake, in order to provide reference for the repair and reinforcement of Jishixiongguan.
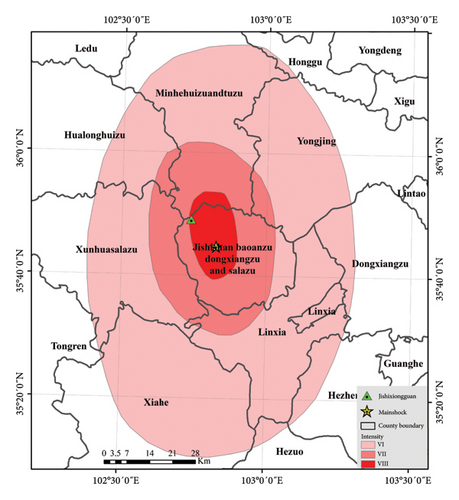
2. General Situation of Jishixiongguan
As mentioned in the introduction, the epicenter of the earthquake is located in Jishishan County, which has a wide distribute of cultural relics sites with rich in connotation. The territory of Jishishan County is widely distributed with cultural heritage sites, boasting 171 immovable cultural relics, Jishixiongguan was among them. It was located in Kangdiao Village, Dahejia Town, Jishishan County, 30 km away from the county seat [26]. Jishixiongguan, with the steep cliffs of Jishi Mountain to its south and the Yellow River to its north, has long been a strategic pass on the Silk Road and the Tang-Tibet Ancient Road, a military stronghold, and the gateway between Gansu and Qinghai. Inside the pass lies Jishishan County, while outside the pass is Xunhua County of Qinghai Province, facing Minhe County of Qinghai across the Yellow River. According to the “Hezhou Chronicles,” in the third year of Hongwu era of the Ming Dynasty(1370AD), after the Grand Censor Deng Yu commanded the army to conquer Taoshan, Minshan, and Hezhou, ‘24 Passes’ were established in Hezhou, seven of which were located within the territory of Jishishan County, with Jishixiongguan being the foremost. Over nearly six hundred years, these passes have not only served as military installations but have also gradually become bridges for political, economic, and cultural exchanges between the inland and the frontier, making it an important cultural heritage of Jishishan County [27]. According to the literature [10, 28], the rammed city walls of the Ming Dynasty mostly used loess mixed with an appropriate amount of coarse aggregate as the primary material. These walls were built using the board-forming technique, where the earth was compacted layer by layer from the bottom up and constructed in sections. Each section measured approximately 2.8 to 3.0 m in length. This method exhibited consistency in terms of construction regions, historical period, techniques, and material selection characteristics.
Jishixiongguan is an earthen site with a length of 15 m, which is about 14 km away from the epicenter of the MS6.2 Jishishan earthquake. The earthen site was constructed against a mountain slope, oriented at 38° northeast. The surface of the mountain is only covered by thin soil, beneath which lies bedrock. The wall is higher in the southern with a height of 6 m and lower in the northern with a height of 1.4 m. The cross-section of the wall is trapezoidal, narrower at the top and wider at the bottom (0.6∼2 m). There is a 1.50 m horizontal section at the base, and the remaining section with a length of 13.5 m rests on the slope of the mountain (with a gradient of approximately 19°). During construction, due to the limitation of the rammed formwork, the longitudinal overlap is carried out every 3 m, divided the wall into 5 sections from south to north. Figure 2(a) shows the full view of one side of Jishixiongguan after the earthquake, with the yellow dashed line outlining the wall’s contour. From Figure 2(a), it is clearly visible that after the earthquake, the Jishixiongguan exhibited significant cracks at the overlapping joints of the rammed sections in the first and second segments (indicated by green dashed lines in the figure), and the pre-existing transverse through-cracks in the wall widened (indicated by red dashed lines in the figure).
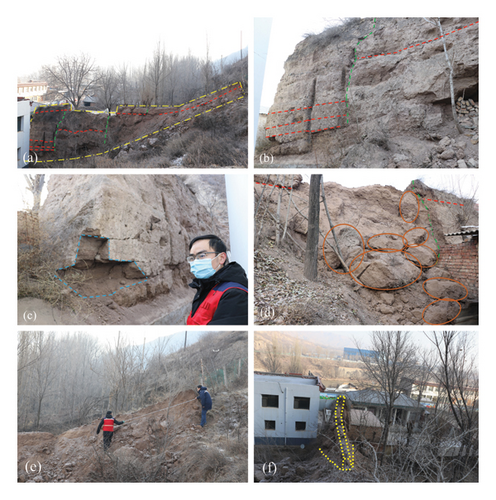
Figure 2(b) depicts the surface of the wall of Jishixiongguan. It can be seen that there has been many spalling, insect-hole pores and obvious gullies on the surface of the wall. There is full of weeds in the top 0.5 m of the wall, and the horizontal section of the bottom of the wall have a seriously eroded with the height of about 0.5 m and the maximum depth of about 0.20 m, according to the field measurement.
The Jishishan MS6.2 earthquake caused numerous collapses in Jishixiongguan. Figure 2(c) shows the damage at the bottom of the horizontal section of the wall, where blocks have fallen from the undercut overhang, measuring approximately 0.8 × 0.4 × 0.6 m; Figure 2(d) shows the damage to the east of the second section of the wall, with the orange-red circle highlighting soil blocks that have fallen and rolled down the mountain slope. The maximum fallen block is about 1.8 × 0.70 × 0.66 m, while the others range in length from 1 to 1.30 m. Figure 2(e) displays the damage of the northernmost wall relying on the slope of the mountain. Numerous fallen blocks have gradually fragmented during their descent, mostly into smaller pieces. The figure also clearly shows the local protective measures implemented for the Jishixiongguan, including cement posts and green wire mesh fencing.
Figure 2(f) provides a top-down view of the entire wall from north to south, showing that part of the old surface soil remains on the horizontal section of the wall. However, the section of the wall leaning against the mountain has suffered severe collapse and block falls from the pre-existing through-cracks at the top, with the extent of damage increasing with the height of the slope.
Based on the overall collapse of the wall, it can be inferred that the dynamic response of the Jishixiongguan during the earthquake was holistic and destructive. The damage of the wall gradually increases from south to north. In addition to its own defects, the amplification effect (AE) of the slope and the free surface should be the factors that aggravate the collapse of the wall due to the wall are built on the mountain. The specific influence degree needs to be analyzed in detail by the subsequent simulation results.
3. Build Numerical Model
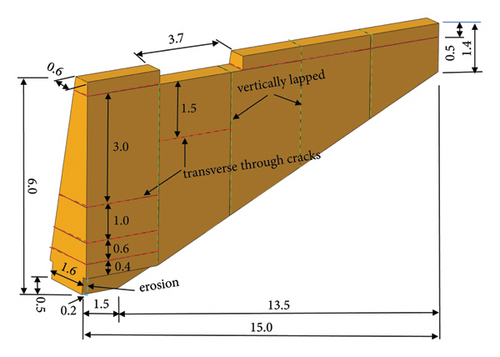
Considering the shape of the cross-section of the wall and the longitudinal overlap and the original transverse through cracks, the three-dimensional finite element model is established by simplifying the modeling of the wall and ignoring the influence of the peeling gully on the wall surface to analyze the dynamic response of Jishixiongguan under earthquake. As shown in Figure 3, the wall has a total length of 15 m and lapped every 3 m in the longitudinal direction. It is divided into 5 sections from left to right. The horizontal section has a length of 1.50 m, and there is erosion at the bottom witch is quadrilateral in shape with a height of 0.5 m and a maximum depth of 0.2 m. The erosion length extends horizontally to the junction with the mountain slope, while the remaining 13.50 m of the wall is built against the slope. The south-end of the wall (hereinafter referred to as the left-end) stands 6.00 m, and the height of the north-end (hereinafter referred to as the right-end) is 1.40 m, the width of the bottom is 2 m, and the width of the top is 0. 6 m. From left to right, there is a defect at the top of the wall at 3∼6.7 m. Field investigations reveal transverse through-cracks at 0.50 m from the top of the wall and at various heights in the first and second sections, as indicated by the green dashed lines for vertical overlaps and red dashed lines for transverse through-cracks in Figure 3. In order to eliminate the influence of foundation dimensions on the dynamic response results during modeling, the foundation extends outward from the wall by three times the width of the wall base, resulting in a length of 27 m and a width of 12 m. Considering the thin soil cover over the mountain surface and the bedrock beneath, the thickness is set at 6 m.
3.1. Soil Constitutive Model and Dynamic Characteristics
| Material | Density (kg/m3) | Elastic modulus (MPa) | Poisson ratio | Cohesion (kPa) | Friction angle (°) | Tensile strength (kPa) |
|---|---|---|---|---|---|---|
| Wall | 1640 | 113.64 | 0.30 | 77.9 | 36.58 | 100 |
| Foundation | 1410 | 8.923 | 0.30 | 30 | 27.7 | — |
The first four natural vibration characteristics and mode shapes of the model obtained through modal analysis are shown in Table 2 and Figure 4, respectively:
| Project | 1 | 2 | 3 | 4 |
|---|---|---|---|---|
| Circular frequency (rad/s) | 5.9220 | 5.9330 | 6.9128 | 8.2655 |
| Period (s) | 1.0610 | 1.0590 | 0.9089 | 0.7602 |
| Characteristic value | 35.070 | 35.200 | 47.783 | 68.319 |
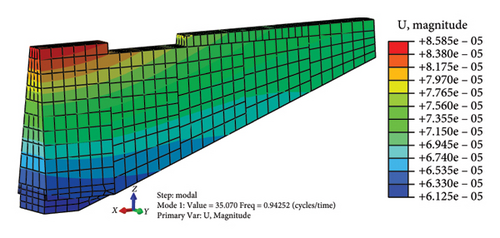
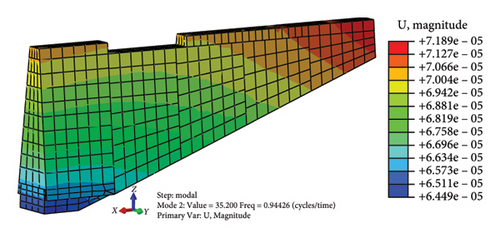
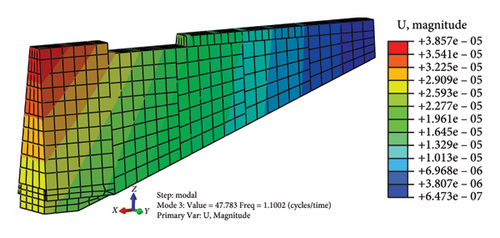
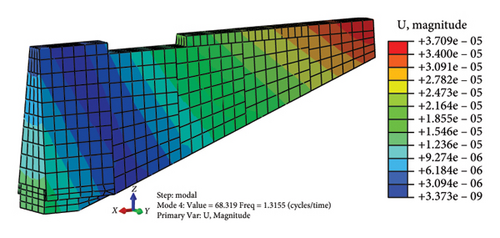
According to the modal participation coefficient in the modal analysis results, the first four mode shapes of the model are mainly in the y direction except the second order are mainly in the x direction. That is, when the wall is subjected to dynamic action, it will be destroyed on both sides along the direction of its weak stiffness, which is in line with the post-earthquake damage of the earthquake site.
Based on Table 2, ω1 and ω2 are 5.9220 and 5.9330, respectively, substituting them into formula (1) and (2), the Rayleigh damping coefficients α and β are calculated to be 0.2964 and 0.008435, respectively.
3.2. Boundary Conditions and Ground Motion Input
The selection of the artificial boundary is very important, when the finite element method is used to simulate the infinite foundation. The viscoelastic artificial boundary can overcome the problem of low frequency drift, and can well simulate the elastic recovery function of the infinite medium outside the artificial boundary. It has good frequency stability, high precision and applicability, but it requires the user to have a certain programming foundation in order to use the external interface of the finite element software to achieve, while consuming a lot of preprocessing time [30]. Therefore, in this paper, the equivalent viscoelastic artificial boundary element derived from the viscoelastic artificial boundary is used to simulate the foundation radiation damping.
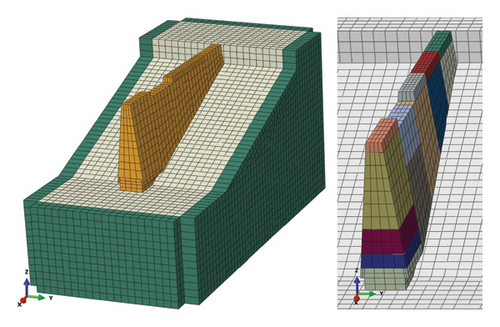
As mentioned above, the equivalent viscoelastic boundary elements are applied to the four sides of the foundation, while the bottom is fixed. The walls are assigned free boundaries on all sides, and the bottom surface of the walls is tied to the foundation surface using a Tie constraint. During meshing, the top of the wall and the erosion at the bottom of the wall are refined, while the rest of the wall and foundation are meshed with a size of 0.5 m. The specific model mesh is shown in Figure 5, where the green parts represent the equivalent consistent viscoelastic boundary elements.
The default penalty function of cohesive contact is used to simulate the vertical overlap, and the finite element software ABAQUS will automatically establish the relationship between stress and relative displacement. The transverse through-cracks are simulated using a weak contact approach, where the stiffness coefficient and damage separation displacement between the cracks are defined to control material failure. The maximum control stress is calculated based on the tensile strength of the wall material, set at 100 kPa.
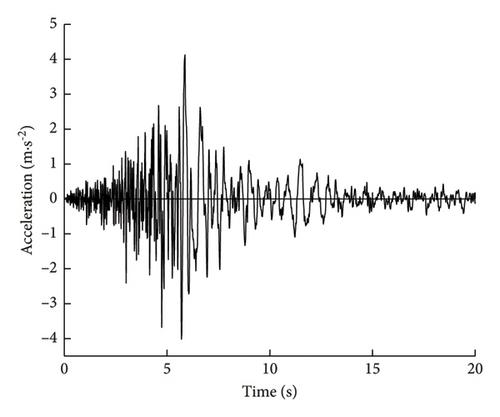
As described in Section 2, Jishixiongguan is located at the junction of Gansu Province and Qinghai Province, across the Yellow River from Qinghai. The nearest strong earthquake station is Guanting station. It is located at 102.71°E, 35.88°N, about 6 km away from Jishixiongguan. Both of them are located on the old terrace of the Yellow River, and the site conditions are consistent. Therefore, this paper selects the filtered strong earthquake record of Guanting station in Qinghai as the input ground motion, the acceleration time history curve is shown in Figure 6. The NS-direction acceleration time history curve is used as the x-direction input ground motion, taking into account the actual orientation of Jishixiongguan and the epicenter. The PGA is 4.1258 m/s2, and it occurs at 5.87 s. The acceleration is input from the bottom of the foundation, and the time history analysis is carried out by direct integral method.
4. Analysis of Seismic Dynamic Response Results
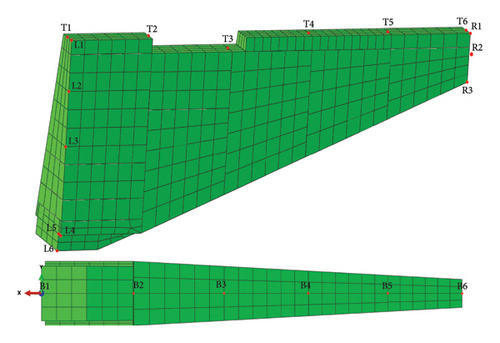
The measuring points shown in Figure 7 are selected to analyze the seismic dynamic response of the wall in detail. Among them, B1∼B6 and T1∼T6 are used to analyze the AE of slope; T1 and L1, L4 and L5, T6, and R1 were used to analyze the AE of the free surface. L1∼L6 and R1∼R3 are used to analyze the AE of different heights on the left and right ends of the wall, among which L2 is highly consistent with R3. In order to facilitate the subsequent analysis of the numerical results, the bottom midpoint of the left-end of the wall (i.e., the B1 measuring point) is taken as the coordinate origin, the x-axis is forward to the left, and the z-axis is vertical upward. The overall coordinate conforms to the right-handed spiral rule, as shown in Figure 7.
4.1. Characteristics of Displacement Response
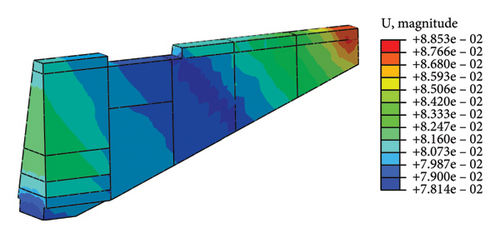
Figure 8 is the absolute displacement cloud map of Jishixiongguan after NS direction seismic load. From the diagram, it can be seen that the displacement value increases from the bottom to the top as a whole, and shows a pattern of decreases-increases from left to right. The maximum absolute displacement of the wall appears at the top crack of the right-end whose value is 8.853 cm. The contour of the displacement cloud map is approximately perpendicular to the slope, indicating that the AE of slope plays a leading role in the formation of the wall displacement.
Based on the maximum absolute displacement of 7.6225 cm on the surface of the horizontal foundation at the bottom of the left wall, the maximum relative displacement (hereinafter referred to as displacement u, which refers to the maximum displacement of the wall during the motion process.) of each measuring point is listed in Table 3, according to the maximum absolute displacement of each measuring point extracted. It can be seen from Table 3 that at the same height, the displacement of the right measuring point of the wall (uT6 = 10.408 mm, uR3 = 9.533 mm) is obviously larger than that of the left measuring point (uT1 = 4.948 mm, uL2 = 5.429 mm). The field investigation also shows that the damage on the right side of the wall is obviously more serious than that on the left side. The distribution of the displacement is basically the same as that of the field investigation after the earthquake, indicating that the simulation results in this paper are reasonable. Therefore, the displacement of the wall is significantly affected by the AE of the slope. When it is transmitted upward from the bottom of the wall, it is amplified by the height of the wall, and the left and right sides show different amplification rules.
| Measuring point | Displacement (mm) |
|---|---|
| B1 | 2.086 |
| B2 | 3.783 |
| B3 | 3.375 |
| B4 | 2.587 |
| B5 | 5.395 |
| B6 | 9.533 |
| T1 | 4.948 |
| T2 | 3.464 |
| T3 | 2.248 |
| T4 | 4.99 |
| T5 | 7.309 |
| T6 | 10.408 |
| L1 | 4.951 |
| L2 | 5.429 |
| L3 | 5.893 |
| L4 | 3.548 |
| L5 | 3.014 |
| L6 | 2.086 |
| R1 | 10.409 |
| R2 | 9.997 |
| R3 | 9.533 |
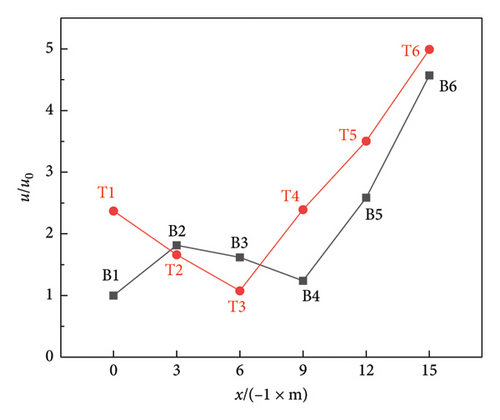
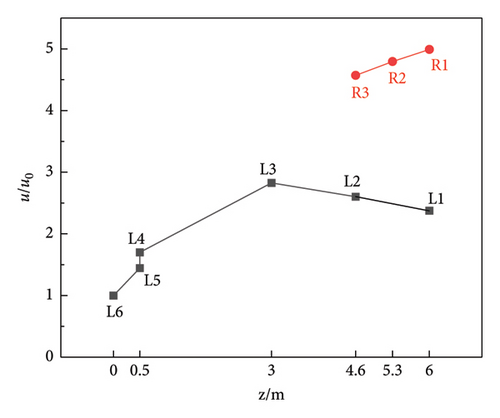
In order to better analyze the variation law of wall displacement along height z and slope x, the displacement of each measuring point is normalized, based on the displacement u0 of the coordinate origin (u0 = 2.086 mm). The displacement ratio u/u0 is defined as the ratio of the displacement of other measuring points to the u0. The relationship curves between u/u0 − z and u/u0 − x are shown in Figure 9, and the u/u0 of each measuring point is listed in Table 4.
| Measuring point | u/u0 |
|---|---|
| B1 | 1.0000 |
| B2 | 1.8135 |
| B3 | 1.6179 |
| B4 | 1.2402 |
| B5 | 2.5863 |
| B6 | 4.5700 |
| T1 | 2.3720 |
| T2 | 1.6606 |
| T3 | 1.0777 |
| T4 | 2.3921 |
| T5 | 3.5038 |
| T6 | 4.9895 |
| L1 | 2.3734 |
| L2 | 2.6026 |
| L3 | 2.8250 |
| L4 | 1.7009 |
| L5 | 1.4449 |
| L6 | 1.0000 |
| R1 | 4.9899 |
| R2 | 4.7924 |
| R3 | 4.5700 |
From Figure 9(a) and Table 4, it can be seen that the u/u0 of the B1∼B6 at the bottom of the wall shows a pattern of increases-decreases-rapidly increases with the increase of slope, the minimum among them appears is 1.2402 at B4; the u/u0 of the T1∼T6 at the top of the wall shows a pattern of decreases and then increases rapidly with the increase of slope. Due to the influence of defect at the top, the minimum among them appears is 1.0777 at T3. The u/u0 of the T4∼T6 and B4∼B6 in the fourth and fifth sections of the wall increases with the increase of the slope, and the u/u0 of T4∼T6 at the top of the wall is obviously larger than that of the corresponding B4∼B6 at the bottom of the wall.
From Figure 9(b) and Table 4, it can be seen that the u/u0 of the L1∼L6 on the left side of the wall shows a pattern of increases-decreases with the increase of height, the maximum among them appears is 2.8250 at L3. The u/u0 of the R1∼R3 on the right side of the wall shows a pattern of increases with the increase of height, and the maximum among them is 4.9899 at R1. The u/u0 of the right measuring point is significantly higher than that of the left measuring point. The displacement ratio difference (DRD) between the left and right measuring points L1 and R1 at the top of the wall at z = 6 m is 2.6165, while the DRD between the left and right measuring points L2 and R3 at z = 4.6 m is 1.9674, indicating that the DRD at the same height of the wall increases with the height of the wall.
Summarizing the variation law of wall displacement along height z and slope x, it can be inferred that the AE of the slope on the wall displacement is obvious due to the wall is built on the mountain, and the closer to the slope height, the more significant the AE is. Therefore, the damage of right part of the wall is the most serious, and the maximum displacement ratio appears at R1 on the free surface of the right-end wall top, because it relies on the slope height of the mountain, and the height of wall also has an AE on the displacement.
Combined with Figure 9 and Table 4, the influence of AE of free surface on wall displacement is analyzed. The u/u0 of the three free face measuring points L1, L4, and R1 are 2.3734, 1.7009, and 4.9899, respectively. The u/u0 of the corresponding comparative measuring points T1, L5, and T6 are 2.3720, 1.4449, and 4.9895, respectively. The numerical results show that the u/u0 of the three free face measuring points are larger than those of the comparative measuring points. The u/u0 of two groups of measuring points T1 and L1, T6, and R1 on the same side of the wall top are almost the same, while there is a large DRD between L4 and L5 at the bottom of the wall. Therefore, it can be inferred that the cracking causes the fall off at the bottom erosion of the wall due to the large displacement difference between the internal suspension and the free surface of the wall.
4.2. PGA Response Characteristics
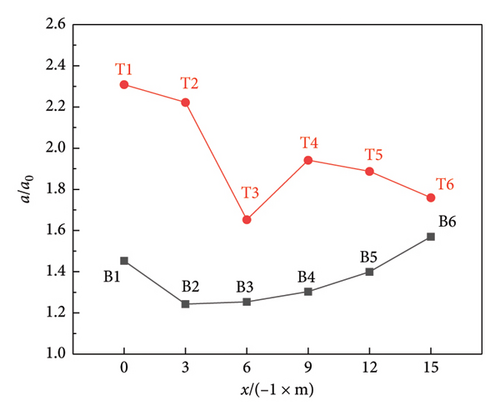
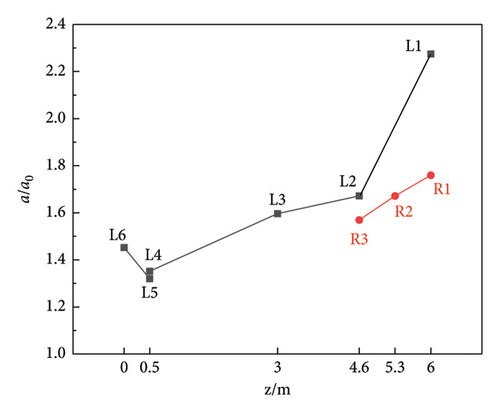
In order to better analyze the variation law of wall acceleration along height z and slope x, based on the 4.1258 m/s2 of input PGA, the peak acceleration (PA) of each measuring point in the time history is extracted, and the acceleration ratio a/a0 is defined as the ratio of the PA in the time history of each measuring points to the input PGA. The relationship curves between a/a0 − z and a/a0 − x are shown in Figure 10, the PA and its time and a/a0 of each measuring point are listed in Table 5.
| Measuring point | PA (m/s2) | Time (s) | a/a0 |
|---|---|---|---|
| B1 | 5.9936 | 6.34 | 1.4527 |
| B2 | 5.1272 | 6.36 | 1.2427 |
| B3 | 5.1730 | 6.16 | 1.2538 |
| B4 | 5.3756 | 6.16 | 1.3029 |
| B5 | 5.7725 | 6.17 | 1.3991 |
| B6 | 6.4762 | 6.18 | 1.5697 |
| L1 | 9.3842 | 6.41 | 2.2745 |
| L2 | 6.8961 | 6.05 | 1.6715 |
| L3 | 6.5891 | 6.17 | 1.5970 |
| L4 | 5.5774 | 6.35 | 1.3518 |
| L5 | 5.4468 | 6.34 | 1.3202 |
| L6 | 5.9932 | 6.34 | 1.4526 |
| T1 | 9.5252 | 6.41 | 2.3087 |
| T2 | 9.1694 | 6.41 | 2.2225 |
| T3 | 6.8207 | 6.05 | 1.6532 |
| T4 | 8.0101 | 6.19 | 1.9415 |
| T5 | 7.7885 | 6.18 | 1.8878 |
| T6 | 7.2604 | 6.18 | 1.7597 |
| R1 | 7.2600 | 6.18 | 1.7597 |
| R2 | 6.8992 | 6.18 | 1.6722 |
| R3 | 6.4758 | 6.18 | 1.5696 |
From Table 5, it can be seen that the a/a0 of each measuring point is greater than 1, indicating that the height of the wall and the slope does have an AE on the PGA; and the time when the PA occurs at each measuring point is greater than the time occurs is 5.87 s of the PGA, indicating that the AE of PGA has a lag.
Form Figure 10(a) and Table 5, it can be seen that the a/a0 of the measuring points at the top of the wall is generally greater than the a/a0 of each measuring point at the bottom of the wall, and the greater the height difference between the two measuring points, the greater the acceleration ratio difference (ARD). The a/a0 from B1 to B2 at the bottom of the wall decreases with the increase of slope height, with a decrease of 14.5%, while the a/a0 of the B2∼B6 increases steadily with the increase of the slope height, and the greater the slope height, the greater the increase, with an increase of 0.9%∼12%. The a/a0 of the T1∼T6 at the top of the wall also showed abnormal points with the increase of the slope. Except that the a/a0 of the T3 decreased rapidly with the increase of the slope (the reduction reached 25.6%), the a/a0 of the other five measuring points decreased steadily with the increase of the slope, and the greater the slope height, the greater the reduction, and the reduction was 2.76%∼6.8%. There is a bottom erosion between the B1 to B2, and a defect at the top of the wall at the T3, while there is an abnormal AE of acceleration at both positions, indicating that the lack of wall will reduce the AE of acceleration of the slope to a certain extent, the reason for this phenomenon is that the original stress state is changed due to the defect of the intact wall caused by the erosion. The energy will be dissipated and absorbed by the defect when the seismic wave propagates through the defect position of the wall, resulting in the weakening of the acceleration AE of the defect position [10, 23].
It can be seen from Figure 10(b) and Table 5, at the same height z = 6 m, the a/a0 is 2.2745 at the left measuring point L1, which is 1.29 times that of the right measuring point R1. At z = 4.6 m, the a/a0 is 1.6715 at the left measuring point L2, which is 1.06 times that of the right measuring point R3. That is to say, the greater the z, the greater the ARD between the left and right measuring points at the same height, which is the same as the overall law of the u/u0 along the wall height. The a/a0 of the L1∼L4 on the left side of the wall increases with the increase of the wall height, and the increase is 4.7%∼36.1%, and the increase of the a/a0 between the L3 and L2 is significantly smaller than that between other adjacent points on both sides, but the a/a0 of the L6 to the L4 decreases with the increase of the wall height, and the reduction reaches 14.5%. There is transverse through cracks between L1 to L2 and L3 to L4, and hollowed-out overhangs between L4 to L6, indicating that erosion will greatly weaken the AE of wall height on acceleration, while transverse through cracks will strengthen the AE of wall height on acceleration.
Summarizing the variation law of wall acceleration along height z and slope x, it can be inferred that after the seismic wave is transmitted to the slope and amplified by the slope, then it will be amplified by the height of the wall. The height of the wall on both sides and the height difference between the two points are the main factors for the difference in AE of acceleration, and the AE of wall height on acceleration is dominant.
Combined with Figure 10 and Table 5, the influence of AE of free surface on wall acceleration is analyzed. The a/a0 of the three free surface measuring points L1, L4, and R1 are 2.2745, 1.3518 and 1.7597, respectively. The a/a0 of the corresponding comparison measuring points T1, L5, and T6 are 2.3087, 1.3202, and 1.7597, respectively. The results show that the a/a0 of the L1 and R1 at the free surface of the top wall are smaller than the a/a0 of the comparison T1 and T6, while the a/a0 of the free surface L4 at the hollowed-out overhangs is greater than the a/a0 of the comparison L5. It can be inferred that the free surface does not have an AE on the acceleration of the wall top, but the a/a0 of the outer surface will be greater than the internal a/a0 due to the defect at the bottom of the wall, that is, the wall bottom erosion will cause the acceleration to weaken when it propagates upward along the wall height, but it will amplify when it propagates outward in the horizontal direction.
4.3. Stress-Strain Analysis of Wall
When the load increases to the point where the stress in the wall reaches its shear strength and the structure is in a state of limit equilibrium, the damaged area is referred to as the plastic zone. Fig. 11 illustrates the evolution of the plastic zone in the Jishixiongguan under seismic action at times t = 0.2 s, t = 5.5 s, t = 10 s, and t = 20 s. In the figure, the red dots indicate the nodes where the maximum plastic strain occurs at each respective time.
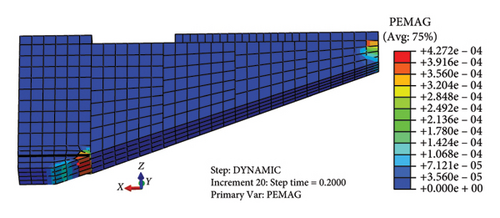
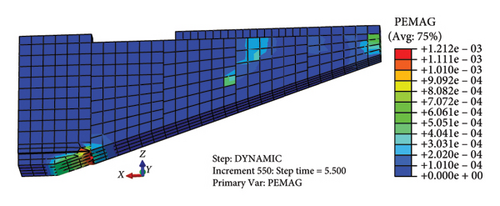
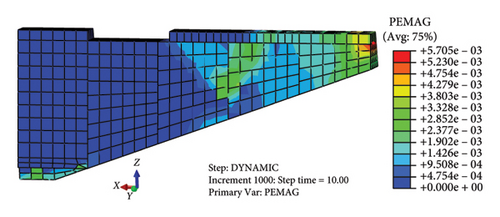
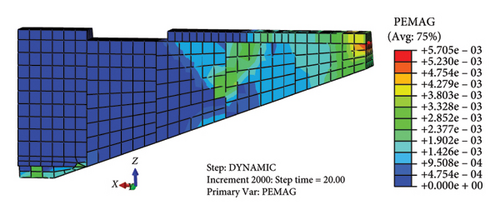
It can be seen from Figures 11(a), 11(b), 11(c), and 11(d) that the plastic zone first develops from the bottom erosion of the wall near the bottom of the vertical rammed lap and the transverse through crack on the right-end wall top, and expands rapidly from the top to the bottom of the wall along the slope to the inside wall. The plastic strain increases gradually in the time history, and the maximum point of the plastic strain changes from the bottom erosion to the transverse crack at the top of the right-end wall until the wall is failure. After the vibration, the maximum plastic strain is located at the top crack of the right-end wall, and the plastic zone is mostly concentrated in the third, fourth, and fifth sections of the wall, all of which expand rapidly downward from the transverse crack of the wall top. Combined with the field investigation, the distribution of plastic zone and the value of plastic strain after earthquake are consistent with the different damage degree of wall collapse. Therefore, the development of the plastic zone can characterize the failure process of Jishixiongguan in the Jishishan MS6.2 earthquake, and it can be found that the distribution of plastic zone and the value of plastic strain at t = 10 s and t = 20 s are consistent in Figures 11(c) and 11(d). It shows that the plastic zone of the wall develops quickly, and the destructive permanent displacement has been generated in a short period of time after the PGA, and no new plastic yield has been generated under the subsequent small amplitude vibration.
Figure 12 is the equivalent stress cloud map of Jishixiongguan under the action of earthquake when the t = 0.2 s, t = 5.5 s, t = 10 s and t = 20 s. The red dot in the figure indicates the node where the maximum equivalent stress is at the current moment. It can be seen from Figures 12(a), 12(b), 12(c), and 12(d) that the maximum value of the equivalent stress first appears in the middle of the fifth section of the wall near the bottom of the wall, and then focuses on the left side of the bottom erosion of the wall. The maximum equivalent stress is in the range of 91.76∼167.80 kPa, which exceeds the resistance strength of the wall in most of the time. The stress discontinuity of the equivalent stress at the vertical lapping and transverse through cracks may be the reason for the separation cracks at the vertical lapping of the wall.
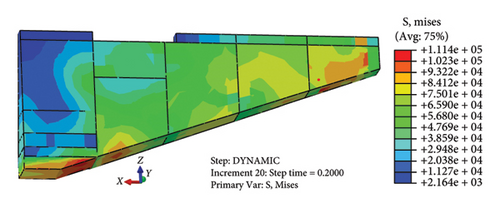
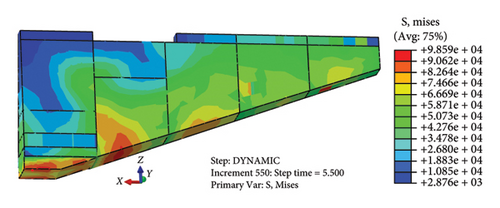
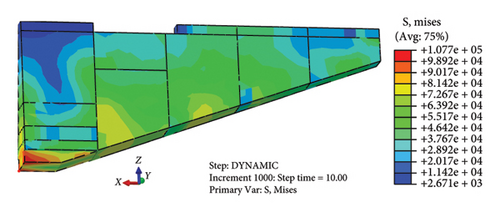
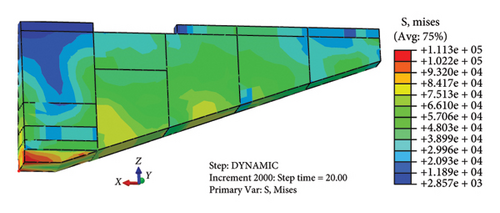
Combined with the above characteristics of displacement, acceleration, stress and strain of the wall, it can be inferred that the main reason for the damage at the bottom erosion of the wall is the large displacement difference between the internal suspension and the external free surface caused by the concentration of the equivalent stress, which leads to the falling of the block. The main reason for failure of the second section of the wall is the stress discontinuity at the transverse through cracks, and the wall separates from there to produce the collapse block. The third, fourth and fifth sections of the wall are closer to the height of the slope from left to right, due to the comprehensive AE of the slope and the height of the wall on the displacement, the plastic yield of the wall occurs, and then the large area of the wall collapses from the transverse through cracks on the wall top, and finally only part of the fresh inner wall is retained. That is to say, the stress concentration caused by hollowed-out overhangs and stress discontinuity caused by the transverse through crack is the internal factor of the wall failure, the plastic yield of soil caused by the AE of slope and wall height on displacement is the external cause of large area collapse of wall.
5. Conclusions
- 1.
Owing to the wall being constructed against a mountain slope, the AE of the slope on the displacement of the wall is obvious, the closer the wall is to the higher parts of the slope, the more significant the AE of the displacement is due to the combined effect of the slope gradient and the wall height. The maximum displacement of the wall occurs at the crack at the top of the right end, with a maximum value of 10.409 mm.
- 2.
Pre-existing defects in the wall will weaken the AE of the slope and wall height on acceleration, however, the transverse through cracks will enhance the AE of the wall height on acceleration.
- 3.
The plastic zone initially develops from the bottom erosion of the wall and the transverse through crack at the top of the right-end, and it rapidly extends downward along the slope into the interior of the wall, resulting in destructive permanent displacement shortly after the PGA is reached.
- 4.
Stress concentration caused by hollowed-out overhangs and stress discontinuity caused by the transverse through crack are the internal factor of the wall failure, the plastic yield of soil induced by the AE of slope and wall height on displacement is the external factor of large-scale collapse of wall.
Conflicts of Interest
The authors declare no conflicts of interest.
Funding
This work was supported by the Earthquake Science and Technology Development Fund Project (grant numbers 2022S02); Gansu Youth Science and Technology Fund Plan (grant numbers 22JR5RA827); Earthquake Science and Technology Spark Program (grant numbers XH24046YA, XH20057); and Open Project of Gansu Provincial Research Center for Conservation of Dunhuang Cultural Heritage (grant Numbers GDW2021YB07).
Open Research
Data Availability Statement
The data that support the findings of this study are available from the corresponding author, Xiumei Zhong, upon reasonable request.


