Noise Control Method of Hybrid Engine Based on Masking Effect
Abstract
The mismatch between the engine noise and the vehicle speed of hybrid vehicles in the state of battery depletion constitutes one of the main noise sources of the vehicles. A noise testing method for the hybrid engine was proposed with the aid of the rotating hub test bench. The data of the in-vehicle engine noise under various operating powers were parsed, and simultaneously, the background noise data within the vehicle during the uniform-speed driving in the pure electric driving mode of the vehicle were collected. Based on the acoustic masking effect, a subjective evaluation method has been developed to assess the masking impact of background noise on engine noise within vehicles. Analysis of the subjective evaluation results revealed that a fundamental condition for effective masking of engine noise by background noise is that the latter must sufficiently envelop the characteristic spectrum of the engine noise. Ultimately, the vehicle calibration strategy was refined based on the outcomes of subjective evaluations. This adjustment not only enhanced the vehicle’s NVH performance but also introduced an innovative approach to engine noise control in hybrid vehicles operating in series mode.
Summary
- •
Based on the revolving drum test apparatus, a specialized testing methodology for assessing the noise generated by hybrid engines has been proposed.
- •
Through the operational mode of driving the vehicle via the rotary hub, it is possible to quickly and accurately obtain the engine noise within the vehicle by designing the running speed of the rotary hub and adjusting the engine power.
- •
Based on the acoustic masking effect, a method for evaluating the noise masking performance of hybrid engines has been developed.
- •
Subjective assessments of 216 sets of in-vehicle engine noise were conducted by a panel of experts, and through the analysis of the spectral curve, it is obtained that the fundamental condition for the engine noise to be masked by the background noise is that the background noise should basically envelop the characteristic spectrum of the engine noise.
- •
Based on the content presented in Sections 3 and 4, this study optimizes system power distribution by adjusting the calibration strategy within the vehicle series mode, without altering the vehicle’s hardware system.
- •
The results indicate a significant improvement in engine noise levels experienced within the vehicle interior for certain power outputs.
- •
This approach offers a novel perspective for optimizing engine noise in hybrid vehicles.
1. Introduction
Hybrid vehicles represent a significant technological approach to reducing emissions and promoting the sustainable development of the automotive industry. Hybrid electric vehicles, which use two power sources (fuel and electricity), have the advantages of both IC engine vehicles and EVs and overcome their disadvantages [1].
Unlike traditional fuel-powered vehicles, hybrid models feature engines that perform essential functions such as power generation during battery depletion, power supplementation, and direct drive at high speeds. The operational characteristics of the hybrid engine have a direct impact on fuel consumption [2], battery status [3], and overall vehicle noise across the entire system [4].
Psychoacoustics serves as the foundation for investigating vehicle sound quality, encompassing both subjective auditory perception and objective psychoacoustic metrics [5, 6]. The masking effect is a notable characteristic of auditory perception in humans, referring to the phenomenon whereby the auditory threshold for a specific sound increases due to the presence of another sound. This effect has found extensive applications within the automotive industry. Wang et al. [7] proposed a postmasking root mean square (RMS) adaptive least mean square (LMS) algorithm based on this masking effect, which was directly implemented in active noise reduction systems for vehicles to enhance passenger comfort during travel. Yuan et al. [8] demonstrated that appropriately selected masking sounds could effectively obscure interior noise levels in buses and improve overall sound quality within these vehicles. Furthermore, Feng et al. [9] indicated that the masking effect exhibits superior performance in predicting the degree of annoyance caused by acceleration noise.
Hybrid engines are progressively evolving toward miniaturization, higher efficiency, and complexity, featuring a relatively high compression ratio and constantly improving engine thermal efficiency [10]. Technologies such as ultra-high compression ratio [11], external cooling EGR [12], Atkinson cycle [13], and variable valve timing control system (vvt-i) [14] are widely used in hybrid engines. This also poses significant challenges for the development of engine NVH (Noise, Vibration, and Harshness). The optimization of NVH in hybrid engines can be achieved through a dual approach: on the one hand, by employing structural design and system optimization [15, 16]; on the other hand, by implementing active noise reduction strategies [17–19]; the former is applicable solely during the initial stages of project development, while the latter incurs additional costs due to the presence of active sound devices.
In light of the limitations associated with the aforementioned methods, some researchers have begun to investigate the optimization of energy management strategies for hybrid vehicles in order to enhance the NVH performance of engines under comprehensive vehicle conditions. Delkhosh et al. [20, 21] modified the energy management strategy for hybrid vehicles to reduce engine noise to levels lower than those generated by road noise. Millo et al. [22] developed an energy management strategy aimed at minimizing engine noise in range-extended electric vehicles. For plug-in hybrid vehicle, Zhang et al. [23] designed an equivalent consumption minimization strategy combined with the dual-loop particle swarm optimization algorithm. This strategy ensures the NVH level during low-speed driving while reducing fuel consumption by 1.3%–9.9%.
To summarize, in order to further enhance the NVH levels of the entire vehicle during the mid-to-late stages of product development, this paper investigates noise control strategies for hybrid engines based on the masking effect. The objective is to mask engine noise beneath road and wind noises. Firstly, we introduce the concept of the masking effect as it pertains to psychoacoustics. Secondly, we propose a testing methodology for assessing hybrid engine noise by utilizing a chassis dynamometer to collect engine noise data while ensuring that the engine and vehicle remain coupled. Furthermore, we establish a subjective evaluation method for assessing the masking effect of engine noise grounded in reference semantic segmentation techniques. Based on these evaluation results, we optimize the calibration strategy for the entire vehicle with an aim to improve its overall NVH performance.
2. Masking Effect and Critical Band
2.1. Masking Effect
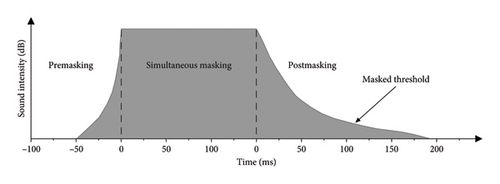
The phenomenon whereby the auditory sensitivity of the human ear to certain sounds is diminished in the presence of another sound is referred to as the masking effect. This effect includes both nonsimultaneous masking and simultaneous masking. Nonsimultaneous masking pertains to the interaction between two distinct sounds that occur within a brief temporal window, which encompasses premasking and postmasking effects. As illustrated in Figure 1, the premasking effect typically lasts for approximately 3–5 milliseconds, while the postmasking effect generally endures for about 50–100 milliseconds. Following this period, the intensity of the masking effect decreases rapidly and nearly vanishes after approximately 200 milliseconds [24].
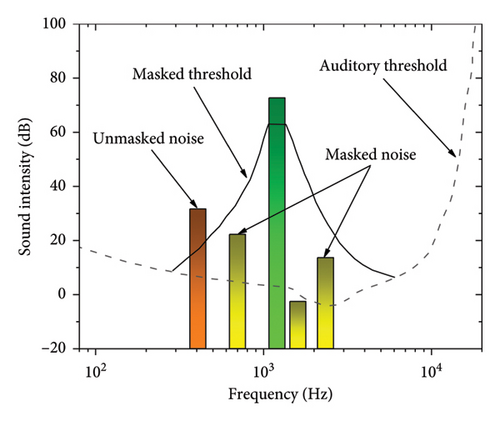
Simultaneous masking is also referred to as frequency masking. As illustrated in Figure 2, when frequencies are closely spaced, a stronger sound with a larger amplitude can effectively mask the presence of a coexisting weaker sound with a smaller amplitude.
2.2. Critical Band
The concept of the critical band is fundamental in the field of psychoacoustics [25]. Consider a scenario where white noise possesses a critical bandwidth denoted as Δf and a center frequency represented by f, which effectively masks a pure tone signal at frequency f. We define this bandwidth Δf as the critical band corresponding to frequency f, measured in Bark. Notably, the degree of masking does not increase with an expansion of the masking sound’s bandwidth. Furthermore, the width of the critical band is closely associated with its center frequency, exhibiting an increase in width as the center frequency rises.
Among them, the unit of center frequency fc is Hz.
Among them, the unit of the bandwidth function ΔfG is Hz.
3. Refinement of Vehicle Noise Testing
3.1. Noise Sources of Hybrid Electric Vehicles
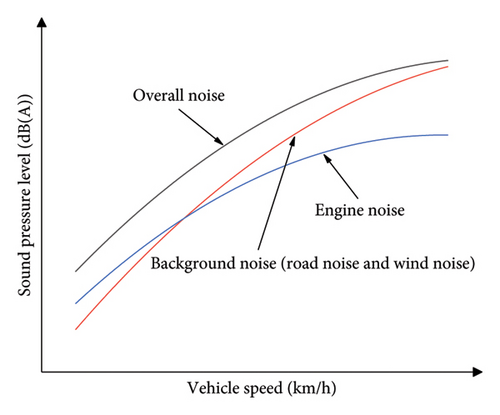
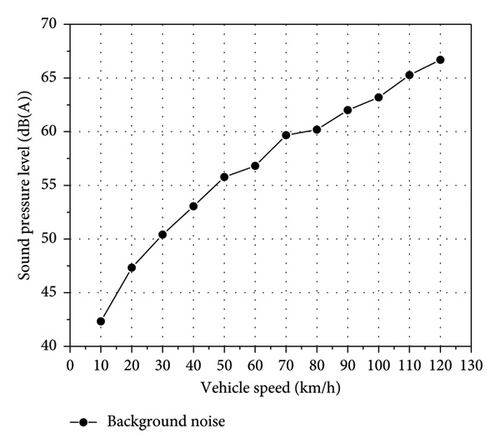
The engine noise characteristics of hybrid vehicles differ from those of traditional vehicles. Under low battery charge conditions, the battery is no longer capable of supplying energy to the vehicle. Consequently, all of the vehicle′s energy requirements are fulfilled by the engine, which results in a significantly increased load on the engine [27]. At medium to high speeds, road noise and wind noise exert a more pronounced influence compared to the noise generated by the power system. To facilitate a more comprehensive analysis of these acoustic sources, this paper categorizes both road noise and wind noise as “background noise.” Figure 3 illustrates how background noise can become increasingly dominant at higher speeds [28].
3.2. Engine Noise Test
3.2.1. Testing Equipment and Methods
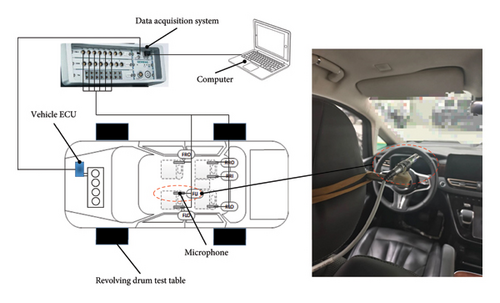
To isolate the engine noise from the overall vehicle noise, this paper introduces a testing methodology for assessing the noise generated by hybrid engines in an operational vehicle state. Unlike traditional engine bench tests, this approach takes into account actual load conditions, power flow strategies, and the vehicle’s transmission pathways, thereby allowing the engine to operate closer to real-world driving scenarios. The test subject is a plug-in hybrid engineering prototype equipped with a 2.0T hybrid-specific engine. The detailed specifications of the vehicle are presented in Table 1. The architecture of the vehicle’s powertrain follows a P1 + P3 + P4 hybrid configuration.
| Parameter | Value |
|---|---|
| Engine displacement | 1989 mL |
| Air intake mode | Turbo charge |
| Number of cylinders | 4 |
| Maximum engine power | 120 kW |
| Maximum engine torque | 260 N m |
| Maximum power of motor | 210 kW |
| Maximum torque of motor | 440 N m |
| Battery capacity | 20 kWh |
- 1.
Pure electric drive hub test
- 2.
Hub testing in series drive mode
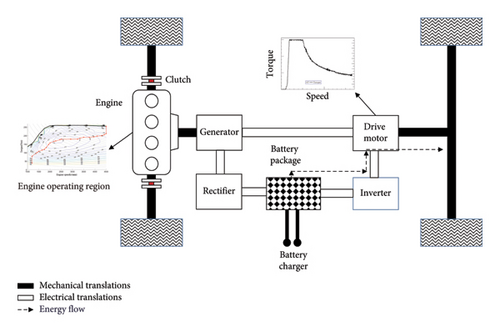
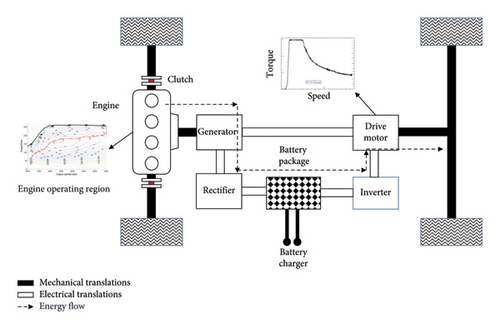
The vehicle is driven by the active rotation of the hub, with the vehicle placed in D gear. The engine is started to maintain the vehicle in the series drive mode unchanged. At this time, the engine speed is decoupled from the vehicle speed. The energy flow of the vehicle is as shown in Figure 5(b), keeping the engine power in a stable state. The noise at the right ear of the driver’s seat is tested. In order to reduce the influence of the operating noise of the hub itself on the test results, the hub speed and engine power as shown in Table 2 are adopted.
| Hub speed (km h−1) | Engine power (kW) |
|---|---|
| 10 | 10 |
| 10 | 20 |
| 10 | 30 |
| 20 | 40 |
| 20 | 50 |
| 40 | 60 |
| 40 | 70 |
| 60 | 80 |
| 60 | 90 |
| 60 | 100 |
3.2.2. Computation of Engine Noise
Among these, Pref represents the benchmark reference sound pressure, while 2 × 10⁻⁵(Pa) is measured in air.
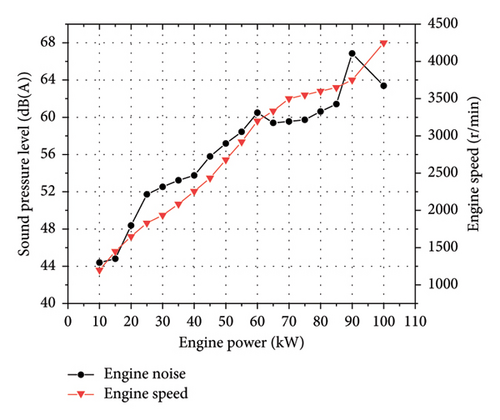
The A-weighted sound pressure level serves as a reliable indicator of noise levels. Consequently, this paper adopts the A-weighted sound pressure level as the evaluation index. The results pertaining to engine noise are illustrated in Figure 6. It is evident that the noise generated by the hybrid engine does not exhibit a continuous increase with rising output power. This phenomenon can be attributed to two primary factors: firstly, variations in engine excitation frequency affect the vibration isolation performance of the engine mounts; secondly, component resonance occurs at specific frequencies, leading to pronounced booming effects. In light of this analysis, it is possible to mitigate high-noise outputs during strategy calibration.
3.3. Background Noise Test
To acquire the background noise, a test was conducted using a pure electric vehicle at a uniform speed. The testing took place on an outdoor smooth asphalt pavement, with microphone measurement points and data acquisition systems identical to those described in Section 3.2.1. Speeds ranged from 10 km/h to a constant speed of 120 km/h in increments of 10 km/h. During the driving process, the pure electric mode was utilized, and the background noise signal within the vehicle was recorded. The results are presented in Figure 7. It can be observed from the graph that as vehicle speed increases, background noise gradually intensifies. This phenomenon primarily arises from the escalating wind and road noise generated by the vehicle at higher speeds.
4. A Noise Evaluation Method for Hybrid Engines Based on the Masking Effect
4.1. Subjective Evaluation of the Engine Masking Effect
According to the test results presented in Section 3, the ANSYS VRXPERIENCE-NCE Sound software was employed to cross-synthesize 18 engine noise samples and 12 background noise samples. This process yielded a total of 216 in-vehicle noise samples. The subjective evaluation panel comprised five individuals who had undergone systematic professional training, aged between 24 and 40 years. This panel was capable of objectively reflecting customers’ perceptions of engine noise within the vehicle [29].
In this study, the “reference semantic segmentation method” is employed to assess the masking effect of engine noise. The evaluation criteria for the degree of engine noise masking and their corresponding assignments are presented in Table 3. Ultimately, the rounded average score from five jury members is taken as the final result. The scoring outcomes regarding the engine noise masking effect are displayed in Table 4, and scores that are equal to or greater than 8 are represented by the symbol “+,” while scores that are equal to or less than 5.5 are indicated by the symbol “−.”
| Score | Subjective feelings |
|---|---|
| 5.5 | The engine sound is not concealed |
| 6.0 | The engine sound can be clearly recognized |
| 6.5 | Engine sound can be recognized |
| 7.0 | The engine sound is low |
| 7.5 | The engine sound is difficult to distinguish |
| 8.0 | The engine sound is completely muffled |
| Engine power/kW | Vehicle speed (km·h−1) | 10 | 20 | 30 | 40 | 50 | 60 | 70 | 80 | 90 | 100 | 110 | 120 |
|---|---|---|---|---|---|---|---|---|---|---|---|---|---|
| Sound pressure level (dB[A]) | 42.3 | 47.3 | 50.4 | 53.0 | 55.8 | 56.8 | 58.7 | 60.2 | 62.0 | 63.2 | 65.3 | 66.7 | |
| 0 | 0 | 8 | + | + | + | + | + | + | + | + | + | + | + |
| 10 | 44.4 | 5.5 | 6.0. | 6.5 | 7.0 | 7.5 | 8.0 | + | + | + | + | + | + |
| 15 | 44.8 | 5.5 | 6.0 | 6.5 | 7.0 | 7.5 | 8.0 | + | + | + | + | + | + |
| 20 | 48.4 | − | 5.5 | 6.0 | 6.5 | 7.0 | 7.5 | 8.0 | + | + | + | + | + |
| 25 | 51.7 | − | − | 5.5 | 6.0 | 6.5 | 7.0 | 7.5 | 8.0 | + | + | + | + |
| 30 | 52.5 | − | − | − | 5.5 | 6.0 | 6.5 | 7.0 | 7.5 | 8.0 | + | + | + |
| 35 | 53.2 | − | − | − | 5.5 | 6.0 | 6.5 | 7.0 | 7.5 | 8.0 | + | + | + |
| 40 | 53.8 | − | − | − | 5.5 | 6.0 | 6.5 | 7.0 | 7.5 | 8.0 | + | + | + |
| 45 | 55.8 | − | − | − | − | 5.5 | 6.0 | 6.5 | 7.0 | 7.5 | 8.0 | + | + |
| 50 | 57.2 | − | − | − | − | − | 5.5 | 6.0 | 6.5 | 7.0 | 7.5 | 8.0 | + |
| 55 | 58.4 | − | − | − | − | − | 5.5 | 6.0 | 6.5 | 7.0. | 7.5 | 8.0 | + |
| 60 | 60.5 | − | − | − | − | − | − | 5.5 | 6.0 | 6.5 | 7.0 | 7.5 | 8.0 |
| 65 | 59.4 | − | − | − | − | − | − | 5.5 | 6.0 | 6.5 | 7.0 | 7.5 | 8.0 |
| 70 | 59.6 | − | − | − | − | − | − | 5.5 | 6.0 | 6.5 | 7.0 | 7.5 | 8.0 |
| 75 | 59.7 | − | − | − | − | − | − | 5.5 | 6.0 | 6.5 | 7.0 | 7.5 | 8.0 |
| 80 | 60.2 | − | − | − | − | − | − | 5.5 | 6.0 | 6.5 | 7.0 | 7.5 | 8.0 |
| 85 | 61.4 | − | − | − | − | − | − | − | 5.5 | 6.0 | 6.5 | 7.0 | 7.5 |
| 90 | 66.9 | − | − | − | − | − | − | − | − | − | 5.5 | 6.0 | 6.5 |
| 100 | 63.4 | − | − | − | − | − | − | − | − | 5.5 | 6.0 | 6.5 | 7.0 |
4.2. Result Analysis
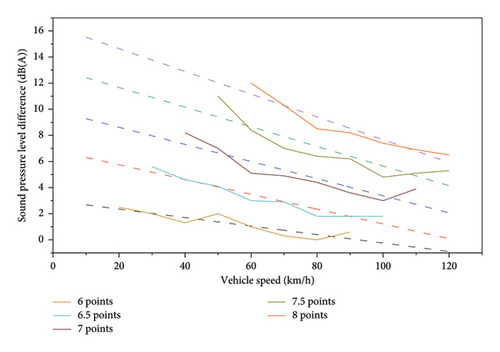
In order to investigate the impact of background noise on masked engine noise, an analysis is conducted on the differences between background noise and engine noise. Select two representative samples from Table 4. The difference between background noise at a speed of 100 km/h and engine noise at an output power of 60 kW is measured to be 2.7 dB(A). Conversely, when the vehicle speed is reduced to 50 km/h and the engine power is set at 20 kW, the difference between background noise and engine noise increases to 7.4 dB(A). It is important to highlight that, despite the substantial difference in sound pressure levels between these two conditions, their subjective assessment of the engine noise masking effect remains at 7 points. As illustrated in Figure 8, a notable trend can be observed: while the subjective evaluation score remains constant, the difference in sound pressure level diminishes as vehicle speed increases.
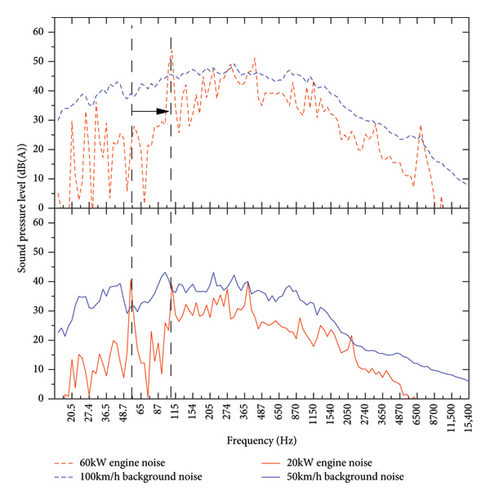
This phenomenon can be elucidated by the variations in vehicle speed and engine operating conditions. As vehicle speed increases, both the power output and rotational speed of the engine correspondingly rise, resulting in an elevation of the primary excitation frequency. As illustrated in Figure 9, the main frequency escalates from approximately 50 Hz to around 110 Hz. As the frequency increases, the critical bandwidth expands. Based on the characteristics of the masking effect in the frequency domain, higher frequencies are more susceptible to being masked [30].
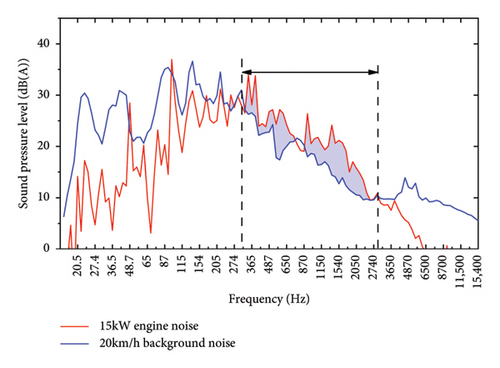
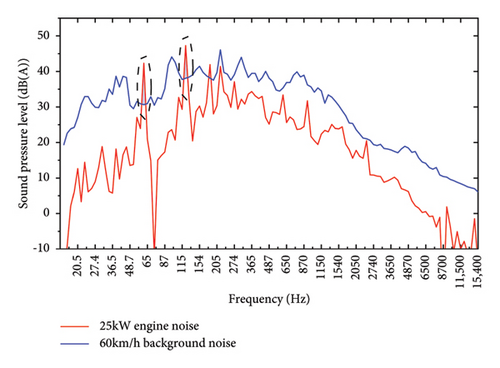
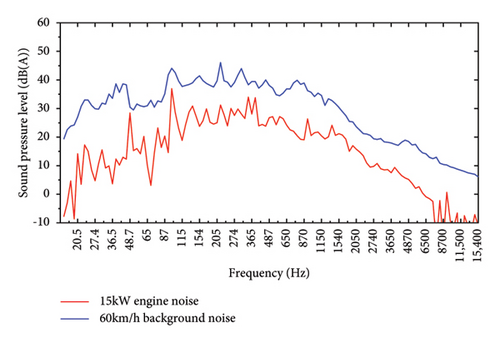
The spectrum of engine noise and background noise has been analyzed, with Figure 10 illustrating the spectral characteristics of engine noise and background noise across three groups exhibiting different subjective scores. Figure 10(a) shows the spectrum curve of 6 points of subjective evaluation. Within the frequency range of 300 Hz–2800 Hz, the frequency spectrum curve of the engine noise exceeds that of the background noise, indicating that background noise is insufficient to mask engine noise within this specific frequency range. As illustrated in Figure 10(b), the engine noise curve exceeds the background noise curve at only a few frequency points, while at other frequencies, the background noise envelops the engine noise. This phenomenon results in a significant masking effect. As illustrated in Figure 10(c), when the subjective score reaches 8, the background noise of the engine effectively envelops all frequency points, resulting in complete masking. Consequently, we can establish a fundamental condition for the masking of engine noise by background noise: it is essential for the background noise to provide an envelope that covers the characteristic spectrum of the engine noise.
5. Investigation of Calibration Strategies Based on Masking Effect
The calibration strategy significantly impacts the noise levels of hybrid models, with existing research primarily concentrating on optimizing fuel economy. Given that the engine speed in hybrid models can be decoupled from vehicle speed in series mode, this paper aims to mitigate engine noise by modifying the calibration strategy employed in hybrid models. To minimize the perception of engine noise by customers during driving, it is advisable to mask engine noise with background sounds. This paper examines the calibration strategy under a 2 m/s2 acceleration condition, utilizing the scores for engine noise masking effects presented in Table 4 as a reference.
All power in plug-in hybrid electric vehicle (PHEV) models is derived from both the engine and the battery [31]. The vehicle’s power demand encompasses the output power of the engine, the output power of the battery, and any associated loss power. The lost power primarily encompasses friction work, electrical load, vehicle electrical components, and motor efficiency. This portion of power must be supplied by the battery. The lost power can be determined through postprocessing of the power data from the battery, motor, and engine during vehicle acceleration, as illustrated in Figure 11. In this study, linear fitting is performed to analyze these relationships.

During vehicle operation, it is essential to overcome various resistances. Utilizing data on the total sliding resistance of the vehicle and its weight, one can derive the relationship between the power demand for total vehicle acceleration and vehicle speed at an acceleration rate of 2 m/s2. According to the evaluation presented in Table 4 regarding the engine noise masking effect, under constant-speed condition, the engine power is constrained to the maximum attainable level that satisfies the requirement of achieving a masking effect threshold of 7 or higher, and the engine power requirement necessary to achieve a noticeable masking effect has been established. Based on the vehicle’s acceleration demand power, along with considerations of engine power and loss power, we can determine the required battery output power under an acceleration condition of 2 m/s with a subjective score of 7 points for masking. Table 5 details the postrestriction power allocation among vehicular subsystems under acceleration conditions following engine power constraint implementation, which demonstrates that it meets the criteria for achieving a masking effect sufficient to reach a score of 7 points.
| Vehicle speed (km·h−1) | Vehicle acceleration power (kW) | Engine power (kW) | Loss power (kW) | Battery power (kW) |
|---|---|---|---|---|
| 10 | 16.2 | 0 | 17.0 | 33.2 |
| 20 | 32.5 | 0 | 18.6 | 51.1 |
| 30 | 49.1 | 0 | 20.2 | 69.3 |
| 40 | 65.9 | 15 | 21.8 | 72.7 |
| 50 | 83.1 | 20 | 23.4 | 86.5 |
| 60 | 100.8 | 25 | 25.0 | 100.8 |
| 70 | 119.0 | 40 | 26.6 | 105.6 |
| 80 | 138.0 | 45 | 28.2 | 121.2 |
| 90 | 157.7 | 55 | 29.8 | 132.5 |
| 100 | 178.2 | 80 | 31.4 | 129.6 |
| 110 | 199.8 | 85 | 33.0 | 147.8 |
| 120 | 222.4 | 100 | 34.6 | 157.0 |
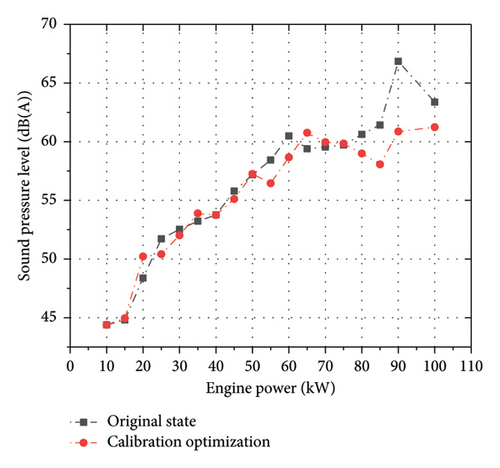
Figure 5 illustrates that engine noise is particularly pronounced in the power range of 50 kW–60 kW, as well as above 80 kW. By leveraging the power distribution data provided in Table 5, the calibration strategy is mainly achieved by adjusting the engine operating curve, limiting the output power at a specific vehicle speed, reducing engine noise, and enhancing the masking effect of background noise. On the other hand, the masking effect can also be improved by reducing engine noise by adjusting the engine running line at constant engine power. The resulting engine noise levels are illustrated in Figure 12. In the power range of 50–60 kW and above 80 kW, the improvement of noise is remarkable. During the process of sudden acceleration, the power output of the engine is relatively high. Therefore, it can effectively enhance the in-vehicle noise level under the sudden acceleration working condition, demonstrating the validity of this method. The relevant conclusions can be applied in project development to optimize the NVH level of the entire vehicle.
Conflicts of Interest
The authors declare no conflicts of interest.
Funding
The authors state that no funding was received.
Open Research
Data Availability Statement
The data that support the findings of this study are available on request from the corresponding author. The data are not publicly available due to privacy or ethical restrictions.


