Fault Diagnosis of Traction Motor Bearings Based on Shifted Rank-1 Reconstruction
Abstract
Rolling bearings are one of the important components of rotating machinery, and effective bearing fault diagnosis is a necessary condition to ensure the normal operation of mechanical systems. In the rolling bearing operation process, the working conditions are usually harsh, and the sensor for collecting signals is usually placed on the outer surface of the mechanical system, resulting in the signal collected by the sensor eventually containing various interference components, increasing the difficulty of fault identification. Therefore, traditional bearing fault diagnosis methods make it difficult to detect periodic transient features from the signal spectrum. The traditional trajectory matrix with singular value decomposition (SVD) method cannot effectively diagnose the weak fault characteristics of bearings, which means that it is difficult to retain effective singular components. Therefore, a new singular value decomposition method based on shift rank-1 matrix is proposed. To begin, generate the trajectory matrix using an approximation of the traversal segment length. The built approximation matrix is then approximated using a shift vector in order to produce a strict rank-1 matrix, which is achieved by optimizing λ in low-rank matrices. Through the singular values of the shift matrix, the fault impact signal may ultimately be reconstructed. Comparative analysis was conducted between the suggested technique and other approaches via quantitative and qualitative evaluation of the algorithm’s performance on simulated and experimental data. In spite of severe background noise (−20 dB), the findings demonstrate that this approach can still recover fault impact signals without requiring a fixed traversal segment length.
1. Introduction
The comprehensive effect of factors such as load, speed, and temperature borne by rolling bearings during operation directly affects the lifespan and performance of bearings. The majority of mechanical failures are caused by bearing failure, and the pace at which a bearing deteriorates increases as damage occurs [1, 2]. Consequently, early bearing fault identification is essential, which can timely avoid economic losses and personal safety accidents caused by severe bearing failures [3, 4]. However, the early weak fault characteristics of bearings will be submerged by harmonic interference and environmental noise caused by imbalance, un-calibration, and mechanical looseness [5–8], making early faults difficult to detect and diagnose. Rolling components come in a variety of forms, including balls, cylindrical rollers, needle rollers, conical rollers, and spherical rollers. Rolling bearings primarily consist of structures like inner rings, outer rings, rolling bodies, and cages [9]. When local faults occur in rolling bearings (such as cracks, small holes, pits, or missing surface materials), vibration pulse signals are generated when the ball passes through the defect. Pulse signals contain many faults in the information that must be extracted. On the contrary, it is common for vibration pulse signals to be accompanied by harmonic components, background noise, amplitude modulation, and frequency modulation signals. Moreover, bearing vibration pulse signals are often nonlinear and nonstationary, with pulse components that are typically too faint to differentiate. Therefore, detecting pulse signals for fault diagnosis under high noise and strong harmonic interference remains a challenge [10–13].
In recent decades, a wide range of signal processing methods have been created with the dual purpose of reducing noise and extracting bearing failure signal features, including Short Time Fourier transform (STFT) [14], discrete wavelet transform (DWT) [15], empirical mode decomposition (EMD) [16], variational mode decomposition (VMD) [17], spectral kurtosis (SK) [18], minimum entropy deconvolution (MED) [19], Stochastic resonance [20] and singular value decomposition (SVD) [21]. One of the drawbacks of STFT is its fixed time-frequency resolution; DWT requires predetermined wavelet basis functions and decomposition levels, lacking adaptability; EMD has the capability to deconstruct the signal adaptively into a sequence of intrinsic mode functions, which unveil the signal’s fundamental nature, by using its local scale properties. However, EMD has problems such as mode mixing and over envelope; VMD can effectively suppress modal aliasing, but the number of modal decompositions configured influences the signal decomposition performance of the VMD approach. MED processes the signal with the kurtosis maximum as the objective function, which can improve the pulse property of the signal. Ke et al. [22] proposed a bandwidth selection scheme based on the Vold–Kalman filter to ensure the reliability of fault diagnosis for offshore wind turbine operating condition monitoring. Qing et al. [23] established a parallel dual-channel residual learning architecture that can automatically extract bearing fault features to integrate bearing fault features. However, when the fault signal is relatively weak and the bearing fault signal is a periodic pulse, effective extraction is not possible using merely the pulse feature. Consequently, nonadaptive signal processing approaches encounter challenges in attaining appropriate outcomes when analyzing actual information.
Extracting pulse features under background noise and nonstationary conditions has become a challenge [24]. Among them, SVD, as an effective nonlinear filtering method, is widely used in mechanical fault diagnosis. The SVD approach is capable of identifying weak eigenmodes concealed within a signal and attenuating noise with varying distributions without requiring a predefined basis function. Notwithstanding the effective use of SVD in bearing fault identification, several concerns persist that need more attention. Firstly, the performance of SVD mainly depends on the selection of traversal length. However, currently, the embedding dimensions are mostly selected based on experience and have poor adaptability, which affects the application of SVD in bearing diagnosis [12, 25, 26].
Li et al. [27] proposed a correlation SVD (C-SVD) method, used envelope kurtosis as an index, studied the optimal structure of the Hankel matrix (number of rows and number of columns), discussed the number of data points of the analysis signal and gave the constraint range. The problems of low singular value aggregation of the Hankel matrix in the SVD method and a large amount of noise in the reconstructed signal are solved; In order to mitigate the effects of harmonics and noise components, Sun et al. [28] presented a dictionary-based data-driven detection technique that combines K-clustering and SVD (K-SVD) to reliably identify pulse components. Nevertheless, it is simple to produce incomplete vibration morphology during the truncation process, which differs from the vibration waveform’s structure and might make it difficult to precisely identify and successfully extract impact components. The fundamental principle behind the SVD-based background noise reduction approach is to generate a matrix with rank-1 and use SVD to identify the greatest singular value, which may be used to construct a fault impulse signal. On the other hand, the traversal period determines the matrix’s rank throughout the trajectory matrix generation process. Typically, the embedding dimension for the traversal length in these contemporary SVD-based algorithms is determined by the characteristic of the input signal, such as the average period of the fault vibration signal. Subsequently, the trajectory matrix is built [29]. To reduce the influence of traversal segment length on the performance of fault impact signal reconstruction and ensure that the resulting trajectory matrix is a strict rank-1 matrix, this is what was done. A shift rank-1 reconstruction (SR1)-based fault impact extraction technique is put forward. Initially, an approximation of λ is carried out and an iteration is initiated for the reconstructed signal following preprocessing, given an arbitrary or approximate traversal segment length. According to this calculated λ, the phase of the matrix and the offset are updated by the offset vector, and the global optimization is carried out in order to determine the maximal left singular vector as well as the global amplitude. By combining the phase of the offset with the global amplitude, the trajectory matrix of the SVD is created, and all potential offsets are updated through local optimization. The reconstruction of the shift rank matrix, which enables the shift operator to compel the creation of the rank-1 matrix while preserving the length of the pre-calculated traversal segment, is the method’s core. By doing so, the performance and robustness of the approach are enhanced, and the influence of the traversal segment length on the reconstruction of the impact signal is reduced. Through simulation and test bench studies, the efficacy of the shift rank-1 building matrix technique has been validated, and it has been contrasted with other methodologies. Simultaneous quantitative and qualitative analysis is conducted, and the impact of traversal segment length on the efficiency of shock information extraction is examined.
2. Algorithm Model
2.1. Scale Space Preprocessing
In the formula: ∗ represents convolution; δ is the scale parameter.
In the formula: m is the discrete point in the scale space; N is the eigenvalues of the kernel function; L is the wide window of the kernel function, usually taken as (3 ≤ a ≤ 6, but to ensure that the approximate error of the Gaussian kernel function during discretization is less than 10−9, a = 6 is generally set).
In the equation, ‖x‖1 represents the L1 norm of signal x; N is the length of the signal. The stronger the periodic pulse of the real signal x in the frequency domain, the larger the corresponding indicator value G.
2.2. Shift Rank-1 Matrix
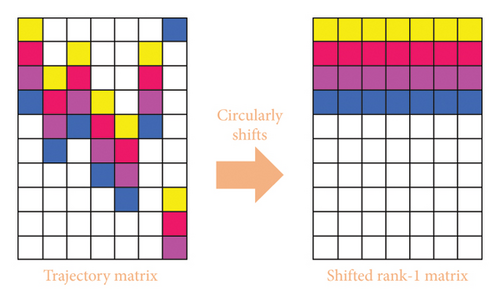
The shift operator Sλ is linear, and the inverse operator is obtained by . This operator maintains the integrity of the norm, . Given , can be obtained. If A = Sλ(uv∗), , , , then is called a shift rank-1 matrix [31].
The SR1-SVD technique demonstration indicates that the resultant matrix may be shifted into a strictly rank-1 matrix by using a shift vector. From Figure 1, the discovered original periodic components have been seen to have been moved to various rows. These elements are shifted collectively to create a rigorous rank-1 matrix following the shift rank-1 approximation. Consequently, erroneous components and noise effects may be minimized when reconstructing vibration signals using singular values, in addition to allowing unambiguous fault impact signals to be rebuilt based on singular values.
2.3. Reconfiguration λ
As the element-by-element product of each column of a vector and matrix. Define and set b1 as its first line. Then (13) can be written to find the maximum of B − 1b1. Repeat this process until you end up with a local maximum. Since there are only a limited number of possible values for λ, this outcome is definitely attained after a limited number of steps.
2.4. Application of Shift Rank-1 Algorithm in Extracting Fault Information From Vibration Signals
- •
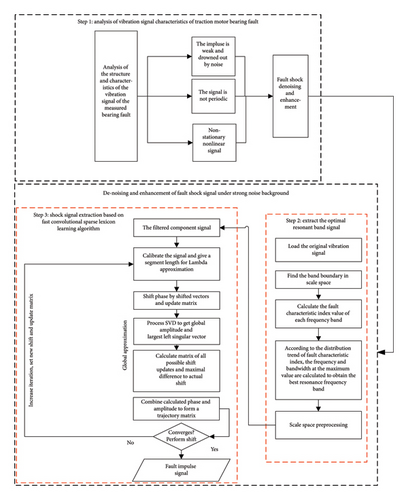
Step 1: The input vibration signal is analyzed and calculated the fault frequencies based on bearing’s types(diameters and rotating speeds, etc.), then distinguish the vibration impulse whether be drown or disturbed by background noise, and also judge this signal is periodic or not.
- •
Step 2: After those processes above, signal enhancements have carried out and preprocess applied by scale-space method to enhance periodic parts of fault signals. The scale-space method contains two substeps, finding the frequency boundary and the maximum characteristics index to locate the best vibration resonance which fully contained the fault information for de-noising.
- •
Step 3: According to the output signals in Step 2, the proposed SR1-SVD method is applied. Firstly, in order to find the periodic impulse in signals, a trajectory matrix I produced by using the acquired phase and amplitude information, after which the shift vector is used to calculate the shift phase and updated matrix, as well as the global amplitude and maximum left singular value. Determine whether the matrix is made between the maximum difference between the shift update and the actual shift.
- •
Step 4: We compute the best rank-1 approximation if the matrix is convergent. This rank-1 matrix is used to reconstruct the fault shock signal. If not, proceed with a new estimate of λ, choose a different shift, and update the matrix until convergence is achieved by increasing the number of iterations. Finally, the pure fault signal is reconstructed by SVD which only consists of periodic fault information for bearing fault diagnosis.
3. Method Validation
3.1. Simulated Signal Validation
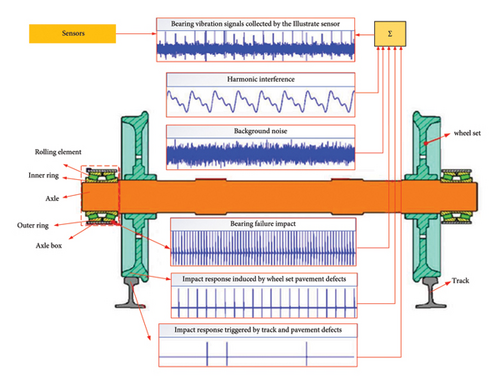
As illustrated in Figure 3, the fault vibration signals received by the sensor end during the actual operation of subway cars may be classified as bearing fault impact signals, harmonic signals, transmission interference signals produced by other component vibrations, and background noise.
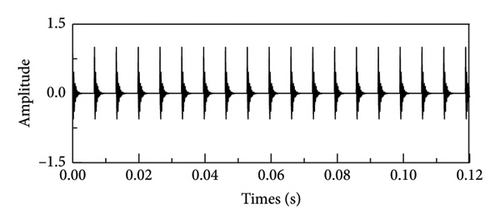
Based on the composition structure and vibration mechanism of the rolling bearings, bearing failures usually occur including the outer ring, inner ring, rolling elements, and cage. Any failures will induce periodic impact excitation, and the frequency of these periodic impacts is the fault characteristic frequency of the bearing, and its determination needs to consider multiple factors such as speed, fault category, and structural parameters of the bearing itself.
In the formula, the fault characteristic frequency is represented by fp, and the amplitude in the signal’s envelope spectrum that corresponds to frequency f is denoted by Y(f). C is the characteristic frequency fp that is involved in the calculation’s greatest harmonic order. Since the amplitude in the envelope spectrum corresponding to the fault characteristic frequency is negligible beyond the sixth harmonic, C is set to 6. The signal-to-noise ratio comparison range is established as −20 to 0 db.
In order to make a credible comparison among all methods mentioned above, the compared methods like Adaptive Periodic Segment Matrix and SVD (APSM-SVD), PSM and SVD (PSM-SVD), Hankel-SVD, MED, SK, VMD, SSA, and DWT are applied under the suitable parameters for best performance. The core of APSM-SVD, PSM-SVD, and Hankel-SVD methods are forming strict rank-1 matrices for achieving better performance. Similarly, VMD and DWT choose the suitable parameters of K, penalty factor alpha and the base of wavelet functions for best performances. Moreover, the parameters in MED and SK are modified, for example, the Entropy function and kurtosis are the essential factors for best performances. All parameters and ways of optimal implementation for compared methods are shown in Table 1.
| Method | The way of optimal implementation | Parameters |
|---|---|---|
| SR1-SVD | Shift vectors lambda to form a strict rank-1 matrix | Automatically iterated |
| APSM-SVD | Segment constraints to form a strict rank-1 matrix | Usually 2/3 lengths of signals |
| PSM-SVD | Signal truncation segments to form a strict rank-1 matrix | Set based on the input signals |
| Hankel-SVD | The diagonal array in formed matrix | Automatically iterated |
| MED | Types and lengths of chosen filters, the entropy function | Formed according to the characteristics of input signals |
| SK | The values of calculated kurtosis | Kurtosis differences between signals |
| VMD | Centre frequencies, parameters mode K and penalty factor alpha | K set as the number of decomposed signals |
| SSA | The calculated singular values | Singular values between signals |
| DWT | Types of wavelet bases | Daubechies wavelet, Meyer wavelet |
The SNR of various approaches is shown in Table 2. It is evident that the reconstructed signal’s SNR rises in tandem with the signal’s SNR. As expected from prior study findings, the SR1-SVD approach has the greatest SNR value, followed by ASM-SVD.
| Method (dB) | SR1-SVD | APSM-SVD | PSM-SVD | Hankel-SVD | MED | SK | VMD | SSA | DWT |
|---|---|---|---|---|---|---|---|---|---|
| SNR = −20 | −18.23 | −19.87 | −29.28 | −25.31 | −23.45 | −22.26 | −19.78 | −28.09 | −21.79 |
| SNR = −15 | −10.11 | −11.96 | −13.14 | −22.14 | −19.39 | −17,39 | −18.56 | −19.51 | −24.07 |
| SNR = −10 | −1.24 | −2.49 | −2.97 | −13.41 | −13.18 | −10.31 | −11.23 | −20.84 | −22.34 |
| SNR = −5 | 1.25 | −0.31 | −0.52 | −6.78 | −2.71 | −4,34 | −3.64 | −1.18 | −13.95 |
| SNR = 0 | 2.68 | 1.72 | 0.55 | −0.52 | −3.24 | 0.39 | −2.59 | −2.55 | −7.01 |
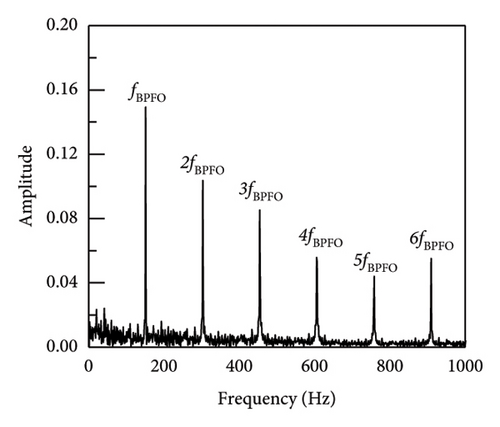
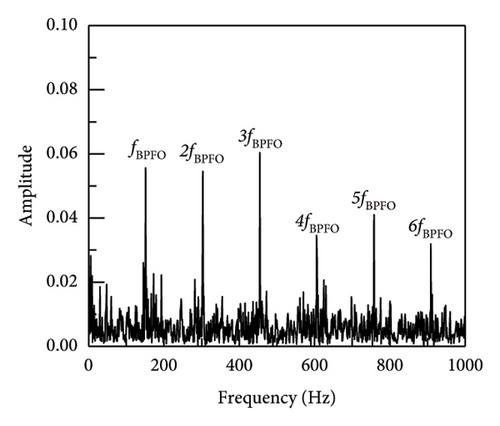
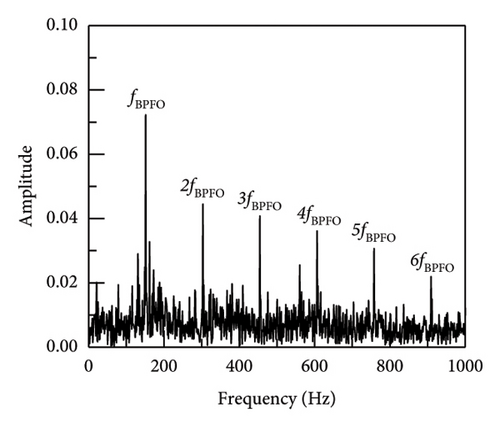
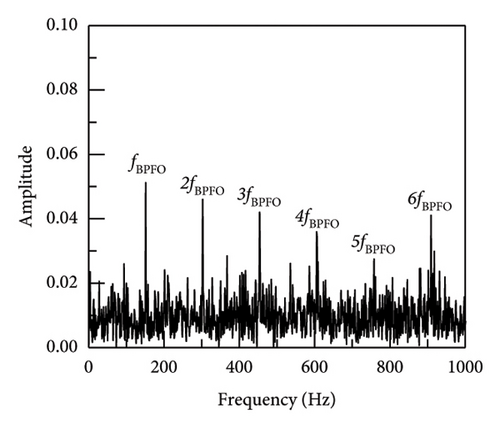
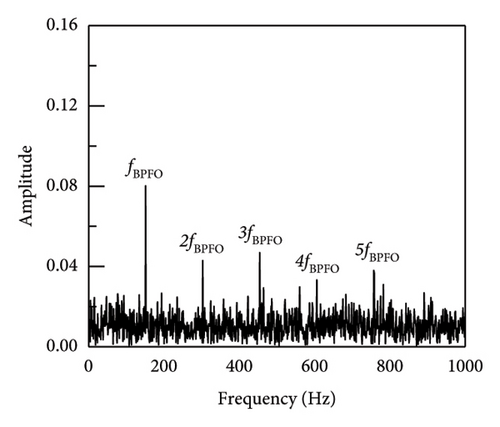
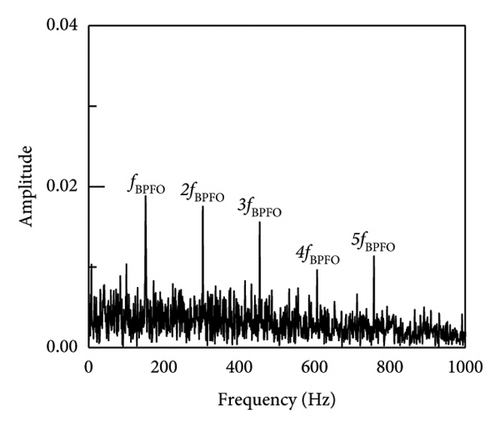
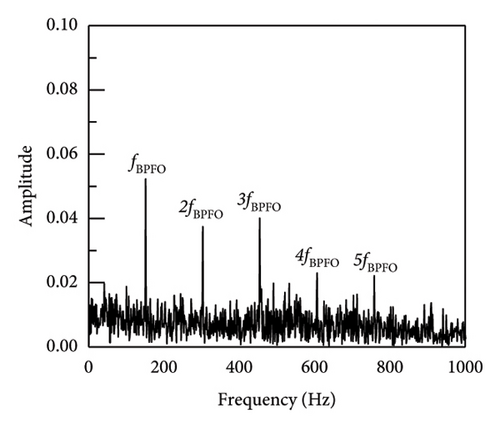
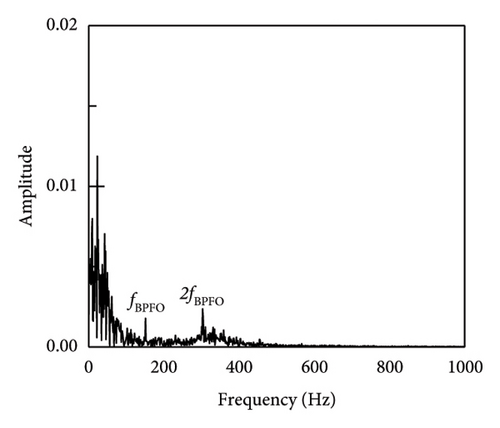
In addition, taking SNR = −10 dB as an example, the envelope spectrum image validation and comparison between SR1-SVD and other methods are shown in Figure 7. The envelope spectrum for the reconstructed impact signal is produced by the implementation of the suggested SR1 approach, as seen in Figure 7(a). The characteristic frequency and multiple frequency components of the outer ring fault can be clearly seen, and there are no other prominent fault characteristic components. The envelope spectrum provides sufficient information to conclude that the bearing is afflicted with an outer ring defect. Simultaneously, methodologies including APSM-SVD, PSM-SVD, Hankel-SVD, MED, SK, VMD, SSA, DWT, and envelope analysis were used to evaluate the outcomes of the proposed SR1-SVD with the deconstructed recovered signal’s time-domain waveform. From the figure, it can be seen that most methods can identify fault impact signals, and find fault characteristic frequencies and their multiples. Firstly, Figures 7(b), 7(c), and 7(d) show the extraction of impact signals using APSM-SVD and PSM-SVD for vibration signals. Additionally, it is evident that 2–6 octaves and the distinctive frequency of the outer ring fault are visible. In contrast to (a), (b), (c), and (d) provide additional information on noise, with interference information located on the left side of the fourth octave in case of (c). The results of MED, SK, VMD, SSA, and DWT indicate that a substantial quantity of noise interference persists in the reconstructed impact signal, and the fault information extraction is insufficient, hence impeding the extraction of the impact components. Consequently, the SR1-SVD suggested in this paper is more effective in removing noise and extracting impact components. When compared to alternative techniques, the reliability of defect detection and diagnosis is improved by the clear and succinct envelope spectral lines of periodic impact signals that have been extracted.
3.2. Experimental Data Analysis
The suggested approach is experimentally verified using the wheel-bearing testing platform depicted in Figure 8. The components of the experimental test bench include a gearbox, collector, rail wheelset, loading apparatus, motor, driving wheels, and analysis laptop. At varying motor speeds and via rubber belts, the motor imparts driving power to the driving wheels, which then transfer traction force to the test wheelset. The experimental double-row tapered roller bearing exhibited an outer ring defect, which was manually positioned and had three piercing wounds on its surface (Figure 8).
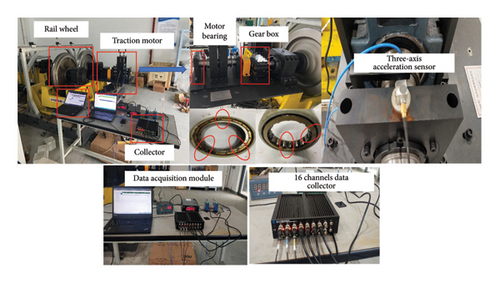
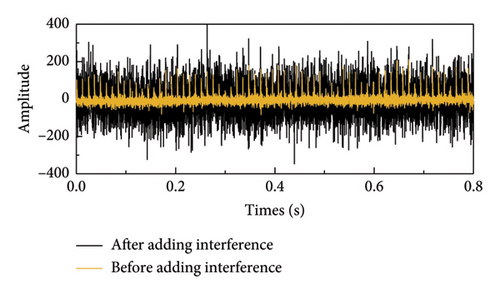
All the details of vibration acceleration sensors are shown in Table 3. The experiment uses the 1A110E three-axis acceleration sensor, which is magnetically attached to the drive ends of the motor. The HD2001 16-channels data collector is used to record the bearing vibration signal, with a sampling frequency set to 10 kHz and continuous recording of data for 30 s. The bearing speed is set to 540 r/min. A wheelset rotation frequency of 10.28 Hz. Table 4 displays the characteristics and fault characteristic frequencies of the experimental bearing. For a more comprehensive evaluation of the effectiveness of this method in acquiring early failure information of motor bearings against loud noise environments, harmonic interference, impulse response, and Gaussian white noise with a signal-to-noise ratio of −10 dB are added to the vibration signal.
| Channel | Sensor | Sensitivity mv/(m ∗ s−2) | Installation placement | Precision (g) |
|---|---|---|---|---|
| X | 1A110E | 4.998 | Longitudinal close to the drive end | 100 |
| Y | 1A110E | 4.998 | Horizontal close to the drive end | 100 |
| Z | 1A110E | 4.998 | Vertical close to the drive end | 100 |
| fBPFO | fBSF | Rolling diameter (mm) | Number of rolls | Pitch diameter (mm) | Contact angle |
|---|---|---|---|---|---|
| 83.23 Hz | 33.65 Hz | 26.9 | 19 | 180 | π/20° |
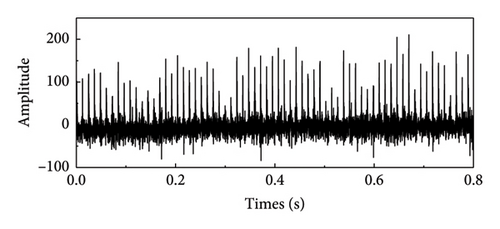
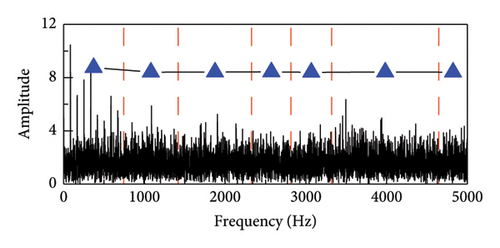
Before interference is introduced, the orange time domain waveform of the interference vibration signal is seen in Figure 9. The impact component is obviously obscured by white Gaussian noise and other information, which complicates the process of determining its regularity and extracting pertinent data. Figures 10 and 11 illustrate the time domain after scale space preprocessing and the denoised fault signal envelope spectrum. Defect feature detection is a complex task due to the difficulty in detecting frequency conversion and other forms of feature doubling. Even when the distinctive frequency is apparent, it is surrounded by considerable noise interference spectral lines.
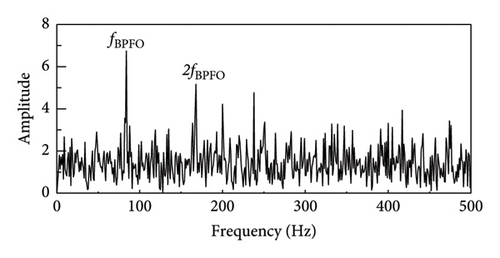
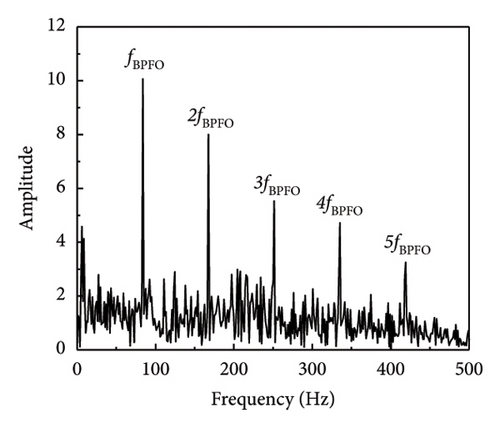
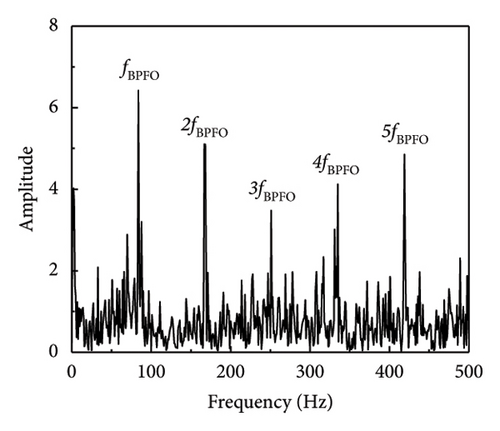
As demonstrated in Figure 12, the study’s proposed SR1-SVD and other techniques discovered the effectiveness of SR1-SVD, APSM-SVD, and PSM-SVD in extracting fault pulse information from vibration signals through reconstructed signals retrieval, as well as generating their envelope spectrum. On the other hand, the PSM-SVD approach has some interference impulse information, while the envelope spectrum of the SR1-SVD method has cleaner fault impulse information. With no additional fault feature components, the approach utilized in this article fully extracts fault information from the signal while avoiding interference signals. Consequently, in situations with high levels of noise, the technique described in this article can be used to obtain early defect information for vehicle motor bearings.
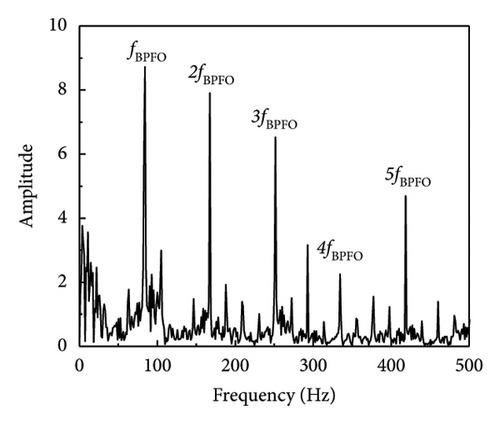
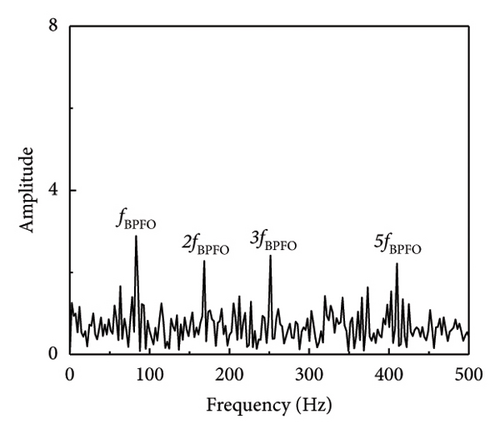
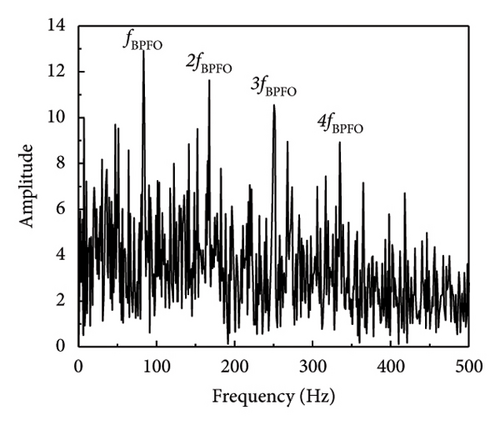
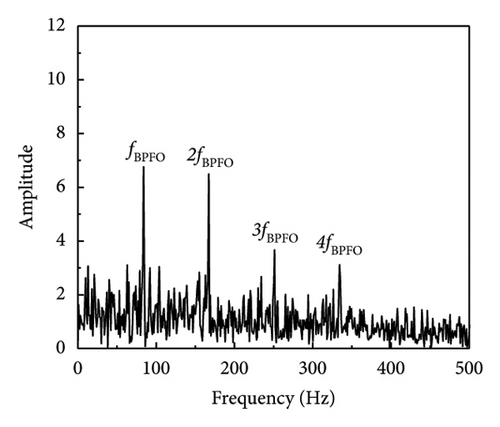
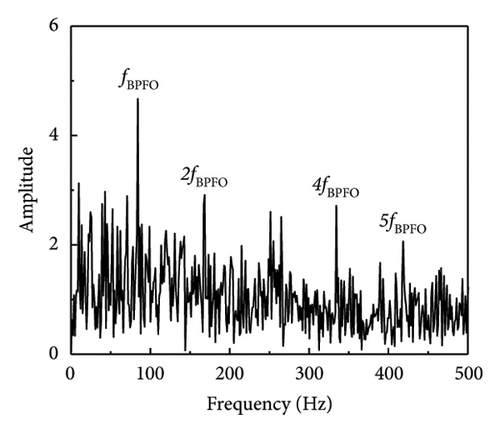
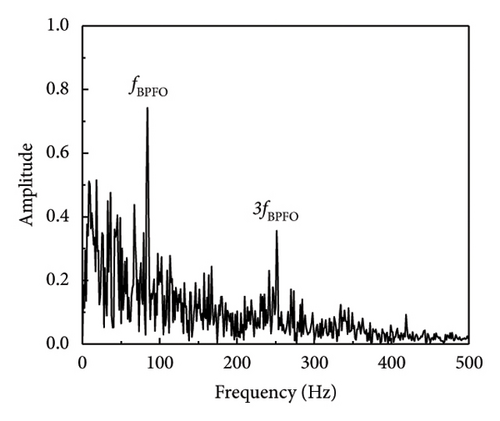
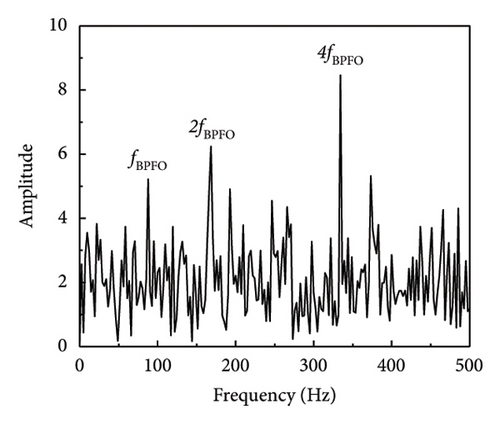
In a similar fashion, the envelope spectrum signal-to-noise ratio of the experimental signal on the test bench is computed using equation (17), which is used to evaluate the efficacy of the defect feature information extraction approach suggested in this article. The SNR derived from the envelope spectrum of the fault characteristic frequency is determined to be −18.79 dB by analysis of the envelope spectrum of the original signal (SNR = −10 dB) (when SNR = −15 dB, the envelope spectrum SNR is −23.95 dB). As shown in Table 5 and Figure 13, the processing results of each approach are calculated using the envelope spectrum-based signal-to-noise ratio, which spans the range of −20 to 0 dB. The table illustrates that the approach suggested in this article effectively distinguishes between fault impact components that are entirely enveloped in noise and the noisy vibration signal.
| Method (dB) | SR1-SVD | APSM-SVD | PSM-SVD | Hankel-SVD | MED | SK | VMD | SSA | DWT |
|---|---|---|---|---|---|---|---|---|---|
| SNR = −20 | −22.31 | −24.90 | −26.66 | −23.57 | −24.87 | −24.16 | −23.91 | −25.79 | −29.81 |
| SNR = −15 | −12.28 | −13.64 | −15.96 | −14.19 | −19.75 | −19.91 | −17.74 | −18.16 | −22.62 |
| SNR = −10 | −3.28 | −4.32 | −8.13 | −13.61 | −10.51 | −11.89 | −11.09 | −10.58 | −13.42 |
| SNR = −5 | −0.78 | −0.84 | −2.15 | −13.56 | −4.34 | −5.04 | −5.13 | −4.76 | −8.94 |
| SNR = 0 | −0.19 | −0.69 | −0.82 | −6.48 | −1.70 | −1.94 | −2.09 | −6.51 | −5.76 |
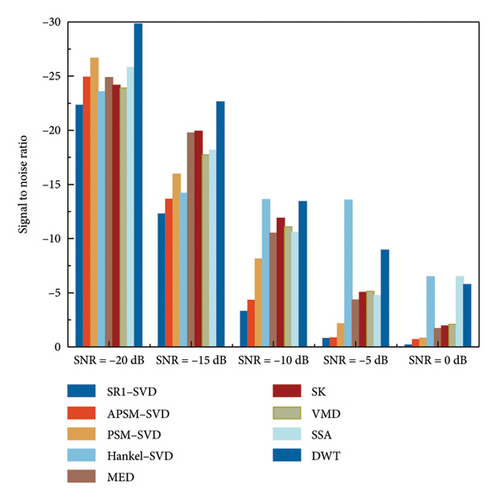
As a result, by using SR1-SVD to analyze fault signals, vibration signals’ noise interference may be greatly reduced, and their evident fault impact components can be distinguished from one another. The signal noise removal method based on SVD performs better than VMD and DWT in fault impulse signal reconstruction. Because the purpose of these methods based on SVD is to construct a strict first-order trajectory matrix to reconstruct the shock signal, rather than decompose the vibration signal. In contrast to other matrices created using SVD, the trajectory matrix created in this research is a pure rank-1 matrix. After using SVD, the rebuilt signal will either produce spurious components or lack fault information. Furthermore, SSA did not minimize noise or provide a rigorous rank-1 trajectory matrix. There would be additional components in the envelope spectrum. VMD requires selecting appropriate K and α values, while DWT requires selecting appropriate wavelet basis functions and adjusting parameters, otherwise accurate fundamental and octave relationships cannot be obtained.
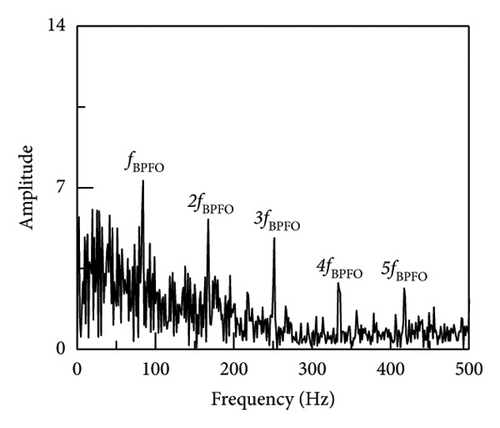
By 20-fold amplification of the noise data acquired from the bogie during a particular line operation and subsequent addition to the vibration signal of the bench test, the efficacy of the model in discerning fault impacts caused by the dynamic response of other components in the measured signals during subway train operation could be more precisely validated. The findings are shown in Figure 14.
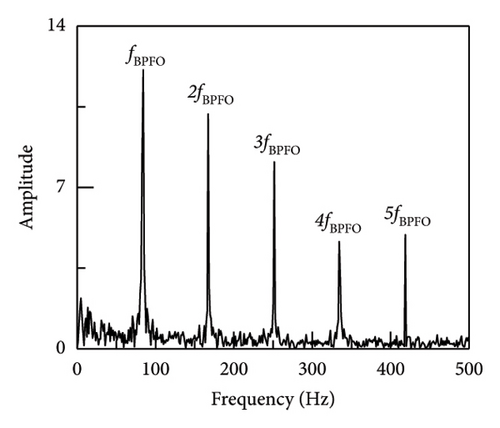
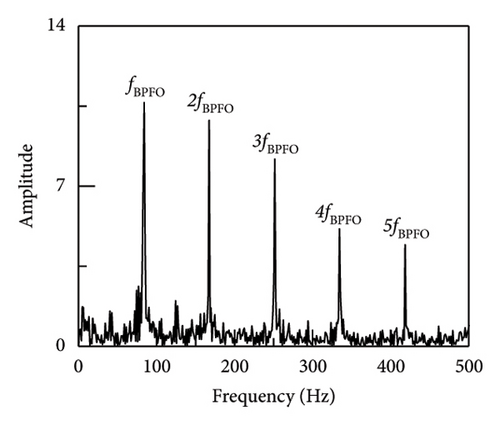
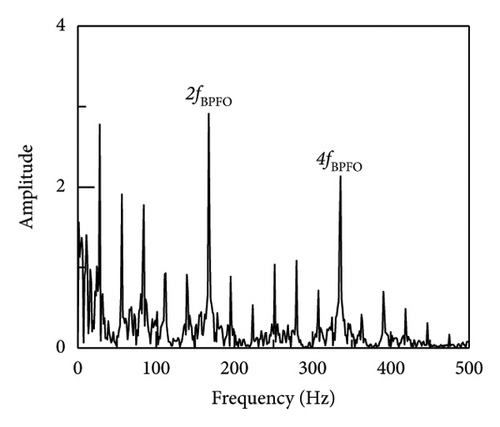
The envelope spectrum fault impulse peak of the SR1-SVD approach is the highest, as shown in the picture; the signal-to-noise ratio of the two envelope spectra is computed using the given equation (17). Among the three methods that can also extract fault impulse, SR1-SVD is more optimal. In addition, amplify the vibration data of the bogie by 40 times and add it to the vibration signal of the bench test. At this time, the noise of the bogie is the main information to verify the denoising ability of SR1-SVD and the ability to extract fault impact information, as shown in Figure 15. The figure reveals that SR1-SVD is capable of extracting the fundamental frequency and a range of 2–5 octaves. In contrast, APSM-SVD and PSM-SVD are only able to detect the fundamental frequency and 2 octaves. As a result, the efficacy of the strategy suggested in this article for extracting fault effects from backgrounds with high levels of noise has been shown.
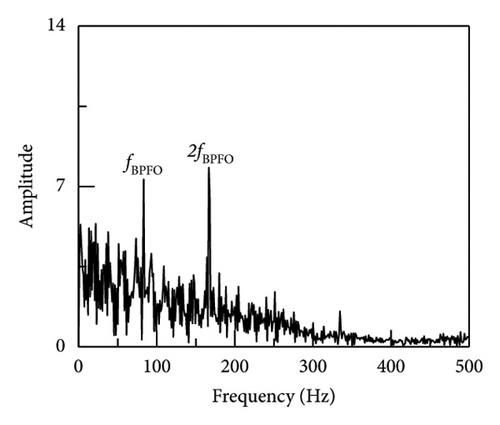
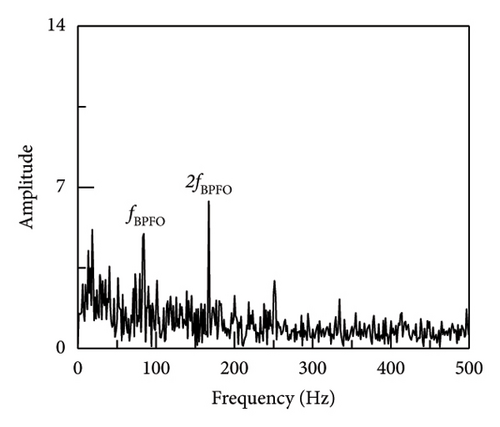
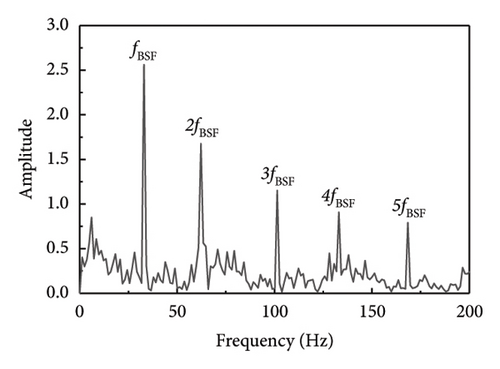
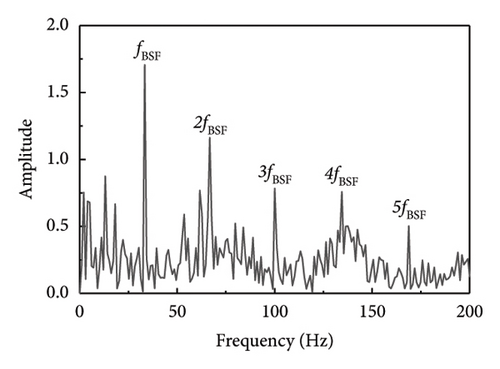
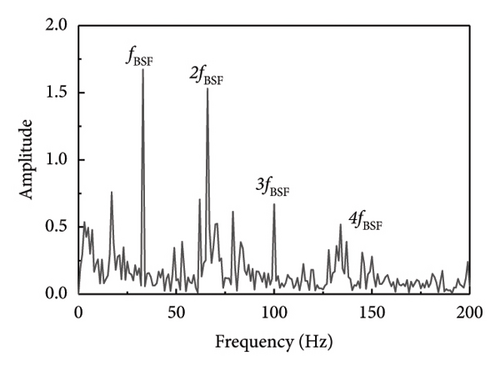
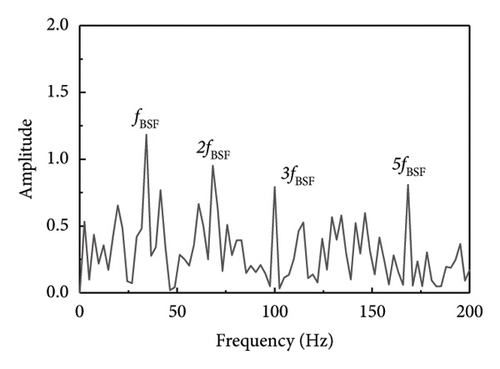
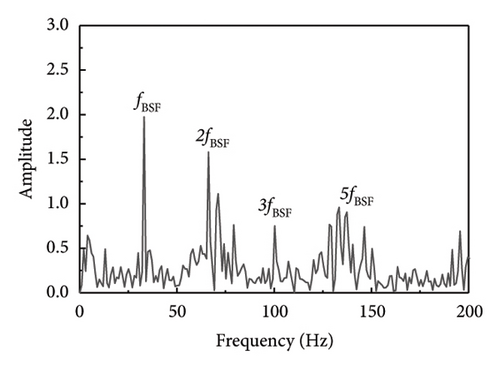
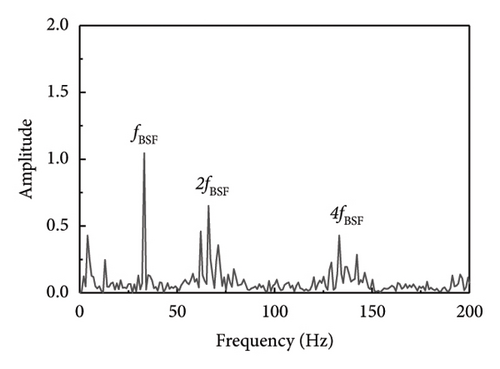
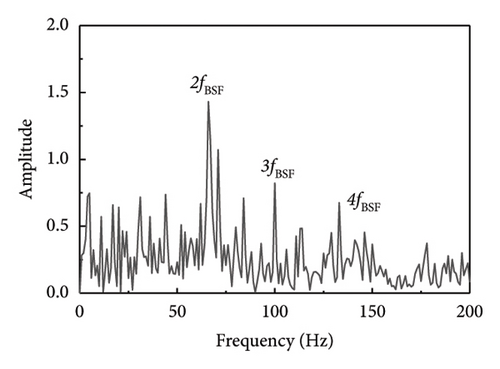
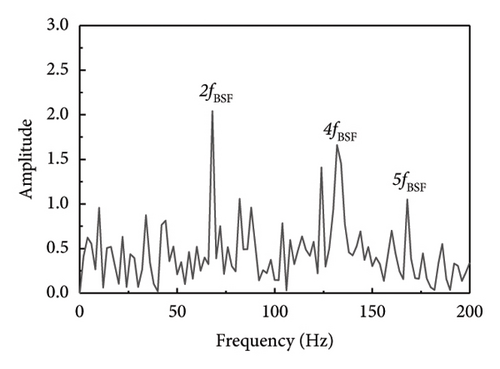
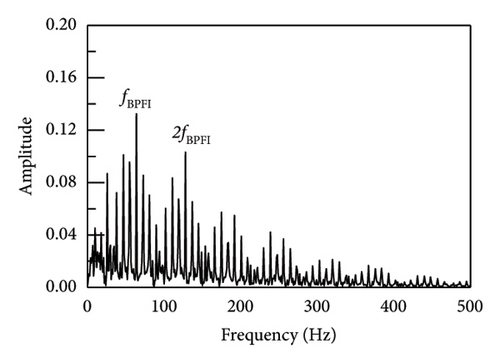
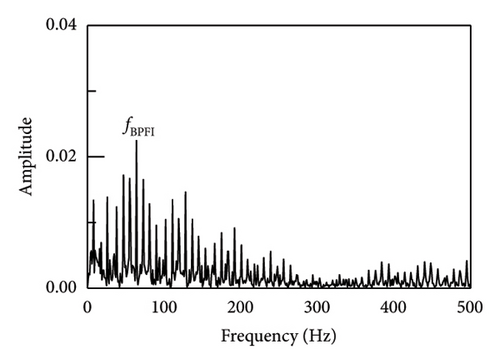
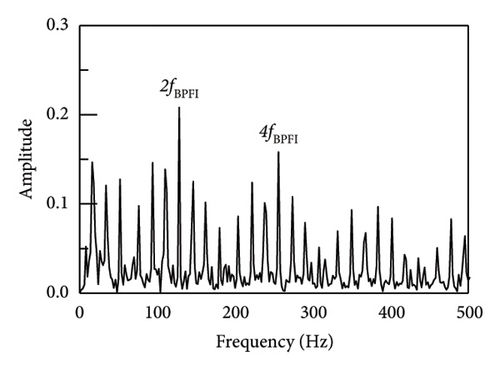
Other types of faulty bearings should also be considered for bearing fault diagnosis, where the main variations among faults are based on their frequency characteristics. As a result, this methodology may also be used to identify defects in the rolling components and inner ring of the bearings. As seen in Figure 16, fault shock data was derived from the rolling element fault vibration signals acquired during the bearing bench test by using several methodologies, including the proposed method SR1-SVD. It is evident from Figure 16 that the fault type can be identified through the fault characteristic frequency and frequency doubling of the rolling element as presented in Table 6.

| fBPFI | Rolling diameter (mm) | Number of rolls | Pitch diameter (mm) | Contact angle α/(°) |
|---|---|---|---|---|
| 64 Hz | 13.49 | 14 | 125 | 0 |
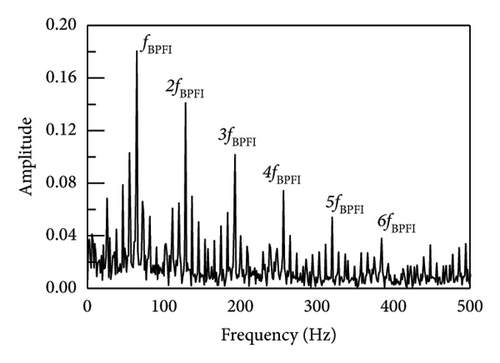
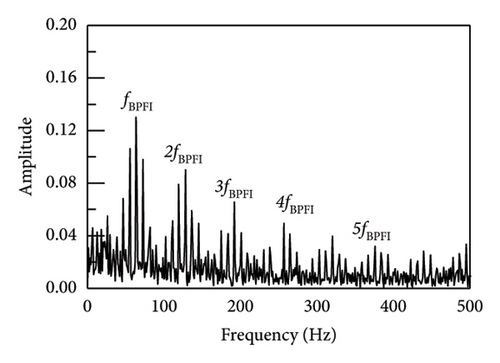
Similarly, in order to assess the precision of the proposed technique for extracting characteristics of faults in the inner rings of bearings, data were collected from inner ring fault bearings on the drive end of the traction motor of a vehicle on a specific test line. The vehicle speed was measured 53 km/h, the sampling frequency was 10 kHz, and the bearing was SKF6016 ball bearing. The parameter data was displayed in Table 4 while the envelope spectrum was depicted in Figure 17. It can be shown that the results of SR1-SVD have better performance and can obtain the fault frequency and its frequency doubling components. Moreover, the average operating speeds of vehicles in metro lines are around 40–80 km/h. According to the fault frequencies equations in equations (17)–(20), the main differences of bearing faults under different speeds are the rotating frequencies which will make the fault characteristics changed. As a result, the identification comparison under different operating speeds has been made by applying SR1-methods. It can be seen from Figure 18, although the fault frequencies changing with operating speeds, the proposed SR1-SVD method still can recognize those fault frequencies and their frequency doubling components. The SR1-SVD method forms a strict rank-1 matrix which represents periodic characteristics of vibration impulses. Once input signals have strong periodic components, the proposed SR1-SVD method can reconstruct these periodic components from others.
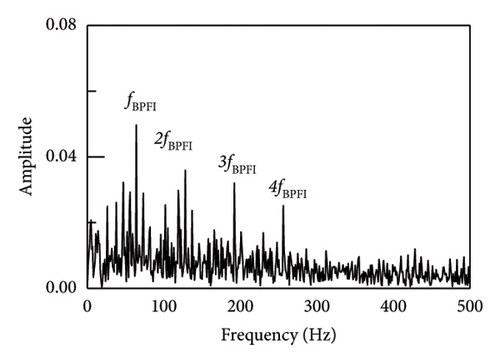
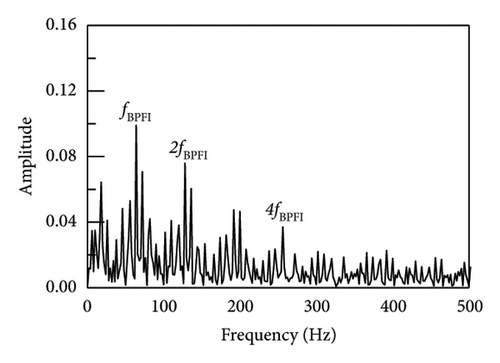
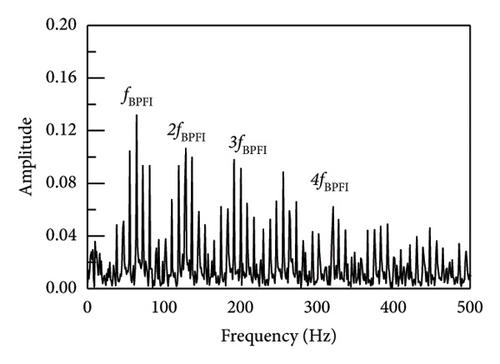
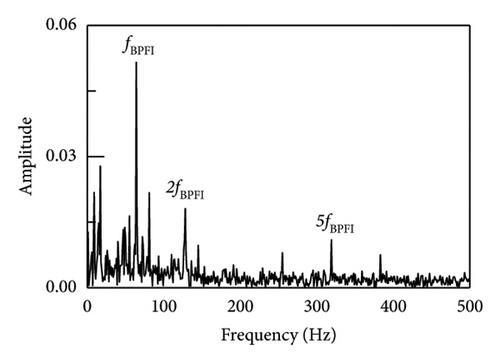
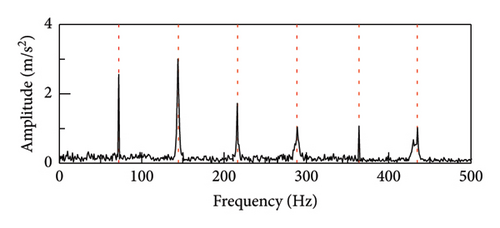
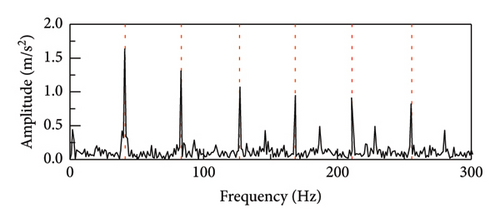
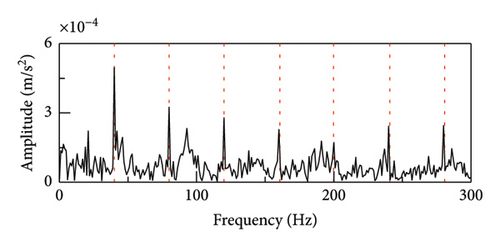
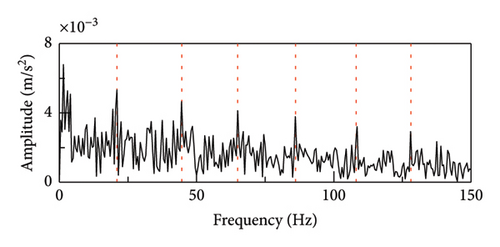
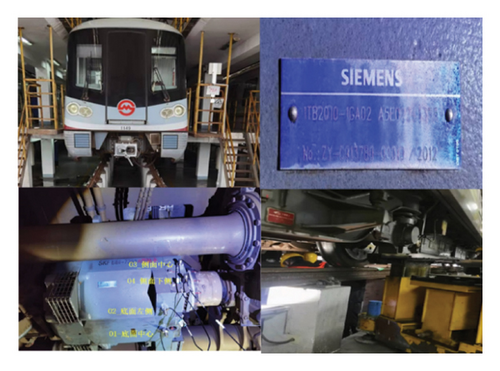
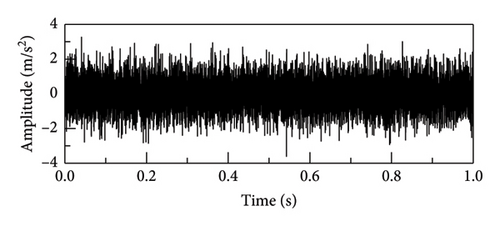
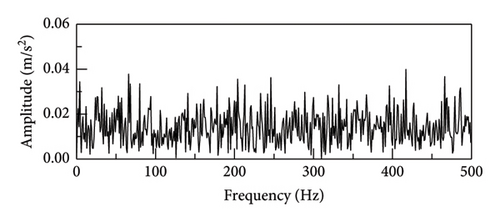
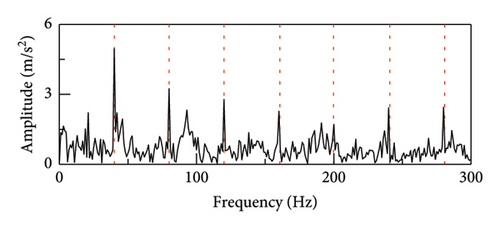
The actual vibration signal is so complex that it cannot be perfectly simulated or emulated. Therefore, in order to verify the true performance of the proposed method, an on-site experiment was carried out and shown in Figure 19. The experiment has been taken on a serviced vehicle consisting of 4 motors and 2 trailers in subway line 3, using a motor model of Siemens 1TB-2010-1GA02. The acceleration vibration signal of motor bearing of the train was collected. The tested vehicle bearing is a deep groove ball bearing, modelled SKF BB1-7361A. The motor speed was set to 720 r/min and the sampling frequency was set to 10 kHz. According to the equation (19), the characteristic frequency of the rolling element fault is 38 Hz.
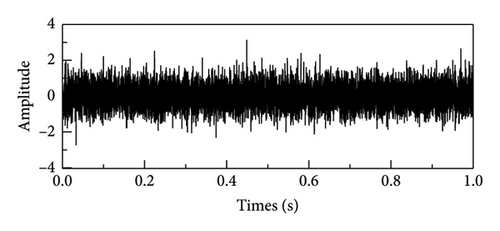
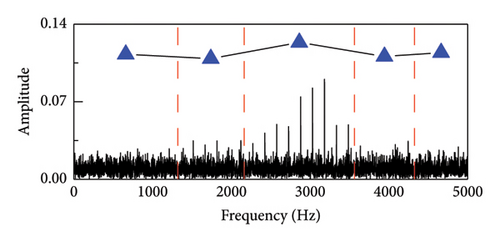
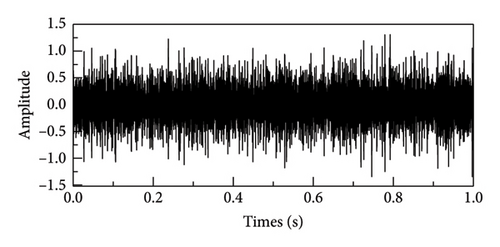
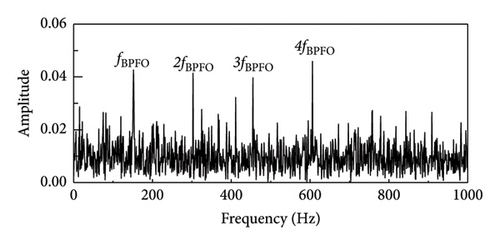
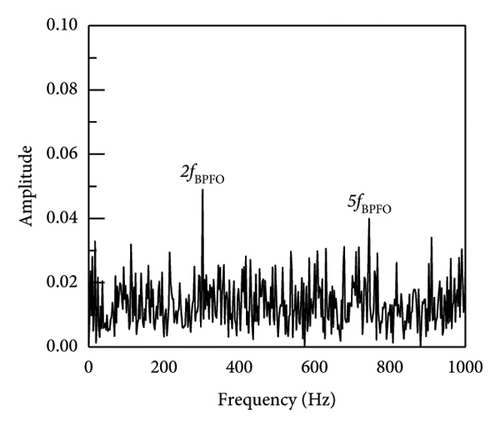
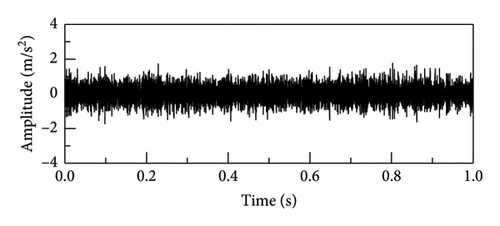
The time-domain waveform and envelope spectrum analysis of the vibration signal is shown in Figures 20 and 21. Time-domain waveform is interfered by a large amount of noise, and the fault impact signal is almost masked by the noise. Due to the influence of noise, the fault characteristic frequency and its harmonics are almost indistinguishable under the envelope spectrum analysis in the raw signal. After processing the proposed SR1-SVD method, it can be clearly seen that the fault characteristic frequency of the bearing and its harmonics indicated that there is a rolling element fault in the bearing.
4. Discussion
In the previous sections, we conducted quantitative and qualitative comparisons on VMD, SSA, DWT, PSMSVD, APSM-SVD, and SR1-SVD, respectively. The findings indicate that the SVD approach outperforms VMD, SSA, and DWT techniques in noise impact removal during experimental data verification. Furthermore, the SR1 method has the most remarkable performance. Critical to the reconstruction of PSM-SVD and APSM-SVD is the development of an appropriate trajectory matrix in order to precisely represent the fault impact section of the vibration signal. Among them, APSM-SVD is based on the periodic characteristics of the vibration signal, and uses the maximum envelope spectrum to calculate the period constraint to detect the peak of the fault pulse in the noise vibration signal. Then, the trajectory matrix is constructed from periodic constraints and pulse peak positions. PSM-SVD uses the singular value ratio spectrum to calculate the embedding dimension and uses the vibration signal to construct the period truncation matrix, and performs the SVD to reconstruct the signal. The length of the traversal segment dictates the appropriate structure of the trajectory matrix. Various traversal lengths may influence the extraction effect of fault impact components. Better noise removal and shock detection can be achieved by selecting an appropriate traversal segment length. This section examines the effects of traversal length on vibration signal processing as affected by the PSM-SVD, APSM-SVD, and SR1-SVD approaches.
Initially, the sampling frequency and the peak’s position in the envelope spectrum may often be used to compute the traversal length. For simulated signals (SNR = −10 dB), 66 is the ideal traversal segment length. Figure 22 shows how effective methods like APSM-SVD and PSM-SVD are in removing noise and restoring fault impact peaks when the traversal segment is set to 66. However, there is still noise information and impulse interference in the reconstructed signal envelope spectrum of APSM-SVD and PSM-SVD.
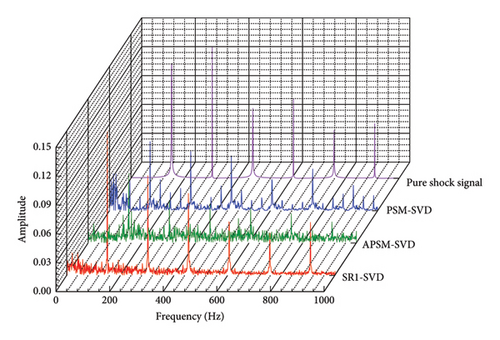
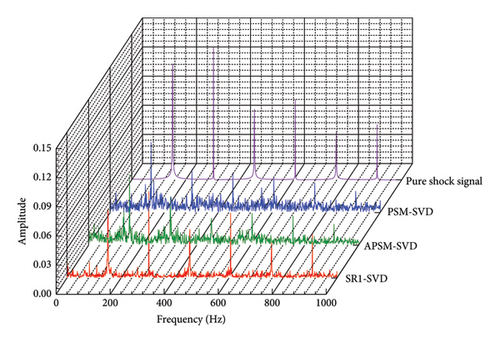
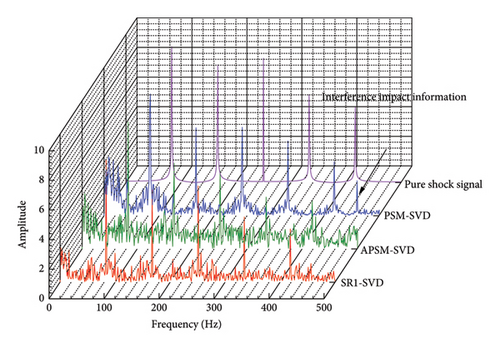
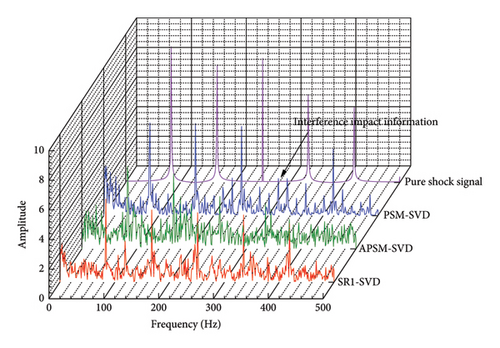
Moreover, the magnitude of fault effect peaks generated using APSM-SVD and PSM-SVD is reduced in comparison to peaks generated using SR1-SVD. Reconstructed impact signal envelope spectrum using APSM-SVD and PSMSVD remains contaminated with impact interference and noise if the traversal segment length is not equal to 66. The suggested SR1-SVD approach is capable of reconstructing fault impact signals irrespective of the suitability of the traversal segment length among these comparative methods. The optimum traversal segment length for the vibration signal of the laboratory single is 120, Figure 23, which is consistent with the simulation signal calculation findings in Figure 18. Both APSM-SVD and PSM-SVD exhibit enhanced capability in reconstructing fault impact signals when the length of the traversal segment approaches 120. Nevertheless, unlike pure vibration signals, the effects of interference persist. In APSM-SVD and PSMSVD, interference prevents the envelope spectrum of the reconstructed impulse signal from differentiating between the 5th and 4th harmonics when the traversal segment length is not equal to 120. However, it has been proposed that alone the SR1 method is capable of extracting purer vibration and shock signals, and from envelope spectrum fault shock peaks.
- •
O (1): Constant time and memory, indicating that the time and memory usage of the algorithm does not change with the increase of input data volume. For example, an algorithm that only uses a fixed number of variables.
- •
O (n): Linear time and memory, representing that the time and memory usage of the algorithm is proportional to the amount of input data. For example, creating a new array of the same size as the input array.
- •
O (n2): Square time and memory, represents that the time and memory usage of the algorithm is proportional to the square of the input data volume. For example, create a new two-dimensional array of the same size as the input two-dimensional array.
- •
O (logn): Log time and memory indicating that the execution time and memory of the algorithm is proportional to the logarithm of the input data volume. For example, binary search algorithm.
- •
O (nlogn): Linear logarithmic time and memory, indicating that the execution time of the algorithm is proportional to the product of the input data volume and the logarithm of the input data volume. Many efficient sorting algorithms, such as merge sort and quicksort, have this time complexity.
| Signal length | SR1-SVD | APSM-SVD | PSM-SVD | Hankel-SVD | MED | SK | VMD | SSA | DWT |
|---|---|---|---|---|---|---|---|---|---|
| 1000 | 0.16 | 0.33 | 1.05 | 0.57 | 0.63 | 7.19 | 1.93 | 0.29 | 0.20 |
| 5000 | 0.26 | 0.25 | 2.81 | 0.93 | 0.43 | 9.74 | 22.19 | 0.33 | 0.17 |
| 10,000 | 0.44 | 0.24 | 6.33 | 1.27 | 0.72 | 12.01 | 33.23 | 0.62 | 0.30 |
| 20,000 | 0.74 | 2.40 | 11.13 | 4.32 | 2.88 | 11.96 | 58.54 | 0.61 | 0.21 |
| 50,000 | 2.84 | 5.33 | 58.40 | 7.91 | 3.14 | 12.19 | 186.56 | 0.78 | 4.16 |
In this case, the time and memory complexity has been calculated in SR1-SVD, APSM-SVD, PSM-SVD, Hankel-SVD, MED, SK, VMD, SSA, and DWT and the results are shown in Figure 24. The main complexity of SVD based methods is induced by the calculation of singular values and formed matrices, PSM, APSM, and Hankel matrices need traversal input data and formed a periodic matrices with fault impulse information. These steps need more time compared with SR1-SVD. However, SR1-SVD method forms a strict rank-1 matrix via shift vector which costs less time and memory compared with other SVD methods. Apart from SVD methods, the MED method has to calculate the minimum entropy and deconvolution and it need more time and memory. Moreover, when applying the DWT, there needs to choose the wavelet base and process the filter programs which makes more time and memory as amounts of input data increase.
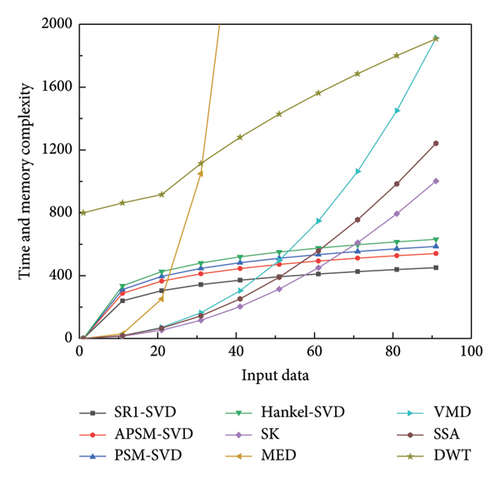
As a result, the proposed SR1-SVD method has the least time and memory complexity among those methods.
5. Conclusions
Qualitative and quantitative comparisons were made with other methods. In accordance with the PSM-SVD concept, the signal is traversed from left to right. Reconstructed signal-to-noise ratios satisfy the necessary criteria only when the traversal segment length is devoid of substantial noise interference. In contrast, the APSM-SVD approach utilizes a distinct trajectory matrix configuration to improve upon the PSM-SVD method. The signal travels from the peak to both ends. If the length of the segment is not appropriate, the reconstructed signal cannot extract fault impact information accurately. In the SR1-SVD approach, λ is utilized to optimize the traversal segment length, resulting in a rank-1 matrix with stringent shift vectors, irrespective of the segment’s length. Consequently, in contrast to other techniques, the SR1-SVD method proposed in this paper performs better in reconstructing impact signals under different traversal segment lengths. The core of the method is the shift rank-1 reconstruction, which shifts the formed trajectory matrix to a strict rank-1 matrix by the shift operator, and forces the formation of the rank-1 matrix without truncating the signal. This reduces the influence of traversal length on the reconstruction of the fault shock signal and improves the robustness and performance of the fault signal removal method. The findings demonstrate that the suggested SR1-SVD approach may improve the reliability of problem detection and diagnosis by extracting clean fault impact signals from vibration signals without the requirement for certain traversal segment lengths. With the progress of intelligence, algorithms, artificial intelligence, and deep learning are being widely used in the industrial field, and the application of deep learning in bearing fault diagnosis is further explored, combining the advantages of big data analysis and neural network models to improve the accuracy and efficiency of fault detection. Secondly, research and development of a more intelligent bearing monitoring system, combined with the Internet of Things technology and cloud computing platform, to achieve real-time monitoring and remote diagnosis of bearing operating status.
Conflicts of Interest
The authors declare no conflicts of interest.
Author Contributions
S.Z. did the conceptualization, project administration and funding acquisition, B.Z. did the validation, formal analysis, investigation, data curation, and writing–original draft preparation. X.C. carried out the software, writing–review and editing and visualization, L.P. did the methodology, Q.Z. and L.W. did resources and supervision.
Funding
This work was supported in part by the National Natural Science Foundation of China (Grant Nos. 51975347 and 51907117) and in part by the Shanghai Science and Technology Program (Grant No. 22010501600).
Open Research
Data Availability Statement
The data that support the findings of this study are available from the corresponding author upon reasonable request.


