Optimization of Coffee (Coffea arabica L.) Husk for Removal of Textile Dye
Abstract
The discharge of textile industry effluents containing synthetic dyes, such as Congo red, poses significant environmental challenges due to their toxicity, persistence, and resistance to conventional treatment methods. Biosorption using agricultural waste–derived materials offers an eco-friendly and cost-effective alternative. This study investigates the potential of coffee husk as a biosorbent for the removal of Congo red dye from aqueous solutions. The biosorbent was characterized using Fourier transform infrared spectroscopy (FTIR), scanning electron microscopy (SEM), and Brunauer–Emmett–Teller (BET) surface area analysis. Adsorption data were analyzed using isotherm and kinetic models, while thermodynamic parameters were calculated. Response surface methodology (RSM) was used to optimize adsorption conditions. The result indicated that the maximum biosorption capacity was recorded as 92 mg/g under optimized conditions. Optimization experiments revealed that adsorption efficiency increased with higher contact time and alkaline pH, while temperature had a lesser influence within the tested range. RSM analysis showed that the highest adsorption occurred at 40°C, pH 10, and 120 min, achieving a removal efficiency of 94%. Comparative analysis with previous studies highlighted the superior performance of coffee husk biosorbents in terms of adsorption capacity and cost-effectiveness. The results underscore the potential of coffee husk as a sustainable solution for wastewater treatment, contributing to the mitigation of water pollution and the promotion of circular economy practices. Future research should explore scale-up possibilities and the regeneration potential of coffee husk biosorbents for industrial applications.
1. Introduction
Water pollution caused by industrial waste, particularly from the textile industry, has become one of the most pressing environmental challenges worldwide. Among the various pollutants released into aquatic systems, synthetic dyes are a significant concern due to their toxic nature, persistence in the environment, and potential to disrupt aquatic ecosystems and harm human health. The textile industry, in particular, is known for discharging large quantities of wastewater containing dyes that are often complex, nonbiodegradable, and highly colored. These dyes, such as those used in cotton, wool, and synthetic fabric coloring processes, can contaminate water sources, making them hazardous for drinking, irrigation, and aquatic life [1, 2]. Among the many synthetic dyes, reactive dyes such as Congo red are widely used because of their ability to form covalent bonds with fibers, making them highly resistant to washing out. However, their strong molecular structure also makes them challenging to remove from wastewater [3].
The environmental impact of dye contamination is severe. Even at low concentrations, synthetic dyes can reduce the penetration of sunlight into water, impairing photosynthesis in aquatic plants and disrupting the oxygen cycle, which is detrimental to aquatic life [4]. Furthermore, many synthetic dyes contain hazardous chemicals such as heavy metals, aromatic amines (NH2), and carcinogens that pose significant health risks to humans and animals, including skin irritation, cancer, and reproductive toxicity [5]. As global water resources become increasingly scarce, the need for effective and affordable wastewater treatment technologies has never been more urgent.
Traditional methods of dye removal, such as chemical oxidation, flocculation, and filtration, have been widely used. However, these techniques often suffer from high operational costs, long processing times, generation of secondary pollutants, and poor efficiency for treating complex dye effluents. Furthermore, many of these methods require harsh chemical treatments that can lead to the production of toxic by-products [6]. As a result, there is a growing shift towards more sustainable and eco-friendly alternatives that not only effectively remove dyes but also minimize environmental harm. One such alternative is biosorption, a process where naturally occurring materials known as biosorbents are used to adsorb or remove pollutants from aqueous solutions. Biosorption has gained attention due to its cost-effectiveness, simplicity, and ability to operate under mild conditions (i.e., ambient temperature and pressure). Unlike traditional chemical treatments, biosorption processes do not generate toxic by-products, making them an attractive option for wastewater treatment [7]. Several biosorbents, including agricultural and industrial waste products, have been explored for their potential to remove dyes from wastewater. Common biosorbents include materials such as algae, fungi, agricultural residues, and wood by-products [8].
The increasing demand for effective, affordable, and environmentally friendly solutions to remove these dyes from wastewater has driven the exploration of biosorption techniques, which utilize natural materials to adsorb pollutants [6]. However, many of the currently available biosorbents, including activated carbon, agricultural by-products, and algae, have limitations such as high cost, low efficiency in dye removal, or poor regeneration potential [4, 7]. While several biosorbents have been investigated for dye removal, coffee husks (Coffea arabica L.) have gained attention as a promising alternative due to their high availability, low cost, and environmental sustainability [9]. Raw coffee husks (RCHs) have demonstrated some capacity for dye adsorption; however, their effectiveness is often limited by the relatively low number of functional groups available for binding with dye molecules [8]. As a result, the biosorption capacity of RCHs can be suboptimal for treating high concentrations of dyes in wastewater [10].
Acid treatment of coffee husk has been proposed as a means to enhance their biosorption properties. Acid modification alters the surface chemistry of the husks by introducing functional groups such as hydroxyl (OH), carboxyl (COOH), and NH2, which significantly improve their affinity for anionic dyes like Congo red [3, 11]. Compared to untreated RCH, acid-treated coffee husks (ATCHs) exhibit a more uniform surface structure, increased surface area, and enhanced dye adsorption capacity (AC) [12]. This modification improves not only the efficiency of dye removal but also the regeneration potential of the biosorbent material, offering a more sustainable solution for long-term wastewater treatment [10].
The uniqueness of the current biosorbent material like ATCH lies in its dual benefits: low-cost, abundant waste material, and it undergoes a simple, environmentally friendly acid treatment that significantly improves its adsorptive properties [12]. This makes it a more efficient and sustainable alternative compared to previous biosorbents, which often suffer from high costs, low adsorption efficiency, or the need for complex treatment processes [6, 7]. Additionally, the use of coffee husks helps address the issue of agricultural waste disposal, providing an eco-friendly solution to both wastewater contamination and waste management [9]. Thus, ATCHs stand out as a novel and promising biosorbent for dye removal, particularly in addressing the urgent need for effective and low-cost wastewater treatment methods. The present study is aimed at investigating the effectiveness of raw and ATCHs as biosorbents for the removal of Congo red dye from aqueous solutions. By evaluating key factors such as pH, contact time, adsorbent dosage, and dye concentration, this research seeks to optimize the conditions for maximum dye removal.
Ultimately, the findings will contribute to the development of low-cost, sustainable, and environmentally friendly methods for addressing the global challenge of water pollution caused by textile dyes. The current study employed advanced characterization techniques, such as Fourier transform infrared spectroscopy (FTIR) and scanning electron microscopy (SEM), to gain insights into the structural and functional properties of coffee husk as well as provide a deeper understanding of the husks’ active sites, surface morphology, and adsorption mechanisms, crucial for optimizing their use as biosorbents.
2. Materials and Method
2.1. Preparation of Biosorbent Material
The study was carried out in the Biotechnology Laboratory of the School of Biological Sciences and Biotechnology, Haramaya University, Ethiopia. Coffee husk was collected from local home processors in Harar City. About 0.5-kg coffee husk sample was cleaned thoroughly, dried at 60°C for 24 h, and ground to a fine powder before use, following the procedure outlined by Ebrahim et al. [13].
To ensure uniformity, the powdered husks were oven-dried at 60°C for 24 h. This step was crucial to remove any residual moisture and enhance the AC of the biosorbent. The dried powder was sieved to obtain a uniform particle size of 75 μm. The resulting material, referred to as powdered coffee husk adsorbent (CHA), was stored in an airtight container to prevent moisture absorption. For 0.5 kg of coffee husk, 2 L of 0.1 M H₂SO₄ was used at 80°C for 2 h. The treated husk was then neutralized with 0.1 M sodium hydroxide (NaOH) and washed with distilled water until a neutral pH was achieved [14]. Both untreated and acid-treated samples of CHA were prepared for subsequent adsorption experiments, aiming at evaluating their efficiency in removing Congo red dye from aqueous solutions [15, 16].
The chemicals used in this study, such as hydrochloric acid (HCl), NaOH, and potassium chloride (KCl), were purchased from Merck.
2.2. Preparation of Adsorbate
Congo red, a widely used anionic azo dye in the textile industry, was selected as the target pollutant for this study. The dye was obtained as a red crystalline powder from Neway PLC, Addis Ababa, Ethiopia, with a molecular weight of 696.68 g/mol. Due to its widespread use in dyeing cotton fabrics and its potential environmental hazards, it was chosen to test the biosorbent’s effectiveness [17].
A 1000 mg/L stock solution of Congo red was prepared by dissolving 1 g of the dye in 1 L of distilled water. From this stock solution, working solutions of varying concentrations were prepared by appropriate dilution. The dye solutions were stored under optimal conditions to ensure their stability and to prevent degradation during the experimental period [18].
2.3. Functional Characterization of Biosorbent Using FTIR Analysis
FTIR was employed to identify the functional groups present in the biosorbent that could facilitate the adsorption of dye molecules. FTIR spectra of the coffee husk, both before and after dye adsorption, were recorded to assess structural and functional changes.
The analysis was conducted using a Bruker Vertex 70 FTIR spectrometer, operating in the 4000–400 cm−1 range. The functional groups, such as OH, COOH, and NH2, play a significant role in the binding process by interacting with the dye molecules. Postadsorption FTIR spectra revealed changes in transmittance intensity and peak positions, indicating the involvement of specific functional groups in the adsorption process [19, 20].
2.4. SEM
To study the surface morphology of the biosorbent, SEM was used. SEM images provided detailed insights into the surface structure, porosity, and texture of the raw and ATCH. These characteristics are crucial as they influence the AC. Samples were mounted on stubs and gold coated to enhance conductivity. The analysis was performed using a VegaTescan LMH II SEM, equipped with an energy-dispersive spectroscopy (EDS) detector for elemental mapping. The surface micrographs highlighted differences in texture and porosity between untreated and acid-treated samples, revealing structural enhancements due to acid treatment, which potentially improved dye adsorption efficiency [21].
2.5. Batch Adsorption Experiment
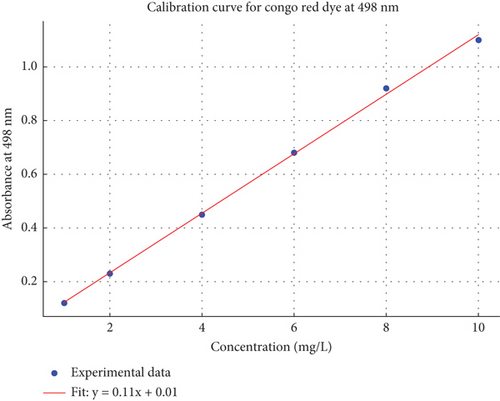
Batch adsorption experiments were conducted to evaluate the effectiveness of the prepared biosorbents. RCH and ATCH were tested for their capacity to adsorb Congo red dye. Experiments were carried out in 250-mL Erlenmeyer flasks at 25°C under constant agitation at 160 rpm using a magnetic stirrer. Various operational parameters, including temperature (25°C–50°C), contact time (30–150 min), adsorbent dosage (0.2–1 g), pH (3–11), and initial dye concentration (4–20 mg/L), were optimized to determine their influence on the adsorption process. After the reaction, the biosorbent was separated by filtration, and the remaining dye concentration in the solution was measured using a UV-visible spectrophotometer at a wavelength of 498 nm [12, 22], and a calibration curve for Congo red dye (Figure 1) was used to determine the concentration of the dye solution.
2.6. Brunauer–Emmett–Teller (BET) Surface Area and Pore Size Distribution Analysis
2.6.1. BET Surface Area Calculation
The units are as follows: SBET in square meter per gram and Vmin cubic centimeter per gram.
2.6.2. Average Pore Diameter (Nanometer) Using the Barrett–Joyner–Halenda (BJH) Method
The BJH method determines the pore size distribution from the adsorption–desorption isotherm data, based on the Kelvin equation for capillary condensation in mesopores.
2.7. Adsorption Isotherms
2.8. Kinetic Studies
To study the adsorption kinetics, the adsorption data were fitted to the pseudo–first-order and pseudo–second-order models [27, 28].
2.8.1. Pseudo–First-Order Kinetic Model
2.8.2. Pseudo–Second-Order Kinetic Model
The rate constants K1 and K2 were determined by linear regression.
2.9. Thermodynamic Analysis
The thermodynamic parameters of the adsorption process, including the Gibbs free energy (ΔG), enthalpy (ΔH), and entropy (ΔS), were calculated to determine the feasibility and spontaneity of the process, following the methods outlined by A. Ozer, D. Ozer, and Yavuz [14] and Vasanth, Perumal, and Santhanalakshmi [29].
By plotting ln K against 1/T, the values of ΔH and ΔS can be determined from the slope and intercept, respectively.
2.10. Response Surface Methodology (RSM)
RSM can be used to optimize the adsorption of Congo red dye using raw and ATCHs. The procedure begins with experimental design, where factors like pH, contact time, adsorbent dosage, and initial dye concentration are varied at three levels: low, medium, and high. The central composite design (CCD) is often used for this purpose [30].
Once the adsorption experiments are conducted, a second-order polynomial model is fitted to the data using regression analysis [31]. The model typically includes linear, quadratic, and interaction terms for the factors. An analysis of variance (ANOVA) is then performed to determine the significance of the factors and their interactions. The F-value and p value are used to assess statistical significance, with a p value < 0.05 indicating significant factors [32]. Response surface plots are generated to visualize the effect of factors on adsorption and to identify optimal conditions [30].
The optimization process involves determining the conditions that maximize the AC by solving the model equations. The model’s validity can be verified by conducting additional experiments under the optimized conditions and comparing the predicted and experimental results [33]. This approach ensures an efficient and cost-effective adsorption process.
2.11. Data Analysis
The data were analyzed using descriptive statistics (mean and standard deviation) to summarize adsorption efficiency under various conditions [34]. Isotherm models (Langmuir, Freundlich, and Temkin) and kinetic models (pseudo–first-order and pseudo–second-order) were applied to evaluate adsorption behavior and rate mechanisms [24–26]. Thermodynamic parameters, including Gibbs free energy, enthalpy, and entropy, were calculated to assess the feasibility and spontaneity of the process [14, 29]. RSM was used to optimize adsorption conditions, and a second-order polynomial model was developed to evaluate the effects of pH, contact time, adsorbent dosage, and temperature [30, 31]. Data analysis was performed using R and Origin Pro 2018 with statistical significance assessed through ANOVA (p < 0.05) [32]. Comparative analysis highlighted the superior performance of coffee husk biosorbents in dye removal, showcasing their potential for cost-effective wastewater treatment.
3. Results
3.1. Functional Characterization of Biosorbent Materials
Figure 2 presents the FTIR spectra of raw coffee husk before biosorption (RCHBB) and raw coffee husk after biosorption (RCHAB). The x-axis of the FTIR spectra typically represents the wave number (reciprocal centimeters), which corresponds to the energy at which the sample absorbs infrared light. Wave number is inversely related to the wavelength of infrared light, with higher wave numbers corresponding to shorter wavelengths (higher energy). The y-axis indicates the transmittance or absorbance of the infrared radiation. The transmittance refers to the percentage of light that passes through the sample at each wave number, while absorbance refers to the amount of light absorbed by the sample. A peak on the y-axis indicates that the sample absorbs infrared light at a specific wave number, which corresponds to the vibration of certain molecular bonds (functional groups) within the sample.
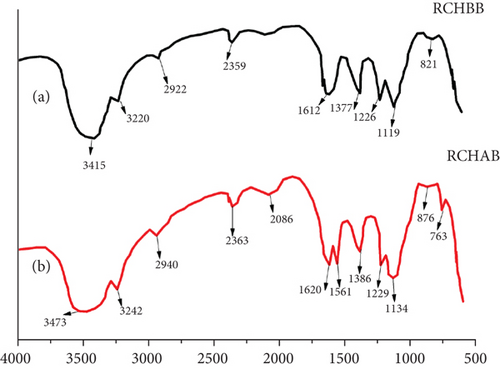
The broad peak around 3200–3600 cm−1 in RCHBB indicates the presence of –OH and –NH groups, which are typical of cellulose, hemicellulose, lignin, and proteins in the coffee husk structure. After biosorption, a decrease in intensity or a shift in this peak suggests that these functional groups interact with the Congo red dye molecules during the adsorption process. The peak around 2900 cm−1 corresponds to the aliphatic–CH stretching vibrations in lignocellulosic material, and changes in this peak between RCHBB and RCHAB suggest modifications in aliphatic chains or interactions with the dye molecules.
A distinct peak around 1700–1750 cm−1 in RCHBB is associated with carbonyl (C=O) groups, which likely come from esters, carboxylic acids, or aldehydes. After biosorption, the decrease in intensity or shift of this peak indicates that C=O groups were involved in the adsorption of the dye. The 1500–1600 cm−1 region corresponds to aromatic C=C stretching and N–H bending, revealing the aromatic structure in lignin or proteins. Changes in this region after biosorption suggest interactions between the aromatic rings of Congo red and the lignin matrix of the biosorbent. Additionally, the peak around 1000–1200 cm−1 represents C–O and C–N stretching in polysaccharides or proteins, and changes in this peak after biosorption highlight the role of these functional groups in the dye adsorption process. Overall, the FTIR analysis demonstrates that the RCHs contain a variety of functional groups that facilitate the adsorption of Congo red dye, confirming their potential as an effective biosorbent for wastewater treatment.
Figure 3 shows the FTIR analysis of ATCH as a biosorbent material: (a) acid-treated coffee husk before biosorption (ATCHBB) and (b) acid-treated coffee husk after biosorption (ATCHAB). The FTIR spectra of ATCH before and after the biosorption of Congo red dye (as shown in Figures 3(a) and 3(b)) provide insights into the functional groups involved in the adsorption process. The x-axis (horizontal axis) represents the wave number in reciprocal centimeters, which is related to the vibration frequency of the chemical bonds within the material. The wave number is inversely proportional to the wavelength and is typically used in infrared spectroscopy to identify the types of functional groups present in the sample. It spans from low to high wave number, often ranging from 400 to 4000 cm−1. The y-axis (vertical axis) represents the absorbance or transmittance, which indicates how much infrared radiation is absorbed by the sample at each wave number. A higher absorbance peak corresponds to stronger absorption at that specific wave number, indicating the presence of particular functional groups or bonds in the sample.
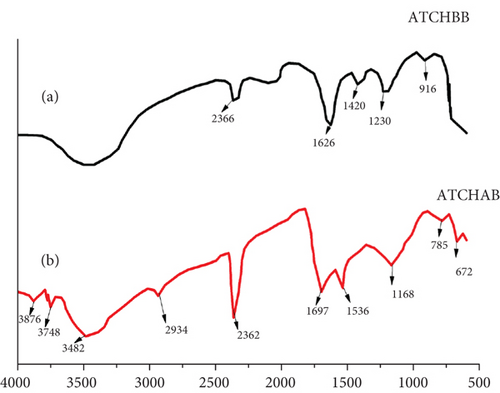
In (a), the FTIR spectrum of the ATCHBB reveals several characteristic absorption bands that correspond to functional groups introduced during the acid treatment. A prominent broad peak around 3400 cm−1 is associated with the stretching vibration of –OH groups, indicating the presence of alcohols and phenolic compounds, which can form hydrogen bonds with the dye molecules. The peaks around 1630 and 1400 cm−1 can be attributed to the stretching vibrations of –COOH groups, which are created by the acid treatment. These groups are important for the interaction between the biosorbent and the anionic Congo red dye. Additionally, peaks around 2900 cm−1 can be attributed to C-H stretching vibrations from the alkyl groups, confirming the presence of aliphatic hydrocarbons on the biosorbent surface. Furthermore, a peak around 1050 cm−1 indicates the presence of C-O stretching, characteristic of ether and alcohol functional groups, which also participate in the dye binding process.
In (b), after the biosorption of Congo red dye (ATCHAB), noticeable changes in the FTIR spectrum occur, signifying the successful interaction between the dye molecules and the biosorbent. A decrease in the intensity of the OH group peak around 3400 cm−1 suggests that the OH groups are involved in forming bonds with the dye molecules. The presence of new or shifted peaks, such as at 1580 cm−1, may indicate the interaction of the COOH groups with the dye’s aromatic rings or sulfonic groups. These shifts and changes in peak intensities support the hypothesis that the Congo red dye is adsorbed onto the ATCH via electrostatic interactions and hydrogen bonding with the functional groups. The FTIR data further suggest that the surface modification of coffee husk through acid treatment significantly enhances its capacity to adsorb the dye by introducing additional functional sites that facilitate stronger interactions with Congo red, thereby improving its biosorption performance.
3.2. Micromorphological Characterization of Biosorbent Materials
The SEM images in Figure 4 provide a comprehensive insight into the morphological changes that occurred on the surface of coffee husks before and after the biosorption of Congo red dye. In (a), the SEM image of RCH (before biosorption) reveals a relatively smooth and unaltered surface with minimal porosity. The husk exhibits fibrous structures that are not distinctly porous, indicating that the material has limited surface area available for interactions with pollutants like dyes. The appearance of a compact structure suggests that the functional groups that could bind to contaminants are present but not as accessible due to the surface characteristics of the untreated coffee husk.
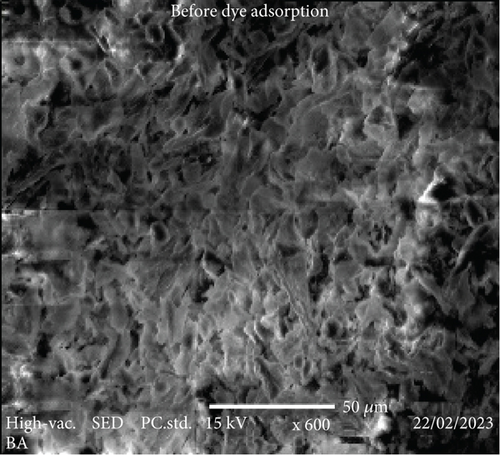
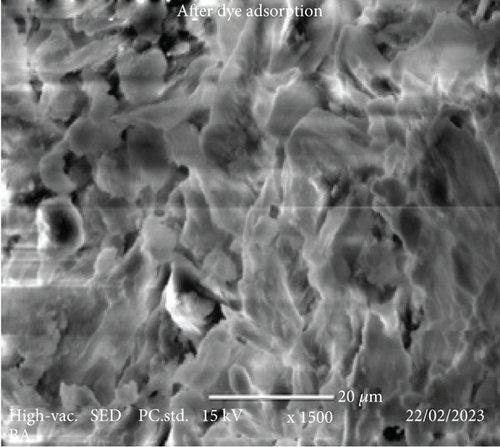
However, in (b), after the biosorption of Congo red dye, the SEM image demonstrates a significant transformation in the surface morphology of the coffee husk. The surface is noticeably more roughened and porous compared to the untreated material, suggesting the successful adsorption of Congo red dye molecules. The increased surface area and porosity likely result from the dye molecules interacting with the available functional groups on the coffee husk surface, enhancing the material’s capacity to trap and adsorb contaminants. The presence of new surface features and rough textures in the biosorbed sample is consistent with the dye molecules attaching to the coffee husk, altering its surface topography in the process. These modifications enhance the adsorption efficiency, as the increased surface area and altered surface characteristics provide more active sites for binding the dye molecules. This observation aligns with the expected outcome, showing that biosorption effectively modifies the physical properties of the coffee husk, improving its potential as a biosorbent material for removing pollutants from aqueous solutions.
3.3. BET Surface Area and Pore Size Distribution Analysis
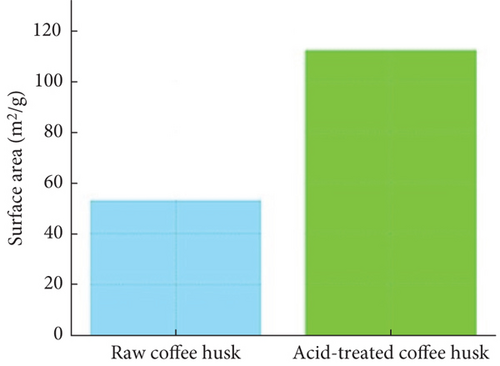
The BET analysis was conducted to evaluate the surface area and porosity of both raw and ATCHs (Table 1). Results indicate that the surface area of ATCH (112.35 ± 6.35 m2/g) is more than double that of RCH (53.42 ± 5.12 m2/g), demonstrating that the acid treatment significantly enhances the porosity of the material. This increase in surface area provides additional active sites for dye adsorption, improving the material’s adsorption performance.
| Parameter | Raw coffee husk | Acid-treated coffee husk | p value |
|---|---|---|---|
| Surface area (m2/g) | 53.42 ± 5.12 | 112.35 ± 6.35 | < 0.05 |
| Pore volume (cm3/g) | 0.075 ± 0.02 | 0.156 ± 0.03 | < 0.05 |
| Average pore size (nm) | 7.56 ± 1.25 | 9.02 ± 1.46 | < 0.05 |
Additionally, the pore volume (0.156 ± 0.03 cm3/g for acid-treated husk compared to 0.075 ± 0.02 cm3/g for raw husk) and average pore size (9.02 ± 1.46 nm for acid-treated husk versus 7.56 ± 1.25 nm for raw husk) are also higher in ATCH. These results indicate that acid treatment not only increases the surface area but also modifies the pore structure, making it more suitable for dye adsorption. The larger pores in acid-treated husk can accommodate larger dye molecules more effectively, contributing to the superior adsorption performance observed.
3.4. Adsorption Isotherms
Adsorption isotherms were used to study the relationship between the amount of dye adsorbed by coffee husk and the dye concentration in solution at equilibrium. The commonly used Langmuir and Freundlich models were applied to fit the adsorption data. Langmuir isotherm (monolayer adsorption on a surface with a finite number of identical sites) data suggest that ATCHs have a higher maximum AC (Qmax) of 98.56 ± 8.23 mg/g compared to 40.22 ± 4.56 mg/g for RCH (Table 2), indicating a more efficient adsorption process. The Langmuir constant (b) was also higher for acid-treated husks (0.021 ± 0.005 L/mg) than raw husks (0.014 ± 0.003 L/mg), further supporting the enhanced affinity for dye molecules.
| Model parameter | Raw coffee husk | Acid-treated coffee husk | p value |
|---|---|---|---|
| Langmuir Qmax (mg/g) | 40.22 ± 4.56 | 98.56 ± 8.23 | < 0.05 |
| Langmuir b (L/mg) | 0.014 ± 0.003 | 0.021 ± 0.005 | < 0.05 |
| Freundlich Kf (mg/g·L1/n) | 18.22 ± 2.43 | 25.58 ± 3.12 | < 0.05 |
| Freundlich n | 1.36 ± 0.12 | 1.52 ± 0.10 | < 0.05 |
Freundlich isotherm (heterogeneous adsorption on surfaces with different energy sites) parameters reveal that the n-value is greater than one for both biosorbents, indicating favorable adsorption conditions. For RCH, n was 1.36 ± 0.12, while for acid-treated husk, it was 1.52 ± 0.10, suggesting slightly more favorable adsorption in acid-treated husks. Moreover, the Freundlich constant (Kf, which reflects AC and strength of adsorption, was significantly higher for acid-treated husks (25.58 ± 3.12 mg/g·L1/n) compared to raw husk (18.22 ± 2.43 mg/g·L1/n), indicating enhanced AC and stronger affinity for Congo red dye.
3.5. Adsorption Kinetics
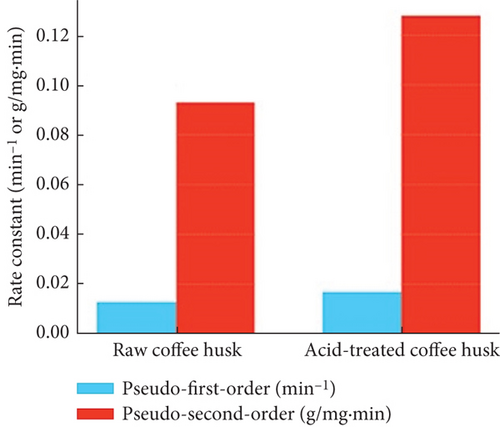
The adsorption kinetics was studied using pseudo–first-order and pseudo–second-order models to describe the adsorption rate and mechanism (Table 3). The pseudo–second-order model, with a rate constant (k2) of 0.128 ± 0.008 g/mg·min for ATCH and 0.093 ± 0.005 g/mg·min for RCH, fits the experimental data better than the pseudo–first-order model (k1 = 0.017 ± 0.004 min−1 for acid-treated husk and k1 = 0.013 ± 0.003 min−1 for raw husks). This indicates that the adsorption rate is primarily controlled by chemisorption, involving the sharing or exchange of electrons between the dye molecules and the biosorbent. The higher k2 value for ATCH demonstrates a faster adsorption rate and better dye uptake capacity compared to RCH, reflecting the enhanced interaction between the acid-modified surface and the dye molecules.
| Model parameter | Raw coffee husk | Acid-treated coffee husk | p value |
|---|---|---|---|
| Pseudo–first-order k1 (min−1) | 0.013 ± 0.003 | 0.017 ± 0.004 | < 0.05 |
| Pseudo–second-order k2 (g/mg·min) | 0.093 ± 0.005 | 0.128 ± 0.008 | < 0.05 |
3.6. Thermodynamic Studies
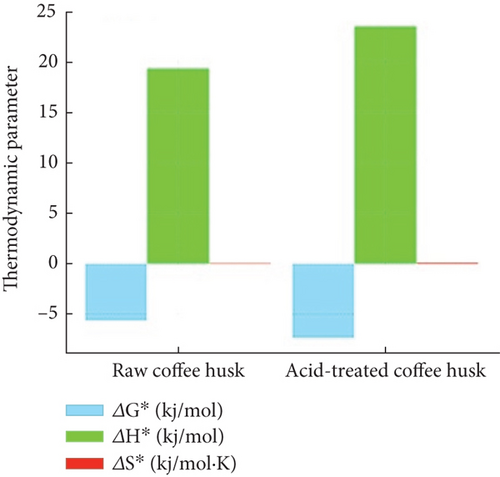
Thermodynamic parameters, including ΔG° (Gibbs free energy), ΔH° (enthalpy), and ΔS° (entropy), were calculated to evaluate the spontaneity, nature, and feasibility of the adsorption process (Table 4). The negative ΔG° values for both raw (−5.62 ± 0.45 kJ/mol) and ATCH (−7.38 ± 0.38 kJ/mol) confirm that the adsorption of Congo red dye is spontaneous and thermodynamically favorable. The more negative ΔG° value for ATCH indicates a stronger driving force for dye adsorption in comparison to raw husks.
| Thermodynamic parameter | Raw coffee husk | Acid-treated coffee husk | p value |
|---|---|---|---|
| ΔG° (kJ/mol) | −5.62 ± 0.45 | −7.38 ± 0.38 | < 0.05 |
| ΔH° (kJ/mol) | 19.35 ± 1.12 | 23.54 ± 1.35 | < 0.05 |
| ΔS° (kJ/mol·K) | 0.095 ± 0.02 | 0.106 ± 0.01 | < 0.05 |
The positive ΔH° values for raw (19.35 ± 1.12 kJ/mol) and ATCH (23.54 ± 1.35 kJ/mol) demonstrate that the adsorption process is endothermic, requiring heat to proceed. The higher ΔH° for ATCH suggests that their performance improves more significantly at elevated temperatures, indicating greater adsorption efficiency under such conditions.
The ΔS° values (0.095 ± 0.02 kJ/mol·K for raw husk and 0.106 ± 0.01 kJ/mol·K for acid-treated husk) reflect an increase in randomness at the solid–solution interface during the adsorption process. The higher ΔS° for acid-treated husks implies a greater degree of disorder or structural changes in the system, likely due to the enhanced interaction between the acid-modified surface and the dye molecules. This suggests a more dynamic and efficient adsorption mechanism for ATCHs.
The ATCH demonstrated significantly better performance than RCHs in terms of surface area, AC, rate of dye uptake, and thermodynamic favorability. Thermodynamic studies confirmed that the adsorption process is spontaneous and endothermic, with a stronger affinity for dye molecules in acid-treated husk. Kinetic and isotherm models suggest that ATCHs provide more favorable adsorption conditions, involving chemisorption with enhanced dye removal efficiency.
The plot in Figure 5(a) illustrates the comparison of BET surface area, pore volume, and average pore size for raw and ATCH. ATCHs exhibit a noticeable increase in surface area and pore volume compared to raw husk, indicating enhanced porosity due to the acid treatment. The average pore size may either remain unchanged or slightly vary, reflecting structural modifications in the husks posttreatment.
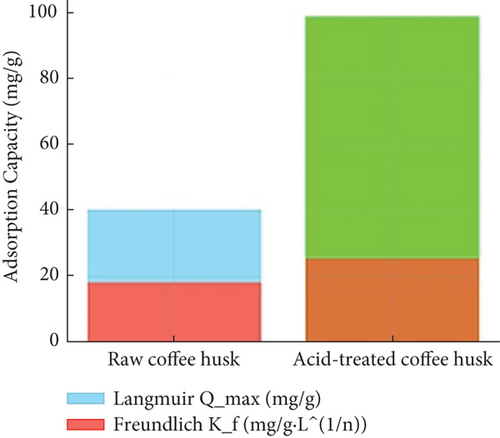
This plot in Figure 5(b) compares the adsorption behavior of raw and ATCH using Langmuir and Freundlich isotherms. Acid-treated husks demonstrate higher adsorption capacities, as evidenced by steeper Langmuir curves or better fitting Freundlich isotherms, confirming improved affinity and surface interaction with Congo red dye molecules.
The kinetic model curves (pseudo–first-order and pseudo–second-order) in Figure 5(c) show the adsorption rate and mechanism for raw and acid-treated husk. Acid-treated husks likely follow a pseudo–second-order kinetic model more closely, indicating chemisorption as the dominant process. In contrast, raw husks may show lower adsorption rates and less effective fitting to kinetic models.
The bar chart in Figure 5(d) compares the thermodynamic parameters ΔG° (Gibbs free energy), ΔH° (enthalpy change), and ΔS° (entropy change) for raw and acid-treated husks. Acid-treated husks likely exhibit more negative ΔG°, indicating higher spontaneity of the adsorption process. A positive ΔH° suggests an endothermic adsorption process, while an increased ΔS° reflects greater disorder at the solid–liquid interface due to the dye adsorption.
Acid treatment significantly enhances the surface area, porosity, and AC of coffee husks. Adsorption isotherms and kinetics confirm that acid-treated husks are more efficient in Congo red dye removal, likely due to improved surface properties and interaction mechanisms. Thermodynamic analysis highlights the spontaneous and endothermic nature of the adsorption process, with acid-treated husks showing superior performance.
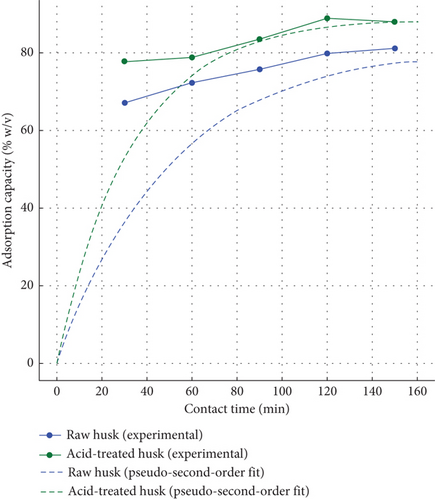
The plot in Figure 6(a) compares the AC of raw and ATCH over time for Congo red dye removal. For raw husk, the AC increases gradually, reaching equilibrium at approximately 81.5% after 150 min. This slow rate indicates limited surface area and pore availability for effective dye binding. In contrast, acid-treated husks exhibit faster adsorption, achieving equilibrium (~89.2%) within 120 min. The steeper curve for acid-treated husk reflects enhanced adsorption kinetics due to the improved surface area, porosity, and functional groups introduced during acid treatment. The dashed lines, representing hypothetical pseudo–second-order kinetic model fits, align well with both materials, confirming that the adsorption process is dominated by chemisorption, involving strong interactions between the dye molecules and the biosorbent. Acid treatment thus enhances both the rate and the overall AC.
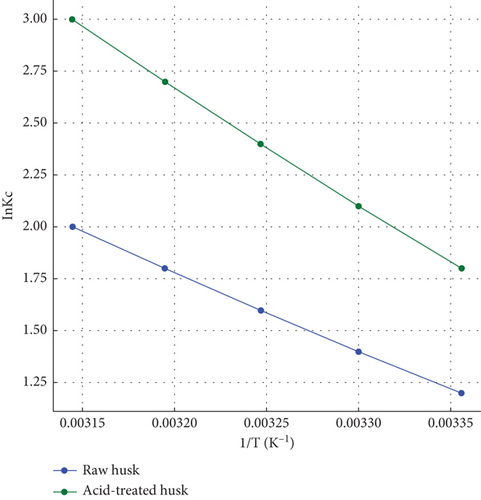
The right plot in Figure 6(b) shows the thermodynamic behavior of dye adsorption for raw and acid-treated husk by comparing lnKc values across different temperatures. For raw husk, lnKc increases gradually with temperature, indicating that adsorption equilibrium improves with higher temperatures, but with moderate sensitivity to temperature changes. Acid-treated husks, however, display consistently higher lnKc values and a steeper slope, reflecting stronger adsorption performance and a greater enhancement with increasing temperature. The positive slope in both cases confirms an endothermic adsorption process, where higher temperatures favor better dye adsorption. Acid-treated husks exhibit greater spontaneity (more favorable ΔG°), higher enthalpy change (ΔH°), and entropy change (ΔS°), highlighting their superior AC and structural adaptability. Overall, ATCHs outperform raw husks in terms of both kinetic and thermodynamic efficiency, making them highly effective biosorbent materials for practical applications.
3.7. Optimization of Factors Affecting Biosorption of Congo Red Dye
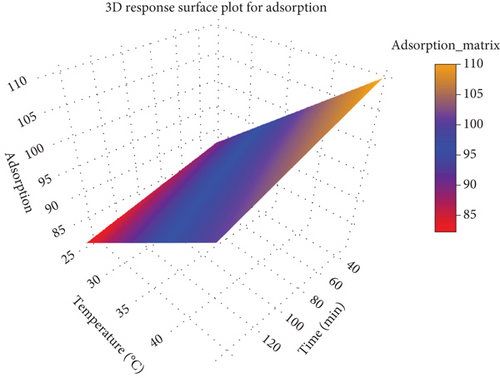
Bioadsorbents were characterized, and optimum conditions for batch-scale removal of dye were found. The maximum wave length of Congo red dye absorbance was at 498 nm for the calibration curve. The 3D response surface plot for adsorption illustrates the interplay between three variables: adsorption, temperature (degrees Celsius), and time (minutes) (Figure 7). In this plot, adsorption, which is the response variable, is represented on the vertical axis, while temperature and time are the independent variables, placed on the x- and y-axes, respectively. As both temperature and time increase, the adsorption efficiency improves, suggesting a positive correlation between these factors and adsorption. The color map within the plot, transitioning from red to blue to yellow, further emphasizes this relationship. Red areas represent low adsorption, while yellow indicates high adsorption. A closer interpretation shows that at lower temperatures and shorter times, adsorption remains minimal, while as the temperature and time increase, adsorption rises significantly, reaching its peak in the upper-right corner of the plot, where the maximum temperature and time are applied.
The 3D response surface plot for adsorption (Figure 8) provides a comprehensive visualization of how adsorption (z-axis, the response variable) is influenced by pH (x-axis) and time (y-axis), offering valuable insights into the interplay of these factors in the adsorption process. Adsorption increases significantly as the pH progresses from acidic (~3) to alkaline (~10). This trend suggests that the adsorption process is more efficient in an alkaline environment, potentially due to favorable interactions between the adsorbent surface and the Congo red dye. At higher pH levels, the surface charge of the adsorbent and the ionic state of the dye might promote stronger binding or attraction, enhancing the AC. The plot reveals that adsorption improves with longer contact times, particularly in the initial stages. This rising trend along the time axis highlights the necessity of allowing sufficient time for the adsorption process to reach equilibrium. However, beyond a certain time threshold, the increase in adsorption may plateau, as equilibrium is achieved and the adsorbent’s active sites become saturated.
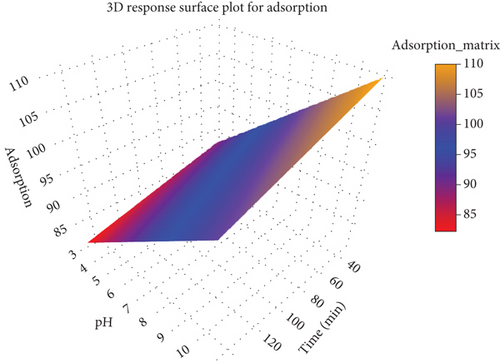
The plot demonstrates that optimal adsorption occurs at a combination of higher pH and longer contact time. This is evident in the upper-right corner of the plot, where the surface height peaks and the yellow region indicates maximum adsorption. Such a combined influence underscores the importance of both variables in optimizing adsorption efficiency.
The color gradient provides a clear visual representation of the adsorption levels. Red regions, representing low adsorption, are associated with lower pH and shorter contact times, while the transition to yellow regions signifies increasing adsorption levels with favorable pH and extended time. This gradient serves as a practical guide for identifying optimal conditions for adsorption.
The 3D response surface plot illustrates the adsorption process as influenced by temperature (x-axis) and pH (y-axis), with adsorption (z-axis) as the response variable (Figure 9). This visualization helps identify how these independent variables interact to affect adsorption efficiency. Adsorption remains relatively stable across the temperature range of 25°C–40°C, as the plot shows minimal variation in surface height along the temperature axis. This suggests that temperature has a weak influence on adsorption within this range, potentially indicating that the adsorption process is not significantly temperature-dependent or that the range investigated does not include the critical temperature for significant changes. The response surface shows a slight increase in adsorption efficiency around a pH of 6–7, forming a mild peak. This indicates that pH has a more noticeable impact than temperature, with adsorption likely being optimized near neutral pH. Such sensitivity to pH might reflect the dependence of the adsorption mechanism on the ionic interactions between the adsorbent and the adsorbate, as the surface chemistry of the adsorbent and the charge state of the Congo red dye could vary with pH.
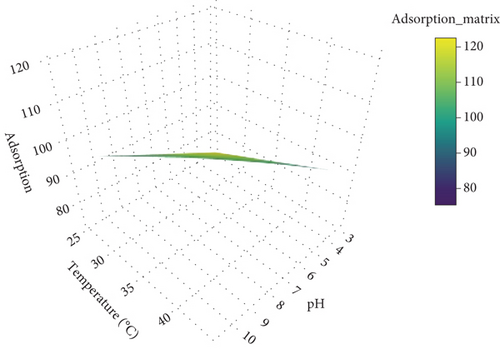
The plot is relatively flat overall, with only minor peaks, suggesting that neither temperature nor pH exerts a strong individual or combined effect on adsorption in this specific experimental setup. However, the central region of the plot, marked by yellow, indicates the highest adsorption values (~120), occurring at moderate levels of both temperature and pH. This implies that an optimal combination of these factors can achieve slightly enhanced adsorption efficiency. The color gradient transitions from blue (low adsorption) to yellow (high adsorption). The gradual change in colors emphasizes the lack of steep variations in adsorption, reinforcing the observation that the response surface is mostly flat. The yellow regions near the center of the plot highlight the combination of moderate pH and temperature as favorable for maximizing adsorption.
From all three plots (Figures 7, 8, and 9), it is evident that time consistently exerts the highest influence on adsorption efficiency, indicating that extending the contact time is essential for achieving optimal results. While pH and temperature also affect adsorption, their impacts are secondary. Among these, pH is slightly more significant than temperature, particularly near neutral pH, where adsorption efficiency tends to peak. Generally, time is the most critical factor, significantly improving adsorption as contact time increases. pH is moderately important, with adsorption efficiency peaking around neutral pH. Temperature is the least impactful factor, showing minimal influence within the tested range.
The contour plot visualizes the relationship between temperature (degrees Celsius) and pH on a coffee husk biosorption of Congo red dye, for a fixed time slice at 90 min (Figure 10). The x-axis represents the temperature, ranging from 25°C to 45°C, while the y-axis denotes the pH, spanning from 4 to 10. The contour lines represent levels of biosorption of Congo red dye, labeled at intervals (e.g., 75, 80, 85, 90, 95, and 100), with a color gradient transitioning from green (indicating lower response values) to red (indicating higher response values). This gradient highlights the areas of lower and higher response magnitudes within the parameter space.
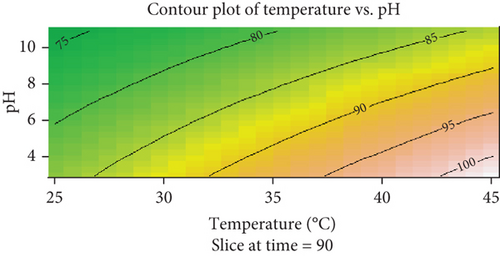
The dye biosorption is observed to increase with both rising temperature and pH. Regions with the highest response (near 100) are located in the upper-right corner of the plot, where temperature exceeds 40°C and pH approaches 10. Conversely, the lowest response values (around 75) are found in the lower-left corner, corresponding to low temperature (below 30°C) and low pH (below 5). The trend shown by the contour lines indicates that the response changes more sharply with temperature than with pH, suggesting that temperature may have a stronger influence on the response variable within the studied range. The optimal region for maximizing the biosorption lies at high temperature and high pH, while the least favorable conditions occur at low temperature and low pH.
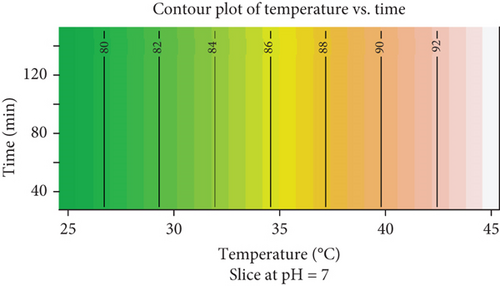
The contour plot explores the relationship between temperature (degrees Celsius) and time (minutes) at a fixed pH of 7, illustrating their combined influence on the biosorption of Congo red dye (Figure 11). The x-axis represents temperature, ranging from 25°C to 45°C, while the y-axis shows time, spanning 40–120 min. The contour lines and color gradients (green to red) depict the response levels, with higher values corresponding to warmer colors. The plot reveals that temperature plays a dominant role in influencing the response, as evidenced by the pronounced increase in response values (from 80 to over 92) with rising temperatures. The contour lines are nearly vertical, indicating that time has a negligible effect on the response across the examined range. The highest response values are observed at higher temperatures (40°C–45°C) regardless of the duration, while lower responses are found at lower temperatures (25°C–30°C), also independent of time. This suggests that optimizing temperature is critical for achieving maximum response, and process efficiency can be maintained by using shorter times without significantly impacting the outcome. The plot highlights the importance of prioritizing temperature control over time management in this system under the given conditions.
The contour plot illustrates the interaction between pH and time on a response variable at a constant temperature of 35°C. The horizontal axis represents pH values ranging from 4 to 10, while the vertical axis shows time intervals from 40 to 120 min (Figure 12). The gradient of colors, ranging from light pink to dark green, indicates different levels of the response variable, with lighter colors signifying lower response levels and darker colors representing higher values.
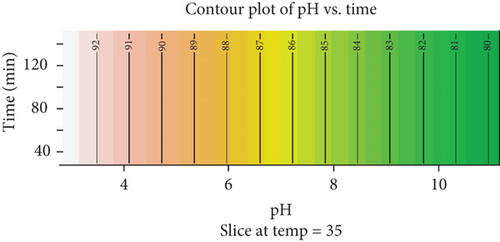
From the plot, it is evident that the response variable increases with higher pH values, particularly in the range of 4–8, where a more significant gradient in color intensity is observed. Beyond a pH of 8, the response appears to stabilize, suggesting a potential plateau effect. Conversely, the influence of time on the response is less pronounced compared to pH. Across all time intervals, the contours remain nearly parallel, indicating that the response does not vary substantially with time, especially at higher pH levels. This implies that pH has a stronger impact on the response than time under the given experimental conditions.
Such a pattern could suggest that the system or reaction reaches equilibrium relatively quickly, with pH playing a dominant role in determining the efficiency or magnitude of the response.
4. Discussion
The coffee husk used in this study as a bioadsorbent was characterized to assess its suitability for Congo red dye biosorption. The chemical composition and surface characteristics of coffee husk were crucial for understanding its AC. Previous studies have demonstrated that agricultural waste materials like coffee husk possess high adsorption potential due to their rich composition of cellulose, lignin, and other organic compounds that can interact with dyes [35, 36]. Similar to the findings of our study, it has been observed that the surface functional groups of bioadsorbents such as OH, COOH, and NH2 groups are responsible for the dye-binding sites [36]. This characterization supports the use of coffee husk in dye removal applications and highlights its potential for cost-effective and sustainable biosorption.
In this study, the adsorption isotherms and kinetics were explored to understand the dye uptake process. Our findings, which indicate the dye adsorption follows a pseudo–second-order kinetic model, align with results from similar studies on agricultural waste materials. For instance, studies by Mollah et al. [37] and Al-Qodah [38] have shown that the pseudo–second-order model better describes the adsorption process for dye removal by biosorbents. This suggests that the adsorption of Congo red dye onto coffee husk involves chemisorption, where covalent bonds form between the dye and the adsorbent surface. The agreement with these previous works emphasizes the similar behavior of coffee husk as an effective biosorbent for Congo red dye.
The effect of pH on adsorption was evaluated, and our results showed that maximum adsorption occurred at alkaline pH, specifically around pH 10. This finding is consistent with previous studies, which have indicated that pH significantly influences the surface charge of adsorbents and the ionic state of dyes. For example, studies by Sani et al. [39] and Mubarak et al. [40] found that the adsorption of anionic dyes like Congo red is enhanced in alkaline conditions, as the negative charge on the dye interacts favorably with positively charged sites on the adsorbent surface. Similarly, a study by Ramesh, Kumar, and Singh [41] found that coffee husk exhibited higher adsorption in alkaline environments due to increased availability of active adsorption sites. The alkaline pH in this study, therefore, suggests favorable conditions for efficient Congo red dye removal by coffee husk.
Contact time plays a crucial role in the adsorption process. The present study demonstrated that longer contact times led to higher adsorption efficiency, aligning with findings from many previous studies. For instance, studies by Ghosh, Bhattacharyya, Agarwal [42] and Hameed [43] showed that as contact time increased, the dye molecules had more opportunity to interact with the adsorbent, leading to greater adsorption. This study confirms that allowing sufficient time for the adsorption process to reach equilibrium is essential for achieving maximum dye removal. Additionally, the plateau observed at longer contact times (as shown in the 3D response surface plots) indicates that the system reached equilibrium, and no further significant adsorption occurred beyond that point.
Temperature had a moderate effect on Congo red dye adsorption, with higher temperatures improving adsorption efficiency slightly. This observation aligns with the findings of a study by Sari and Tuzen [44], where increasing temperature led to enhanced adsorption due to the increased kinetic energy of dye molecules and the adsorbent. However, the effect of temperature was less pronounced in this study, especially within the range of 25°C–40°C, suggesting that temperature might not be a critical factor in the adsorption process for coffee husk in this case. This is in contrast with studies on other adsorbents where temperature played a more significant role [45]. Thus, while temperature can influence adsorption, it appears that it is not as crucial as time and pH in this system.
The 3D response surface and contour plots in this study revealed the interactions between temperature, pH, and contact time, providing deeper insights into how these factors collectively affect adsorption efficiency. The results showed that time exerted the most significant influence on adsorption, with adsorption efficiency increasing with longer contact times. These findings are supported by studies like those of Gupta, Ali, and Saini [35], which highlighted the dominant role of contact time in dye adsorption processes.
When examining the interaction between pH and time, our results indicated that longer contact times at alkaline pH conditions led to the highest adsorption efficiency. This finding aligns with previous research, including work by Jamil, Qaiser, and Iqbal [46], which showed that alkaline conditions at extended contact times could significantly enhance the removal of dye from aqueous solutions.
Through optimization, it was found that the optimal conditions for Congo red dye biosorption occurred at high temperature, alkaline pH, and extended contact time. This is consistent with results from studies by Hameed [43] and Mollah et al. [37], where optimization of conditions led to higher dye removal efficiencies. Our study confirmed that coffee husk can efficiently adsorb Congo red dye under these optimal conditions, highlighting its potential as a sustainable biosorbent. Additionally, the results from the contour plots reinforced the idea that temperature, pH, and time interact synergistically to enhance biosorption efficiency, confirming that a multifaceted approach to optimization is essential for achieving the best results.
Prior studies primarily focused on biosorbents like rice husks, sugarcane bagasse, and coconut shells, with much of the research highlighting challenges such as high preparation costs and limited biodegradability of chemically modified materials [47]. In contrast, coffee husks have the advantage of inherent porosity and surface area, requiring minimal modification for effective pollutant removal. Activated carbon typically exhibits a high AC, often in the range of 50–500 mg/g, depending on the source and activation method [48, 49]. ATCHs have shown promising results, with adsorption capacities potentially ranging between 20 and 40 mg/g for Congo red dye, which is significant considering its cost-effectiveness and environmental friendliness [50]. Other low-cost biosorbents such as rice husks or sawdust typically have lower adsorption capacities than ATCH and AC, in the range of 10–20 mg/g, though they are still effective for low concentrations of dye [51, 52].
Coffee husk has promising industrial applications, particularly in wastewater treatment, where it can remove dyes, heavy metals, and organic contaminants in an eco-friendly, cost-effective manner. Its use extends to bioremediation, nutrient recovery, biofuel production, and biodegradable plastics. The low cost and abundance of coffee husk make it an attractive alternative to traditional adsorbents, with potential for waste valorization and reduced energy and chemical costs. However, scaling up its use requires addressing challenges like material availability, efficient processing, and ensuring regulatory compliance. Despite these challenges, its reusability and environmental benefits suggest a viable path for large-scale implementation, especially in coffee-producing regions.
Coffee husk shows strong potential for reusability and regeneration as a biosorbent. After adsorption, coffee husk can be regenerated through simple methods, such as washing with mild chemicals or heating, allowing it to be reused multiple times for dye and pollutant removal. This regeneration process not only reduces the overall operational costs but also makes it a sustainable option for long-term use in wastewater treatment. The ability to regenerate and reuse coffee husk enhances its cost-effectiveness, making it a viable alternative to synthetic adsorbents that often require more complex disposal or replacement. However, the efficiency of regeneration may decrease over time, requiring further research to optimize the process and ensure its effectiveness in large-scale applications.
4.1. Implications and Future Research Directions on Biosorbents
The findings of this study emphasize the potential of agricultural waste, such as coffee husk, as an eco-friendly and cost-effective solution for dye removal from wastewater. The use of biosorbents addresses environmental challenges by reducing reliance on synthetic materials and promoting waste valorization. This approach supports circular economy principles, enabling sustainable water treatment technologies, particularly for resource-limited settings.
Future research should focus on the following: investigating the molecular interactions between biosorbents and various pollutants to better understand the adsorption process, evaluating the performance of biosorbents in treating wastewater containing diverse contaminants, developing scalable and efficient biosorption systems for industrial applications, exploring chemical or physical modifications of biosorbents to improve their AC and reusability, and assessing the environmental footprint and economic viability of biosorbent-based wastewater treatment systems.
The study acknowledges certain limitations that warrant further investigation. One key challenge is the need for long contact durations (up to 120 h) to achieve optimal adsorption efficiency. While this ensures effective dye removal, it may limit the feasibility of real-time or large-scale wastewater treatment applications where faster adsorption is essential. Additionally, the regenerability of coffee husk biosorbents, although promising, requires in-depth evaluation. Regeneration through chemical washing or heating may lead to a gradual decline in adsorption efficiency over multiple cycles. This necessitates research into optimizing regeneration methods to enhance long-term performance, ensuring cost-effectiveness and sustainability for large-scale operations. Addressing these limitations is crucial for advancing the practical applicability of coffee husk as a biosorbent.
5. Conclusion
This study systematically investigated the biosorption of Congo red dye using coffee husk, an agricultural waste, as a bioadsorbent. The results highlight the significant influence of various factors such as temperature, pH, and contact time on the dye removal efficiency. The adsorption process was found to be most effective at higher pH values, with optimal results achieved at a neutral to slightly alkaline pH range. Contact time was identified as the most critical factor for enhancing adsorption efficiency, with longer contact periods leading to higher removal rates. Temperature had a relatively minor impact, suggesting that the process operates efficiently at ambient conditions. The 3D response surface plots and contour plots provided a detailed understanding of the complex interactions between the variables and allowed the identification of optimal conditions for biosorption. While temperature and pH were important, their effects were secondary to time, which remained the dominant factor in achieving maximum dye removal. This study aligns with previous research that also emphasized the critical role of contact time and pH in biosorption processes, confirming the suitability of coffee husk as an effective and eco-friendly biosorbent for Congo red dye. The findings of this study contribute to the growing body of knowledge on the use of agricultural wastes for wastewater treatment, offering a cost-effective, sustainable solution for dye removal. Future studies may focus on further optimizing these conditions and exploring the regeneration potential of coffee husk for multiple cycles of dye removal.
Ethics Statement
The ethical approval is not applicable for this manuscript since it has no animal experiments according to the Haramaya University’s ethical committee.
Consent
The authors have nothing to report.
Conflicts of Interest
The authors declare no conflicts of interest.
Author Contributions
Dr. Zekeria Yusuf: initiation and design of the study, lab experiment, data analysis; Mr. Zemenu Pilto: lab experiment, data collection, and write-up of the document; Dr. Mulugeta Desta: analysis and interpretation of data. All authors contributed to drafting the article and revising it critically for important intellectual content.
Funding
This project was funded by Haramaya University research grant, under Project Code HURG_2021_06_01_25.
Acknowledgments
The authors are grateful to Haramaya University Research Office for their financial support and laboratory facility.
Open Research
Data Availability Statement
Data is available on request due to privacy/ethical restrictions.


