Domain Knowledge Embedded InSAR-Based 3D Displacement Monitoring of Urban Buildings
Abstract
Continuous monitoring of building displacement is crucial for urban structural safety. While traditional methods are costly, Interferometric Synthetic Aperture Radar (InSAR) offers a cost-effective alternative, providing long-term displacement data. However, due to the insensitivity of SAR radar to north-south displacement, using InSAR alone can only measure settlement and east-west displacement. To address this limitation, this paper presents a three-dimensional (3D) deformation extraction model. The model embeds domain knowledge to introduce additional constraints, which are then used to establish the relationship between north-south and east-west displacement. This relationship allows for the extraction of 3D displacement of buildings from the line of sight (LOS) displacement measured by InSAR. This model was applied to Tower 2 of Yingli International Financial Center (YIFC) in Chongqing, China, and the 3D displacement of the building between 2018 and 2021 was obtained.
1. Introduction
During long-term use, buildings may be affected by environmental erosion, material deterioration, and the impact of disasters, potentially leading to structural damage [1, 2]. By monitoring the displacement [3–7] of the structure for long-term operation and maintenance of the building, the structural condition of the building can be evaluated, and potential problems can be identified and solved in a timely manner [8]. However, traditional monitoring methods such as sensor networks [2, 9] and global navigation satellite systems [10, 11] are expensive and require installation and daily maintenance of equipment, which consumes significant manpower and resources [12]. Interferometric Synthetic Aperture Radar (InSAR) presents an alternative approach by noninvasively and remotely acquiring deformation information of structures [13, 14]. Although it requires a time gap between two monitoring sessions [15], InSAR demonstrates unique advantages in meeting the long-term and continuous monitoring requirements of daily building operations. InSAR is anticipated to offer long-term, cost-effective, and maintenance-free deformation monitoring, addressing the challenges associated with traditional structural monitoring methods.
InSAR is widely adopted for monitoring surface [16–19] and engineering structure [20–22] deformation due to its inherent advantages, such as high spatiotemporal resolution [23], independence from time and climate conditions [24], and cost-effectiveness in data collection [25]. However, a single InSAR can solely capture deformation along the radar line of sight (LOS) direction [26, 27]. To observe more comprehensive deformation, researchers have developed the two-dimensional (2D) deformation calculation model based on the spatial characteristics of SAR satellite observations [28–31]. This model, when combined with the one-dimensional deformation field along the LOS of both ascending and descending tracks, enables the derivation of high-precision 2D deformation fields in both the vertical and east-west directions.
Nevertheless, simplistic one-dimensional or 2D deformations may not accurately depict the true deformation state of structure. This limitation arises, in part, from the fact that the SAR satellite’s flight direction is typically aligned with the north-south axis, making it difficult to monitor displacements in the north-south direction, which are perpendicular to the LOS direction. To overcome this limitation, many researchers have expanded upon InSAR’s 2D monitoring capabilities by integrating additional radar imagery data [32] or combining InSAR with other measurement techniques, such as Global Positioning System (GPS) [33–36], to increase observational coverage and provide supplementary three-dimensional (3D) deformation data; Alternatively, by combining prior models [37–39] such as the assumption of glacier movement parallel to the surface [34], information on geological structures [39], or the subsidence mechanism of mining areas [38], additional constraints can be added to reconstruct the 3D model.
This paper aims to utilize InSAR for nearly zero-cost long-term monitoring to continuously track the 3D displacement of buildings. However, given that the current application of InSAR for building displacement monitoring primarily focuses on one-dimensional displacement monitoring, such as settlement and specific deformation directions, and the integration of GPS and InSAR still entails equipment installation and maintenance, challenges persist. Additionally, the use of the multitrack InSAR observation method for displacement extraction requires three or more InSAR interferometric pairs with significant geometric differences in radar track imaging. In practice, due to the limited number of SAR radars, it is often difficult to find multiple radar images that simultaneously meet these conditions. Therefore, it is reasonable to employ a method that integrates prior information of buildings to add supplementary constraints for constructing a 3D model.
This paper presents a method of embedding domain knowledge to extract the 3D displacement of buildings from the LOS displacement of InSAR’s ascending and descending tracks. The proposed method is based on the Equivalent Lateral Force Method (ELFM) to obtain the lateral stiffness of each floor of the building, thereby deriving prior information on the displacement ratio of the building’s major and minor axes. Subsequently, the Permanent Scatterer InSAR (PS-InSAR) method is considered to obtain the temporal displacement of the building along the LOS in the ascending and descending tracks, and a displacement calculation model is established. The prior information of the building is then used to add new constraints to the calculation model, enabling the extraction of the cumulative 3D displacement of the building over time series intervals. This work introduces the concept of a 3D displacement extraction model and validates the proposed method by applying it to a practical building, thereby providing a new scientific basis for urban construction and disaster prevention. This study aims to offer safer and more sustainable infrastructure support for urban development, promote the advancement of building monitoring technology, and provide solid assurances for the future development of cities.
2. Methodology
2.1. Introduction of PS-InSAR Technologies
PS-InSAR [40] technology is used to extract and analyze phase information from PS points, such as buildings and facilities. These points are less affected by temporal and spatial decoherence, allowing them to maintain stable phase and amplitude information. Subsequently, atmospheric and noise phases are removed to facilitate the acquisition of precise deformation data from these PS points. Over years of development, PS-InSAR method has reached a high level of maturity, possessing capabilities not only to measure small, individual targets but also to monitor large-scale surface deformations. In contrast to traditional Differential InSAR (D-InSAR) technology, significant enhancements have been made in the accuracy of deformation measurements, which can attain precision at the millimeter level.
2.2. Description of Displacement Calculation Model by InSAR Data
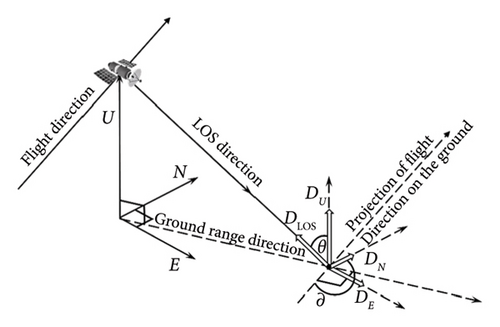
3. Mechanics-Embedded 3D Displacement Decomposition
The objective of this study is to extract the 3D displacement of buildings from the cumulative time series displacement of InSAR. Due to the limited number of radars, only the LOS displacement from the ascending and descending orbits can typically be obtained. As a result, the displacement calculation model is rank-deficient and cannot provide 3D displacement [15, 41, 42]. To mitigate this limitation, the study proposes the introduction of additional constraint conditions by embedding domain knowledge based on existing InSAR displacement calculation model. This proposal aims to enhance the function of the original technology and enable it to analyze the 3D deformation of buildings. Consequently, it offers broader data support for related engineering decisions.
3.1. Domain Knowledge: ELFM
ELFM stands as a widely utilized lateral force analysis and design technique in structural engineering. This method conceptualizes the lateral force exerted on the structure as a solitary lateral force applied to each floor. It streamlines intricate multiparticle systems by simplifying them into an equivalent single particle for consideration, facilitating designers in conducting preliminary lateral calculations.
When employing the ELFM, only one degree of freedom can be considered for each floor (Figure 2(a)). The standard value of horizontal lateral action acting on the structure can be determined using the following formula.
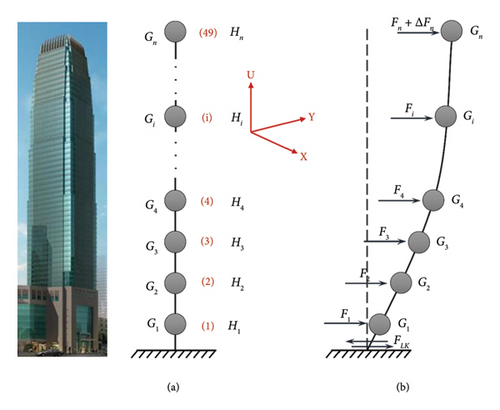
3.2. Introduction of Additional Constraints
This study uses ELFM to further derive the deformation rates of supertall structures along the major and minor axes as additional constraints. However, it is worth noting that the application scope of this method is limited by factors such as structural nonlinearity. For buildings with complex geometries or dynamic behaviors, multidegree-of-freedom (MDOF) models can be used for more accurate design, as they allow for a better simulation of the structure’s response. Hence, in practical design scenarios, additional verification measures should be implemented to ensure the accuracy and reliability of the design.
3.3. Establishment of a 3D Deformation Extraction Model for Buildings
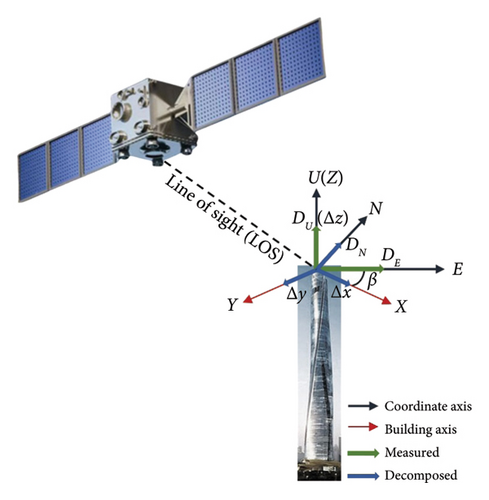
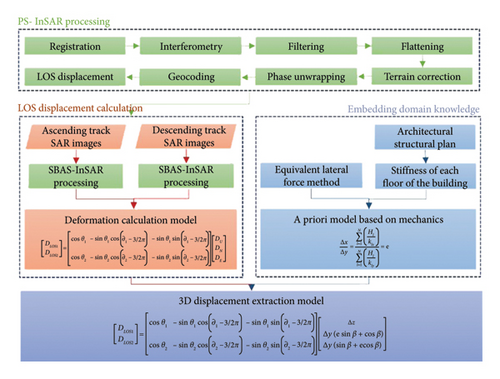
4. Implementation Procedure
The combination of InSAR technology with prior models presents a novel avenue for conducting 3D deformation monitoring of buildings. This chapter offers a comprehensive overview of the specific implementation approach of this method, aiming to facilitate the application of this method in practical applications by relevant researchers. The delineated implementation steps are as follows.
4.1. Preparation of Data
Initially, the location of the building earmarked for monitoring was identified through geographic information system (GIS) analysis, designating it as the research area. Simultaneously, it was verified that the SAR satellite orbiting the area possesses data captured from both ascending and descending trajectories, thereby ensuring the feasibility of subsequent InSAR 3D displacement extraction. Subsequent to this verification, radar satellite images and corresponding observation angles from the study area during the monitoring time were procured, in readiness for subsequent data processing endeavors.
4.2. Determination of the Displacement Ratio Between the Major and Minor Axes of a Building
Transition into discussing how to determine the calculation of displacement ratio along the building axis. This paper introduces a novel approach using design or construction drawings of buildings to determine the deformation ratio between the major and minor axes. By collecting these drawings, detailed information about the building’s layout, structural framework, and support system can be obtained. Substituting the stiffness and other relevant data from each floor’s major and minor axes into formula (18), allows for the computation of the deformation ratio at the building’s top. Additionally, obtaining actual displacement data or using finite element models are also common methods to achieve the deformation ratio.
4.3. Calculation of InSAR LOS Displacement
With the establishment of additional constraints, shift focus to the technical processing of InSAR data. PS-InSAR is used to process the images of Sentinel-1A and obtain the displacement of the building along the LOS on the ascending and descending tracks, respectively. The detailed processing procedure of PS-InSAR technology encompasses several crucial steps: Initially, image registration is essential for ensuring spatial consistency among multitemporal SAR images, which is vital for subsequent analysis. Following this, differential interferograms are produced by calculating the phase differences between adjacent temporal SAR images to estimate minute changes on the earth’s surface. Differential interferograms are typically affected by noise, thus necessitating filtering processes to improve image quality, with common methods including the Goldstein filter and adaptive filters. The final step involves geocoding, which transforms differential interferometry results from the slant range coordinates of the SAR image to the geographic coordinate system of the earth. This step not only provides the geographic location of the displacement information but also facilitates integration with other GIS datasets for further analysis.
4.4. Obtaining 3D Deformation of Buildings
Subsequently, by embedding previously acquired domain knowledge and considering the angle between the building’s major axis and the east-west direction to establish the relationship between the displacements of the building’s major and minor axes and the north-south displacement. Then combining this relationship with the InSAR displacement model to derive the 3D displacement of the building in the direction of settlement and along the major and minor axes.
4.5. Eliminating the Periodicity of Deformation
Finally, eliminate the influence of external factors such as temperature changes on displacement. In the research fields of earth science and geophysics, the investigation of building deformation often encounters various interference factors, with periodic interference, particularly from temperature changes, posing significant challenges to data accuracy and reliability. To mitigate this challenge, Empirical Mode Decomposition (EMD) emerges as a widely employed signal processing technique in this domain, effectively breaking down complex nonlinear and non-stationary signals into a series of Intrinsic Mode Functions (IMFs). Specifically, in the analysis of building deformation, periodic fluctuations induced by temperature variations are prominently reflected in specific IMFs. Through EMD of signals and subsequent analysis of these IMFs, periodic deformation signals can be efficiently identified and eliminated, thereby isolating more realistic trend-oriented deformations from building deformation data.
5. Application to Real Data
5.1. Overview of Engineering Examples
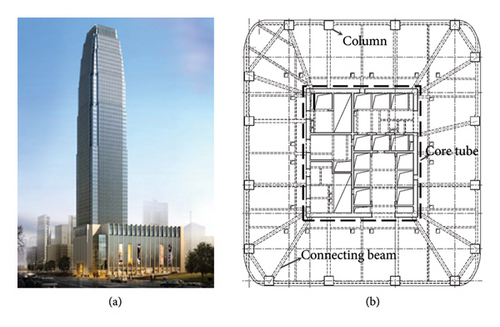
This research was conducted based on Tower 2 of Yingli International Financial Center (YIFC), located in Yuzhong District, Chongqing, China. The building has 49 floors above ground and 4 floors underground, with a roof structure elevation of 231.25m. It adopts a frame core tube structure system, and the architectural effect and the arrangement of shear walls for a certain standard floor are shown in Figure 5.
Utilizing the floor plan of the building structure, this study applied equation (15) to compute the stiffness of each floor in both the major and minor axes of the building. The detailed calculation outcomes are compiled in Table 1. Subsequently, employing equation (17), the study derived a deformation ratio of 1.1338 for the major and minor axes at the top of the building, which serves as a basis for further deformation analysis.
| Layer number | Hi (m) | kx (×104 kN·m−2) | ky (×104 kN·m−2) |
|---|---|---|---|
| 1 | 5.950 | 6.8891 | 6.5591 |
| 2 | 11.950 | 3.4743 | 3.1443 |
| 3 | 17.350 | 3.5745 | 3.2445 |
| 4 | 22.750 | 3.5745 | 3.2445 |
| 5 | 28.150 | 3.5745 | 3.2445 |
| 6 | 32.650 | 3.8063 | 3.4763 |
| 7 | 36.550 | 3.50953 | 3.16553 |
| 8 | 40.450 | 3.50953 | 3.16553 |
| 9 | 44.350 | 3.50953 | 3.16553 |
| 10 | 50.350 | 2.92605 | 2.58205 |
| 11 | 54.950 | 3.03611 | 2.69211 |
| 12 | 59.550 | 3.03611 | 2.69211 |
| 13 | 64.050 | 3.25808 | 2.91408 |
| 14 | 68.550 | 3.25808 | 2.91408 |
| 15 | 73.050 | 3.25808 | 2.91408 |
| 16 | 77.550 | 3.25808 | 2.91408 |
| 17 | 82.050 | 2.93288 | 2.20382 |
| 18 | 86.550 | 2.93288 | 2.20382 |
| 19 | 91.050 | 2.93288 | 2.20382 |
| 20 | 95.550 | 2.93288 | 2.20382 |
| 21 | 100.050 | 2.93288 | 2.20382 |
| 22 | 104.550 | 2.69057 | 1.96589 |
| 23 | 109.250 | 2.61352 | 1.90023 |
| 24 | 113.950 | 2.61352 | 1.90023 |
| 25 | 119.950 | 2.31568 | 1.7061 |
| 26 | 124.450 | 2.69057 | 1.96589 |
| 27 | 129.150 | 2.61352 | 1.90023 |
| 28 | 133.650 | 2.01269 | 1.67046 |
| 29 | 138.150 | 2.01269 | 1.67046 |
| 30 | 142.650 | 2.01269 | 1.67046 |
| 31 | 147.150 | 2.01269 | 1.67046 |
| 32 | 151.650 | 1.49675 | 1.32245 |
| 33 | 156.150 | 1.49675 | 1.32245 |
| 34 | 160.650 | 1.49675 | 1.32245 |
| 35 | 165.150 | 1.49675 | 1.32245 |
| 36 | 169.650 | 1.38933 | 1.34231 |
| 37 | 174.150 | 1.38933 | 1.34231 |
| 38 | 178.850 | 1.36303 | 1.321 |
| 39 | 183.550 | 1.36303 | 1.321 |
| 40 | 189.550 | 1.28525 | 1.258 |
| 41 | 194.250 | 1.36303 | 1.321 |
| 42 | 198.750 | 1.36303 | 1.321 |
| 43 | 203.250 | 1.36303 | 1.321 |
| 44 | 207.750 | 1.36303 | 1.321 |
| 45 | 212.250 | 1.20777 | 1.13839 |
| 46 | 216.750 | 1.20777 | 1.13839 |
| 47 | 221.250 | 1.15089 | 0.99864 |
| 48 | 226.250 | 1.15089 | 0.99864 |
| 49 | 231.250 | 0.95267 | 0.93592 |
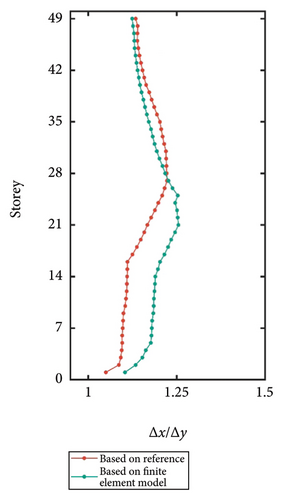
To enhance the reliability of stiffness calculations, this research developed a fiber-based core wall numerical model in the OpenSees software. Beams and columns were simulated using force-based Force Beam Column elements, with material models Concrete02 and Steel02 from OpenSees. Shear walls were modeled using the ShellMITC4 element suitable for simulating plane stress, combined with Concrete02 and Steel02 material models to capture their nonlinear behavior. Using this model, stiffness values for each storey were computed. Subsequently, longitudinal-to-transverse displacement ratios for each storey were calculated using equation (17) and compared against results from equation (15), as shown in Figure 6. The orange line represents axial displacement ratios derived from stiffness calculations based on literature knowledge, while the green line represents axial displacement ratios derived from stiffness calculations using finite element models. The calculation results indicated a 9.53% error between the two, suggesting that the stiffness values calculated based on literature are relatively reliable and can serve as a basis for computing longitudinal-to-transverse displacement ratios.
5.2. Preparation and Preprocessing of Data
The radar dataset used in this study was acquired from the Sentinel-1 constellation, which was designed as a dual-satellite system. Sentinel-1 constellation offers a single satellite revisit period of 12 days [24], which can theoretically be reduced to 6 days with dual satellites functioning concurrently [45]. The radar operates in the C-band, and the image data utilized in this study is acquired in Interferometric Wide Swath (IW) mode, which creates images with a 250 km swath at 5 × 20 m spatial resolution.
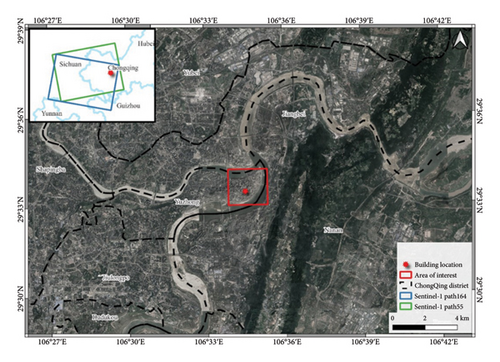
This study focuses on Tower 2 of YIFC, utilizing 283 Sentinel-1A satellite images, comprising 90 ascending 55 track (A-55 Track) images and 93 descending 164 track (D-164 track) images, The temporal coverage of A-55 Track and D-164 Track are 20180509-20210529 and 20180504-20210524, respectively. The parameter information such as the incident angle and azimuth angle of the ascending and descending tracks can be obtained from radar imaging data. Specifically, for the ascending satellite, the flight azimuth angle is 12.68°, while the radar incidence angle is 44.01°. While for the descending satellite, the flight azimuth angle is 167.30°, corresponding to a radar incidence angle of 32.55°. The relationship between the coverage area of the Sentinel-1A image and the location of the research area on ascending and descending tracks is illustrated in Figure 7. The green box indicates the coverage area of path A-55, while the blue box represents the coverage area of path D-164. And the red star denotes the location of the Tower 2 of TIFC.
5.3. Time Series Analysis Using PS-InSAR
This study applied the PS-InSAR [46] to conduct a sequence of data processing on the SAR images of the study region. This study selected multiple radar images that covered the same geographic area and had good temporal distribution. These images were then precisely aligned to ensure geometric consistency among them. Next, permanent scatterers were identified, which are points with stable reflective characteristics over time. Then perform coherent point processing on these scatterers to generate a series of differential interferograms. Adaptive nonlocal InSAR filtering [47] was applied to eliminate certain noisy phases, thereby enhancing the signal-to-noise ratio and improving the clarity of interference fringes. By analyzing these filtered interferograms, this study calculated the relative deformation information of the buildings while removing noise such as atmospheric delays and orbital errors. Phase unwrapping was performed using the Discrete Minimum Cost Flow (DMCF) [48] method.
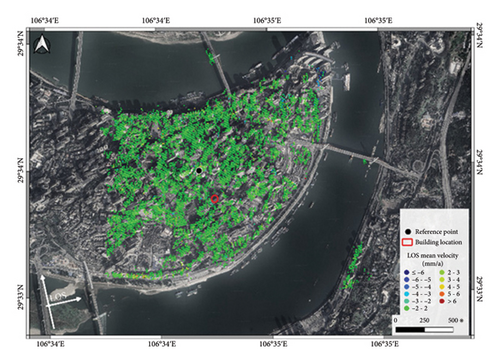
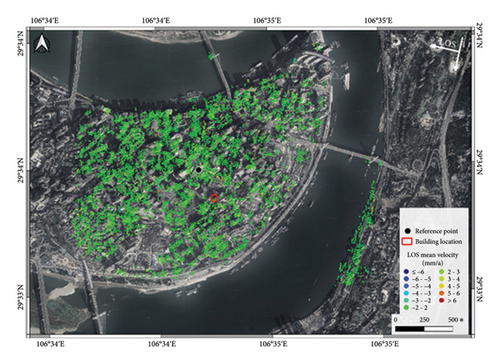
Following this, the calculation of the differential interferogram after unwrapping was conducted to derive displacement information of the building. Subsequently, geocoding [49] was executed to map the displacement onto the diagram, resulting in the acquisition of the mean displacement rate distribution diagram of the study area along LOS of two tracks, as depicted in Figure 8. The red box indicates the location of Tower 2 of YIFC. This series of meticulous processing steps furnishes reliable data support for research.
5.4. Obtaining 3D Deformation of Buildings From 2018 to 2021
Simultaneously, this research used the structural layout plan (Figure 5(b)) of Tower 2 of YIFC to calculate the lateral stiffness of each floor’s major and minor axes, and determined the displacement rate of the major and minor axes at the top of the building to be 1.1338. Furthermore, based on an actual measurement yielding an angle of β = 11.25°, the 3D displacement extraction model (Figure 3) was applied to obtain 3D displacement information of Tower 2 of YIFC. The 3D displacement map of the top of Tower 2 of YIFC is illustrated in Figures 9(a), 9(b), and 9(c). This comprehensive analysis method not only facilitates a deeper understanding of the displacement behavior of urban infrastructure but also furnishes a reliable scientific basis for disaster risk assessment and urban planning.
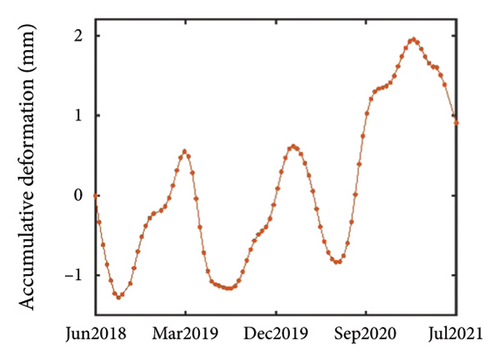
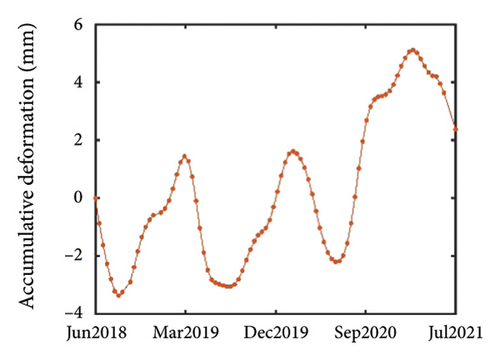
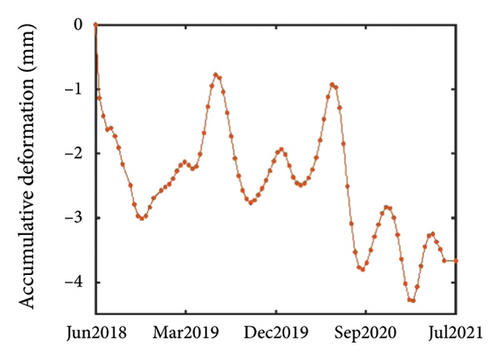
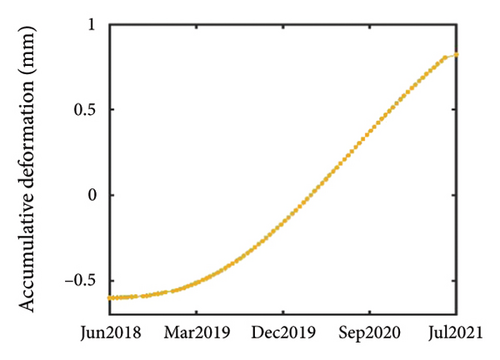
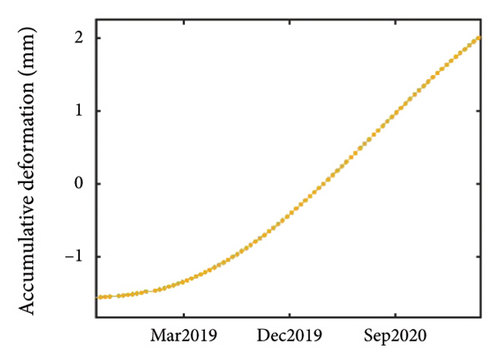
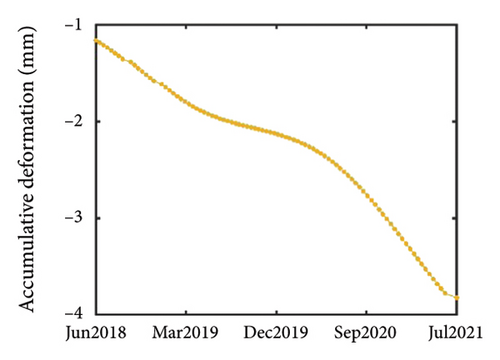
It is evident that the building’s displacement exhibits periodic behavior, consistent with the principles of thermal expansion. Specifically, the building’s displacement changes periodically with the cyclical variations in temperature. Therefore, EMD was used to process the 3D displacement of the top of the building to eliminate periodic displacement caused by temperature effects, thereby generating more reliable trend displacement.
The trend displacement results obtained after EMD processing of the building are depicted in Figures 9(d), 9(e), and 9(f). It is evident that the overall trend of the building is sinking, with continued settlement over time. Moreover, the displacement in both the major and minor axes of the building demonstrates a consistent increasing trend. These trends collectively suggest that the building is continuously tilting in one direction. This observation could stem from inherent design issues within the building [50], resulting in uneven settlement, or from directional deformations induced by environmental factors such as prevailing wind direction in the building’s vicinity [3, 51, 52]. After considering various factors such as periodic displacement and increased settlement, it can be concluded that the trend displacement results obtained through this research method are reasonable and accurately reflect the actual displacement of buildings over the time series intervals.
6. Discussion
The existing monitoring methods for building structures require professional equipment and technical support [12], and a significant amount of human resources and time [53] for installation, measurement, and data processing. They are costly and cannot obtain real-time or continuous displacement data. InSAR can compensate for the shortcomings of traditional methods and provide a low-cost method for long-term continuous monitoring. Additionally, by introducing domain knowledge of architecture and establishing constraints between north-south and east-west displacement of buildings, this study can overcome the technical limitations of InSAR’s insensitivity to north-south displacement monitoring. This enables InSAR to be successfully applied to 3D displacement monitoring of buildings.
It can be noted that several improvement approaches should enhance the 3D displacement extraction model’s ability to monitor more accurate building displacements in the future. Firstly, the low resolution of Sentinel-1A satellite, with a spatial resolution of 5 by 20 m, limits more the precise monitoring of buildings. The displacement of the building obtained in this study is only the trend displacement of the top of the building, and accurate displacement information of various parts of the building cannot be obtained. This limitation arises from the satellite’s resolution, which is insufficient for detecting fine details of building movements. Using higher resolution satellite data will help improve the observation accuracy and detail capture ability of our model for building displacement; Secondly, the insufficient accuracy of the prior model established by embedding domain knowledge has increased the uncertainty of monitoring results. When establishing the prior model, this research employed the ELFM based on certain assumptions, which inevitably affects the accuracy of the results. Additionally, due to limitations in research conditions, only the structural plan of the building to be monitored can be obtained, resulting in limited accuracy in calculating the lateral stiffness. While new constraints are introduced for the model, they still impact the accuracy of the extracted 3D displacement in the horizontal direction. Utilizing the finite element models that can simulate the real load conditions of buildings [54] or actual measured data to obtain more precise main and minor axis displacement relationships can offer more accurate constraint conditions for the 3D displacement extraction model.
This paper successfully decoupled the 3D displacement of the building through the introduction of a prior model. The initial implementation of this method in buildings has allowed us to surmount the technical constraints of InSAR, achieving non-contact, long-term, and cost-effective 3D displacement monitoring. While current accuracy levels have not yet reached their peak, this method introduces a novel approach to monitoring building displacement in three dimensions. Meanwhile, our approach further expands the application potential of InSAR technology, demonstrating its capability to improve the efficiency of building health assessments, offering valuable support for urban safety and sustainability. Furthermore, this methodology holds potential for infrastructure maintenance, enabling the monitoring of urban infrastructure over time.
7. Conclusions
This study introduces a novel approach for monitoring the 3D deformation of super high-rise buildings, which combines InSAR technology and physical prior models. Specifically, the study utilizes PS-InSAR technology to process Sentinel-1 ascending and descending SAR data in the study area, extracting one-dimensional deformation of the building in the LOS direction on different tracks. Based on these deformations, the study calculates 2D deformation of the building in the east-west and vertical directions. Subsequently, leveraging the prior model of the building, the study estimates the ratio of major and minor axis deformation and integrates it with the 2D deformation data obtained from InSAR to derive the 3D deformation of the building. Furthermore, the article provides detailed implementation steps of this method to facilitate researchers in applying it to building monitoring. As an empirical study, a super high-rise building in Chongqing, China, serves as a case study, demonstrating the effectiveness of the proposed method.
Additionally, the study examines the feasibility and limitations of using InSAR technology for monitoring super high-rise buildings, emphasizing the crucial role of physical prior models in compensating for monitoring limitations. While the approach offers a promising avenue for 3D deformation monitoring, the accuracy of the monitoring data in this instance is limited due to factors such as the relatively low resolution of Sentinel-1, which can affect the precision of the observed deformation. To address these challenges, future research directions include the use of higher resolution satellite data to improve observation accuracy and detail capture ability, as well as the development of more accurate prior models. Furthermore, due to the lack of long-term monitoring data for buildings in the current study, we plan to select specific buildings for long-term monitoring in the future to further validate our approach and continue the sustained research and exploration of this methodology. This is expected to provide more reliable data support for the structural health monitoring and safety assessment of urban buildings.
In summary, this study contributes valuable insights into 3D deformation monitoring of super high-rise buildings, offering valuable experience and reference for future research in the field. Despite current technical challenges, ongoing advancements in remote sensing technology are expected to enhance the accuracy and reliability of monitoring results, thereby improving urban safety and sustainability.
Conflicts of Interest
The authors declare no conflicts of interest.
Funding
The authors express their sincere gratitude for the financial support received from the Project of National Key Research and Development Program of China (Grant No. 2022YFC3803000), the National Natural Science Foundation of China (Grant No. 52361135806), and the Fundamental Research Funds for the Central Universities.
Acknowledgments
The authors express their sincere gratitude for the financial support received from the Project of National Key Research and Development Program of China (Grant No. 2022YFC3803000), the National Natural Science Foundation of China (Grant No. 52361135806), and the Fundamental Research Funds for the Central Universities.
Open Research
Data Availability Statement
The data that support the findings of this study are available on request from the corresponding author. The data are not publicly available due to privacy or ethical restrictions.


