Numerical Simulations of Shaking Table Tests of Metro-Induced Vertical Vibrations of Interstory-Isolated, Base-Isolated, and Fixed-Base Structures
Abstract
Metro networks have been extensively developed in large cities to satisfy traffic demands. Adjacent to subways, there has been an increasing construction of fixed-base, base-isolated, and interstory-isolated buildings on metro depots. Notably, metro-induced environmental vibrations have led to vibrations in buildings, thus affecting human health and the regular operation of sensitive equipment. Numerical simulations are considered a valuable method for assessing building vibrations. However, research on a generalized numerical simulation strategy for simulating the metro-induced vibrations of the abovementioned three types of buildings remains rare. Hence, this study recommends a generalized numerical simulation strategy and validates it through the comparison between the results of shaking table tests. The acceleration time histories of floor, distributions of the acceleration at different positions on the slab and along the height of the building, and one-third octave band vertical acceleration levels were accurately simulated for the three structures. Meanwhile, the simulation accuracies of three types of damping models were discussed. The relative differences between the simulated and experimental maximum acceleration amplification coefficients and one-third octave band vertical acceleration levels were both less than 4.2%. Furthermore, the influences of the mesh sizes of the elements for the slabs and the parameters of the Rayleigh damping model on the simulated results were investigated. The recommended simulation strategy can contribute to further investigation of the metro-induced vertical vibration assessment of different types of structures.
1. Introduction
With the rapid and integrated development of metro and real estate, significant increases in the construction of residential buildings, commercial buildings, and infrastructure adjacent to railway lines have been observed. These include the interstory-isolated buildings built on metro depots, base-isolated buildings, and fixed-base buildings. Seismic isolation refers to the introduction of a flexible isolation system under traditional seismic-resistant buildings (i.e., fixed-base buildings). This system dissipates seismic energy through large deformations to protect the superstructure from seismic damage [1]. Hence, seismic isolation has been widely used to reduce the seismic responses of structures located in high-seismic regions [2–5]. Various mechanical models for rubber isolators were proposed to conduct numerical analyses of isolated structure [6–9]. Although the selection of structural systems is mainly determined by seismic performance requirements, the vibrations in these buildings induced by metros have recently become a critical issue. This is attributed to the fact that these undesirable vibrations are harmful to human health and may affect the regular operation of some sensitive equipment [10–12]. To mitigate metro-induced vibrations in buildings, the first issue required to be carefully addressed is the accurate assessment of such vibrations.
Field and shaking table tests are well acknowledged as effective methods for evaluating the vibration performance of structures. Various field tests have indicated that metro-induced vibrations are primarily vertical vibrations of floor slabs [13–17]. From the literature review, it can be seen that the evaluation of the vibration of slabs currently emphasizes the distribution of vibrations at different positions of the slab at the same story, the distribution of vibrations along the height of the building, and the maximum acceleration amplification effect. Through field tests, Cao et al. [18] and Tao et al. [19] found that the vibration level at the center of the floor slab was larger than that at the edge of the floor slab. Xia et al. [20] conducted field tests on metro-induced vertical vibrations of two 5-story masonry structures and found that the vibration responses increased along the height of the building. The vibration level of a 12-story reinforced concrete (RC) frame structure, tested by Cao et al. [21], increased from 1st floor to 5th floor, then decreased from 6th floor to 9th floor, and then slightly increased again from 9th floor to 12th floor. The maximum vibration response occurred at 5th floor. Because of the rapid transit-oriented development, isolation has been widely used in regions with high seismic risk. Zhou et al. [22] conducted field tests on a 15-story interstory-isolated building, and a relatively uniform distribution of vertical vibration was observed along the height of the building. 1/30 scaled shaking table tests were conducted for a 36-story building built on a metro depot with and without isolation system [23, 24]. They found that the vertical vibration of the floor in uncontrolled structure increased with the rise of the floor. Such amplification effect of vertical vibration was effectively suppressed by the introduction of the isolation system. The acceleration amplification coefficient (AAC) of the interstory-isolated structure (IIS) was 1.2–2.2. Despite these research efforts, comparisons between IIS, base-isolated structure (BIS), and fixed-base structure (FBS) are preferred to be conducted to systematically identify the significant difference in vertical vibration characteristics, which can assist in the vibration assessment of these structures adjacent to subway lines.
Numerical simulation is considered as an effective alternative method for assessing the dynamic responses of structures, and a well-calibrated numerical simulation method can facilitate the comprehensive comparison and design of different types of structures to control these responses. For high calculation efficiency, simplified models were widely used to predict the structural vibration responses under metro-induced vibrations. Zhou et al. [25] used a simplified multi-degree-of-freedom model to simulate a 15-story IIS. Sanayei et al. [26] developed an impedance-based analytical model of FBSs. However, these models cannot simulate the distribution of vertical vibrations at different slab positions and then cannot identify the vibration levels in the different rooms of residential buildings [27]. To address this issue, three-dimensional refined numerical models were developed. Foutch et al. [28] suggested a refined numerical model of highway sign structures for computing the response of this kind of structure to natural wind and truck-induced wind gust loads. The numerical model well revealed the actual natural periods and dynamic responses of the structure. Guo et al. [29], Shi et al. [30], Lopes et al. [31, 32], Farahani et al. [33], Ibrahim and Nabil [34], and Sadeghi et al. [35] established refined numerical models for fixed-base buildings to simulate the vibration responses of buildings. The responses were compared between test and simulated results with good agreement. However, the influence of the critical modeling parameters (e.g., the mesh size of the element and the parameters of the damping model) of the refined model was not discussed. Through a refined simulation of a four-story FBS, Sanayei et al. [36] identified that the mesh size has a significant influence on the predicted vertical vibration of slabs. However, research efforts are yet to focus on generalized refined simulation strategy for different types of structures. Furthermore, the validation of the simulation strategy is needed to cover the distribution of vibrations at various positions on the slab on the same story and the distribution of vibrations along the height of the building.
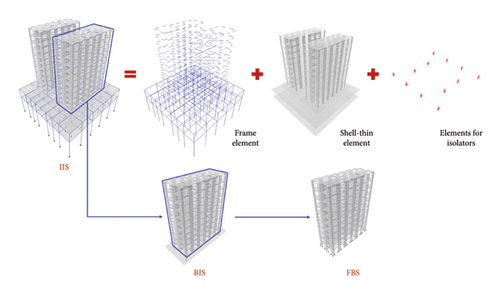
To address these issues, numerical simulations of metro-induced vertical vibrations of IIS, BIS, and FBS were conducted. Based on shaking table tests of three structures with identical main towers, a generalized numerical simulation strategy is recommended for simulating vertical vibrations of the structures. Section 2 briefly introduces the information obtained from the three shaking table tests. Section 3 compares a generalized simulation strategy using different damping models and validates it through the comparison between the simulated and experimental acceleration time histories, AACs, and one-third octave band vertical acceleration levels, emphasizing the distribution of vibrations at different positions of the slab and along the height of the building. Subsequently, the effects of the mesh sizes of the elements for the slabs and the parameters of the Rayleigh damping model on the simulated results are investigated in Section 4. The research outcome can contribute to further investigation for the metro-induced vertical vibration assessment of different types of structures.
2. Brief Introduction of Shaking Table Tests
2.1. Dimensions and Material Properties
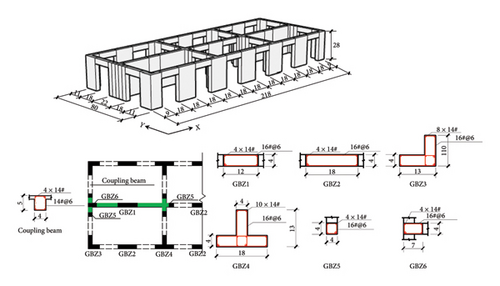
Shaking table tests of three structures, including an IIS, a BIS, and a FBS, were conducted under metro-induced vertical vibrations. The FBS, upper structure of the BIS, and towers of the IIS adopted the same ten-story RC shear wall structure. The large chassis of the IIS was two-story RC frame structure. The length scale factor (Sl) of the three structures was determined to be 1/10 based on the dimensions and weight capacity of the shaking table. Because particulate concrete was used to simulate the concrete, 1/4 was used for the elastic modulus scale factor (SE) and stress scale factor (Sσ). The acceleration scale factor (Sa) was taken as 2, considering the seismic intensity of structure and maximum horizontal acceleration of the shaking table. Subsequently, other similitude ratios were calculated using the magnitude analysis method [37], as presented in Table 1.
| Variables | Scaling law | Similitude ratio |
|---|---|---|
| Length (l) | Sl | 0.1 |
| Stress (ε) | Sε | 0.25 |
| Strain (σ) | Sσ | 1 |
| Elastic modulus E | SE | 0.25 |
| Density (ρ) | Sρ | 1.25 |
| Acceleration (a) | Sa | 2 |
| Mass (m) | 0.00125 | |
| Stiffness (k) | Sk=SE·Sl | 0.025 |
| Time (t) | 0.224 | |
| Frequency (f) | 4.4723 |
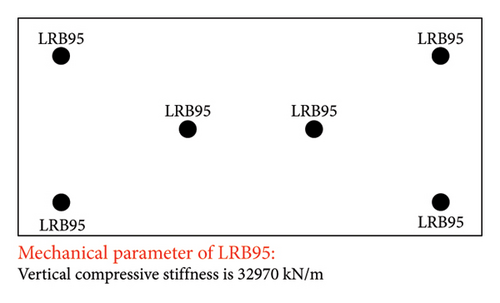
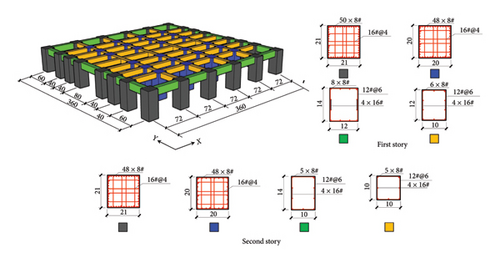
The three tested structures are illustrated in Figure 1(a). Each story of tower has a height of 28 cm, as shown in Figure 1(b). The shear wall thickness and cross-sectional dimension of coupling beams were 4 cm and 4 cm × 5 cm, respectively. The heights of the isolation system of BIS and IIS were both 24 cm. Six lead–rubber bearings with an effective diameter of 95 mm (denoted as LRB95 hereafter) were arranged at the two middle positions and four corners of the isolation system, as shown in Figure 1(c). The heights of the first and second stories of large chassis were 105 and 53.5 cm, respectively, as shown in Figure 1(d). The cross-sectional dimensions of the side (marked in gray) and middle columns (marked in blue) were 20 cm × 20 cm and 21 cm × 21 cm, respectively. The cross-sectional dimensions of the outer (marked in green) and inner beams (marked in yellow) for the first story of the large chassis were 10 cm × 12 cm and 12 cm × 14 cm, respectively, and those for the second story of the large chassis were 10 cm × 10 cm and 10 cm × 14 cm, respectively. The reinforcement details of the structures are also shown in Figure 1. The self-masses for each story of the tower, slab of the isolation system, first story of the chassis, and second story of the chassis were 0.22, 1.794, 6.53, and 4.23 tons, respectively. Meanwhile, 0.18, 3.21, and 2.86 tons are added to each floor slab of one tower, the first story of the chassis, and the second story of the chassis to reach the expected masses, respectively.
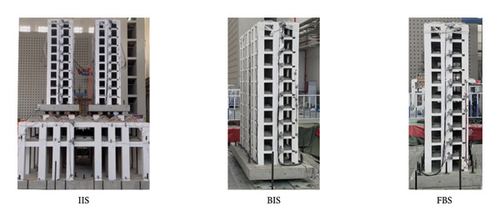
Particulate concrete and galvanized iron wire were adopted in the scaled structure to simulate the concrete and rebar in the prototype structure. During the casting of the scaled structure, three 150 mm × 150 mm × 150 mm cubic particulate concretes and three 150 mm × 150 mm × 300 mm prismatic particulate concretes were reserved for each story to obtain the corresponding compressive strength and elastic modulus, respectively. The photos of the construction of the test model and tested average material properties are shown in Figure 2.

2.2. Test Procedures and Instrument Arrangement
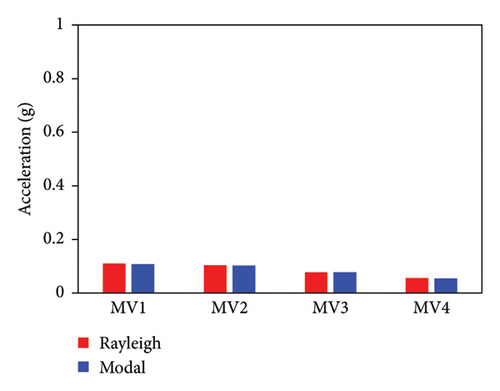
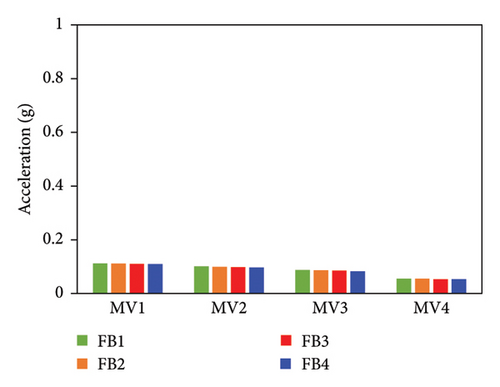
Shaking table tests of each structure were sequentially conducted under metro-induced vertical vibrations with three peak accelerations of 0.3, 0.5, and 0.7 m/s2. Four vertical metro-induced vibrations (MV1, MV2, MV3, and MV4) obtained from the field tests were used as the input, and the corresponding normalized acceleration time histories are presented in Figure 3. White noise tests were conducted for the IIS, BIS, and FBS before the vibration tests and between two successive loading conditions. The vertical periods and corresponding damping ratios of the three structures were calculated using frequency response functions and half power broadband method [38]. The initial first-order vertical periods of the IIS, BIS, and FBS were 0.037, 0.033, and 0.013 s, respectively. The corresponding damping ratios are 2.0%, 4.8%, and 1.2%. Throughout the tests, variations in the dynamic properties were negligible.
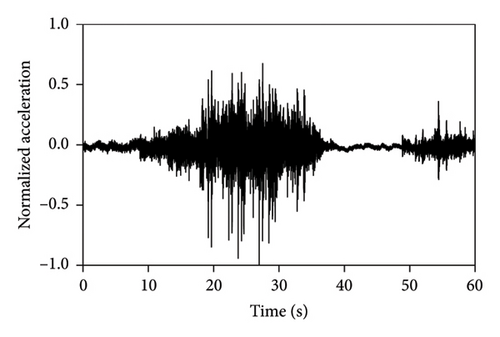
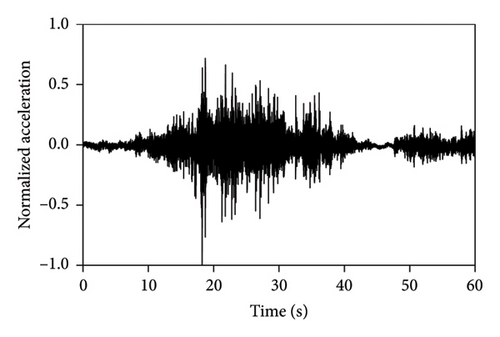
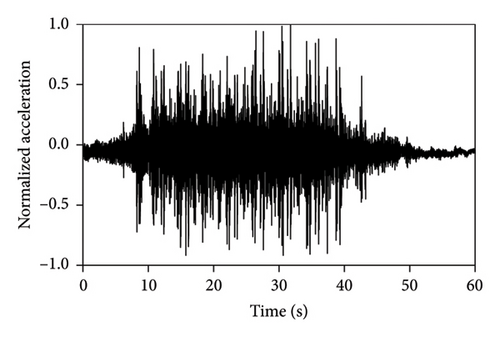
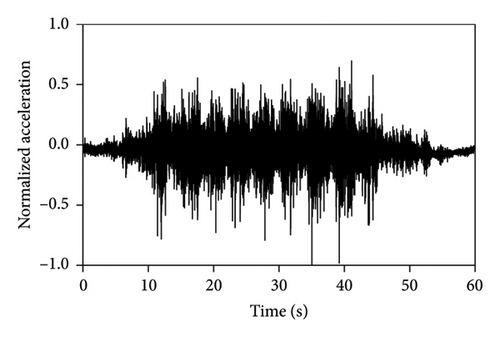
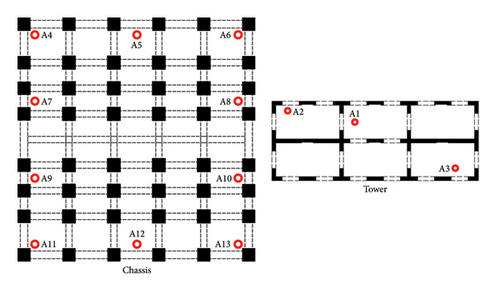
Figure 4 shows the layout of the acceleration sensors in the tower and chassis. Three-axis acceleration sensors were used to monitor the vertical and horizontal accelerations of the floor slab. Ten sensors are placed on each floor of the chassis. Three sensors were arranged on each floor of the tower, including two sensors at the corners of the floor slab and one sensor at the central part of the floor slab, to identify the differences in vertical vibrations along the height of the structure and at different positions of the slab.
3. Comparison of Experimental and Simulated Results
3.1. Numerical Models
| Structure | Simulated value (s) | Test value (s) | Relative error (%) |
|---|---|---|---|
| FBS | 0.0131 | 0.013 | 0.8 |
| BIS | 0.034 | 0.033 | 6.0 |
| IIS | 0.038 | 0.037 | 2.7 |
3.2. Influence of Different Damping Models
Rayleigh damping and modal damping models are two widely used damping models [38]. To identify the influence of damping models on the simulated vibration responses, each structure was modeled using both damping models. Because the damping ratios of the tower, isolator, and large chassis were different, the BIS and IIS were also modeled using the distributed modal damping, in which the damping ratios of towers, large chassis, and isolators were separately defined.
For the Rayleigh damping model, the corresponding mass and stiffness coefficients were calculated using first-order vertical frequency, the vertical frequency corresponding to a mode participating mass ratio of 90%, and the measured structural damping ratio. For the modal damping model, the damping ratio for all modes adopted the damping ratio of first-order mode. For the distributed modal damping model, the damping ratios of towers and large chassis adopted 1.2% and 1.6%, which were obtained from analyzing the results of white noise tests of the tower and chassis. Because the vertical acceleration frequency spectra of the top slab of top story and isolation system were basically identical for FBS, the damping ratio of the isolators is therefore simply considered equal to the damping ratio of the entire structure, which is 4.8%.
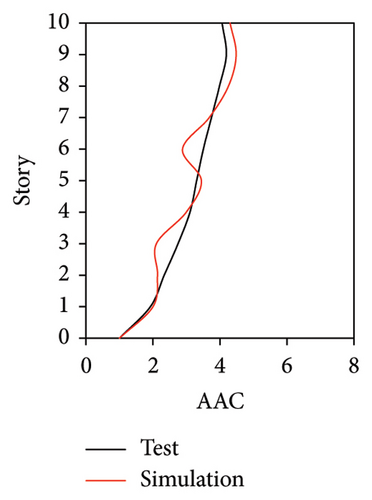
During the tests, the vertical accelerations of FBS measured at points A1, A2, and A3 exhibited significant differences. The average maximum vertical acceleration at point A1 (center of the slab) was 32% and 20% larger than those at points A2 and A3 (corners of the slab), respectively. Meanwhile, the AACs generally increased along the height of the building, and the maximum AACs were observed on the 9th story. The maximum responses (responses at point A1) of the FBS were selected herein to investigate the influence of different damping models. The simulation results of vertical acceleration at different measured positions will be introduced in Section 3.3. Unlike FBS, the vertical accelerations at points A1, A2, and A3 in the tower of BIS and IIS exhibited negligible differences, and it remained approximately constant throughout the building height, which was attributed to the fact that such vibrations of the slab itself in BIS and IIS were mitigated by the introduction of the isolation system. Hence, only the vertical accelerations at point A1 were adopted for the following analysis and discussions of BIS and IIS. Because the vertical accelerations at all measured points of the chassis in the IIS were basically identical, the vertical accelerations of the chassis were represented by the average values of all the measured points. The simulated AACs using three damping models are compared with experimental data in Figures 7, 8, and 9, in which Rayleigh, modal, and distributed denote the Rayleigh damping model, modal damping model, and distributed modal damping model, respectively.
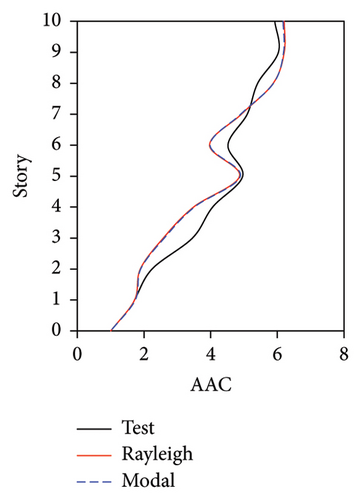
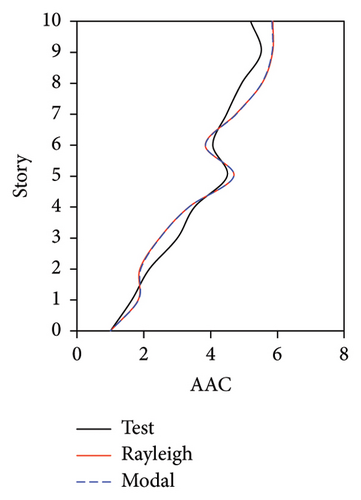
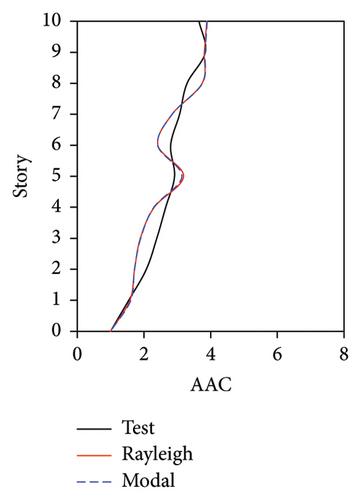
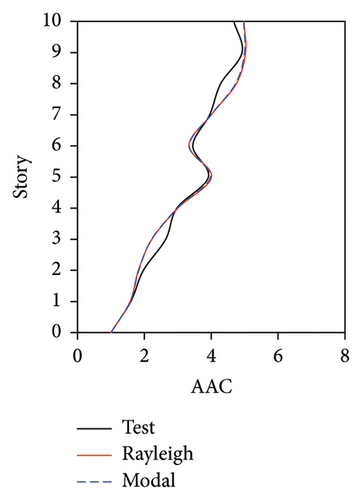
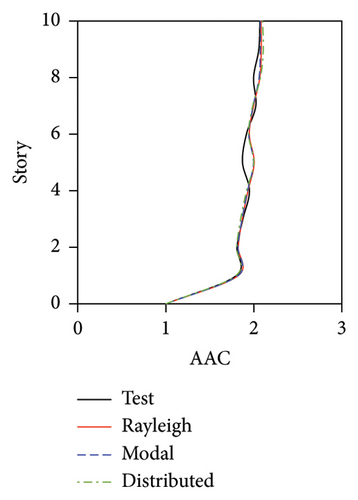
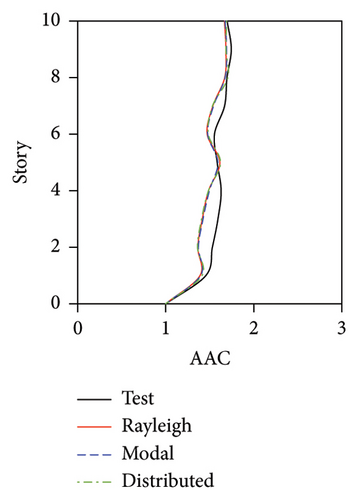
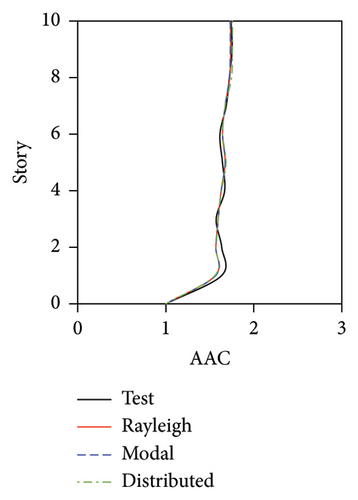
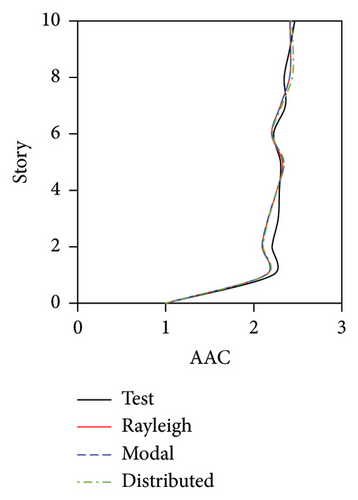
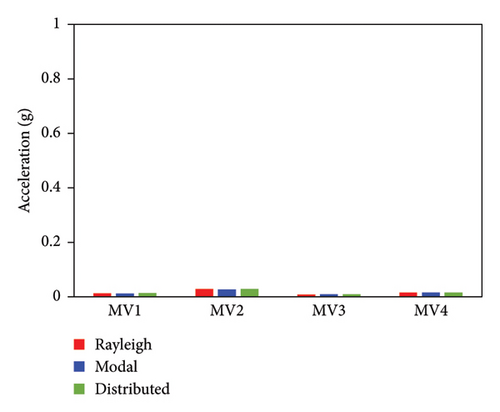
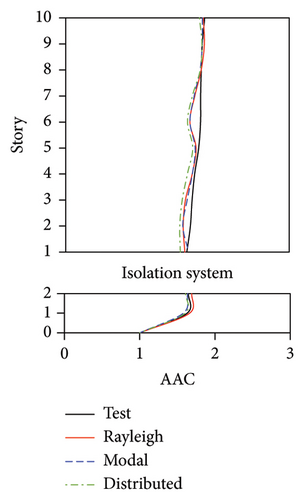
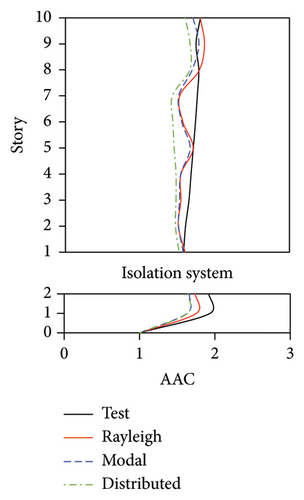
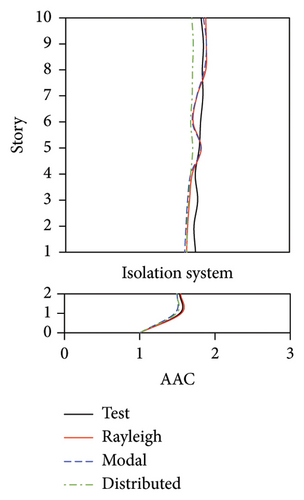
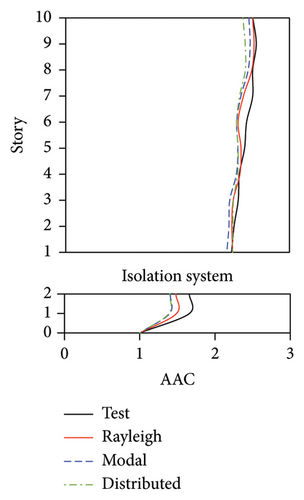
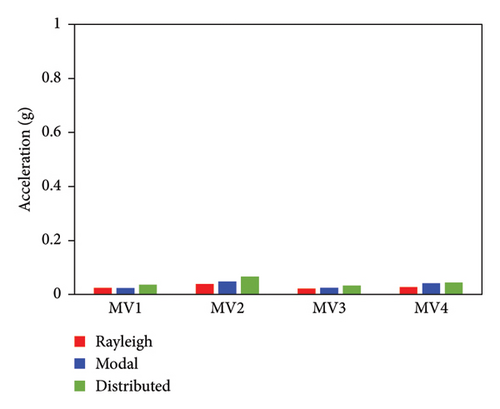
The simulated AACs using three damping models were basically identical, with a relative difference no more than 5%. 2-norm was also calculated to evaluate the error between the simulated and experimental vertical accelerations of three structures. The data also indicate that the simulation results using three damping models were basically identical. The maximum relative errors of simulated and experimental maximum AACs for FBS under the four metro-induced vibrations were 2.9%, 6.1%, 0.6%, and 2.0%, respectively. Those for BIS were 1.5%, 3.5%, 1.2%, and 2.3%, respectively, and those for IIS were 3.7%, 6.8%, 2.2%, and 5.7%, respectively. These results indicated that all of three damping models can well reflect the vibration responses of FBS, BIS, and IIS.
Based on the above discussion, it can be found that three damping models can well simulate the vertical vibrations of the slab of three structures. Meanwhile, the simulation accuracies of three models were basically identical. Hence, if the damping ratios of isolators, large chassis, and towers cannot be obtained, the damping ratio of the entire structure, which can be easily measured, can be used to evaluate the vertical vibration of BIS and IIS using the modal damping model or Rayleigh damping model. Notably, the calculation time of the numerical model using the modal damping model was several times that of the numerical model using the Rayleigh damping model.
3.3. Comparison of Vertical Vibrations of FBS at Different Positions of Slab
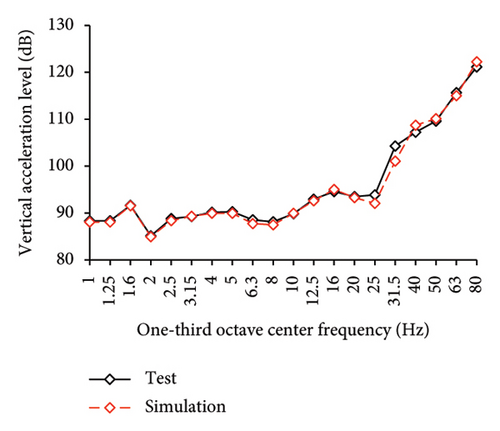
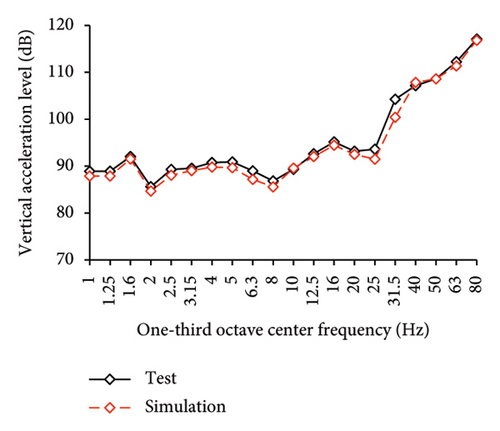
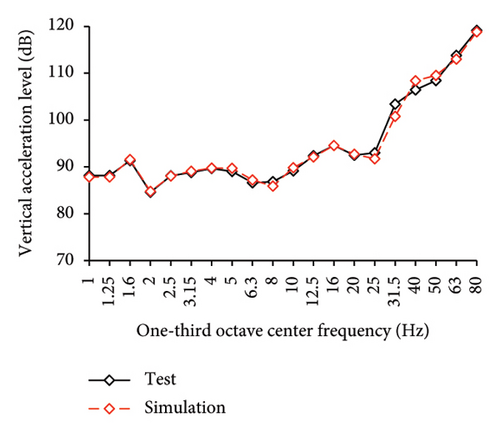
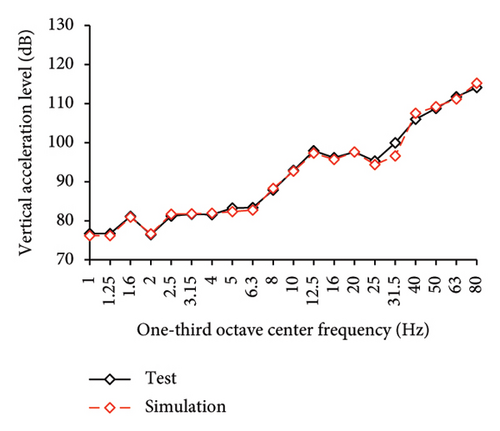
As mentioned above, the AACs of FBS measured at points A1, A2, and A3 exhibited significant differences. Hence, the simulated AACs of FBS at three points of each story were compared with the experimental data. Because relatively small difference was observed among the simulated results of the three damping models at different measured positions, only the simulated results of the Rayleigh damping model are presented in Figures 10, 11, and 12.

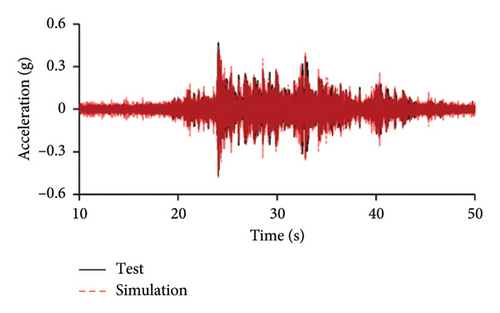
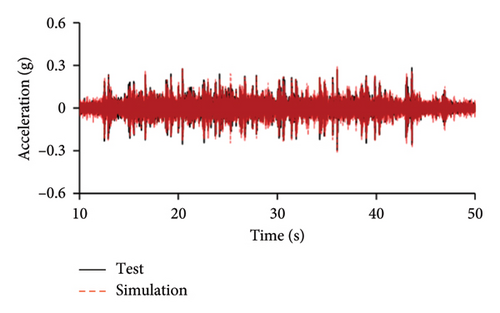
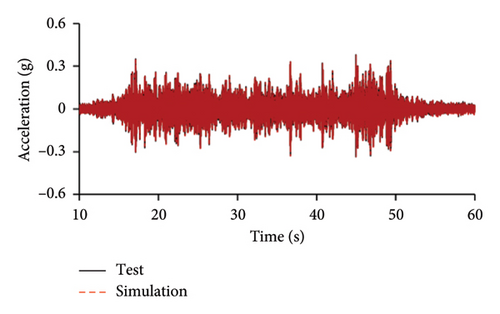
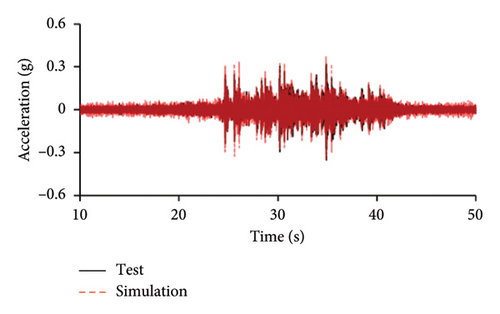
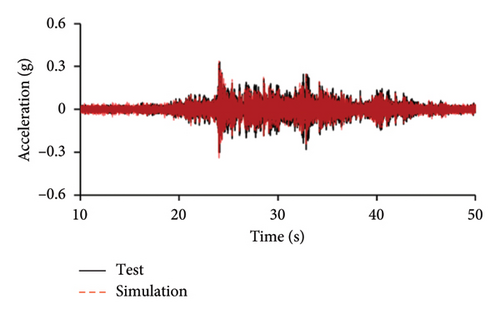
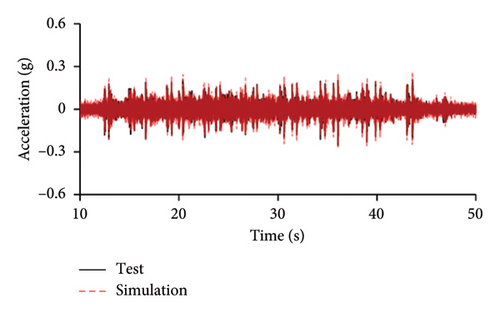
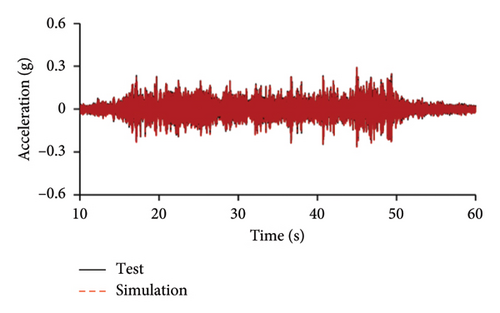
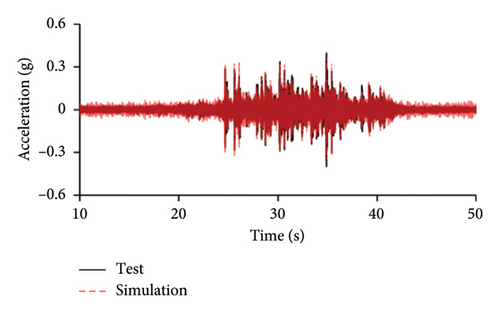
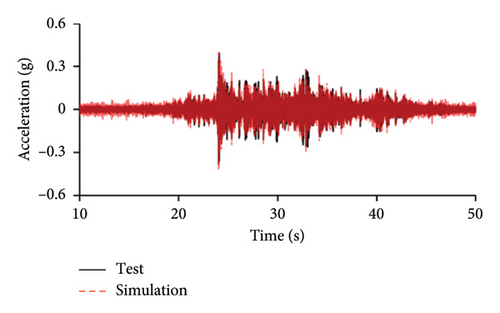
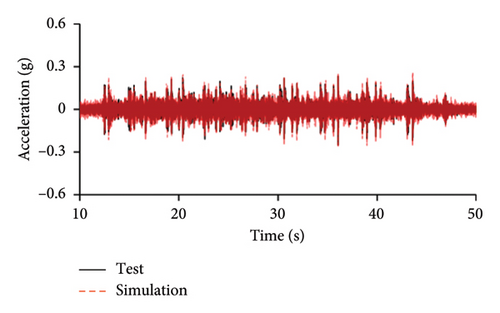
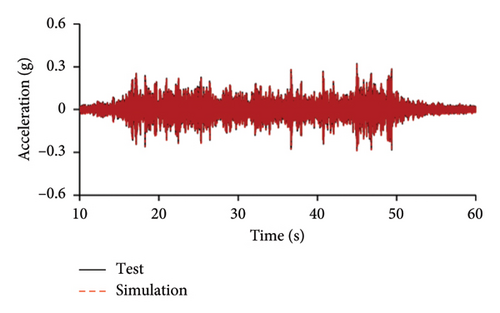
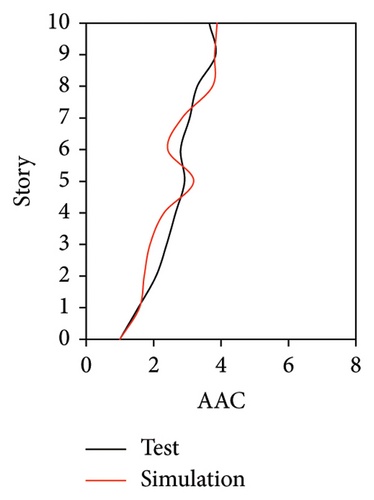

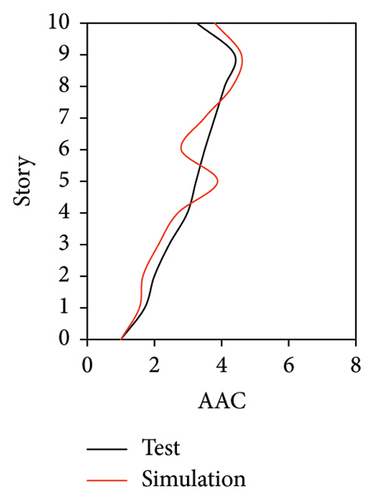
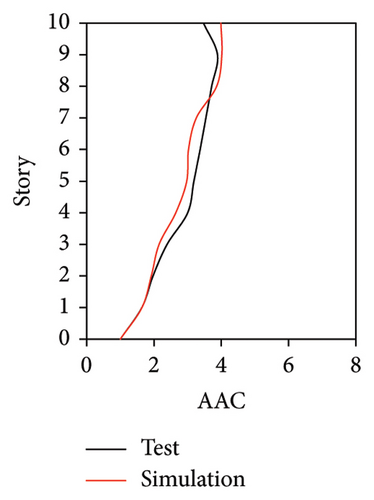
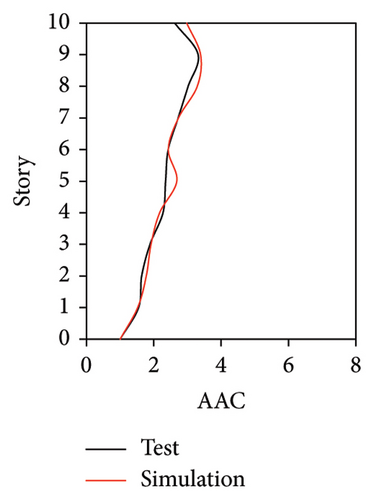
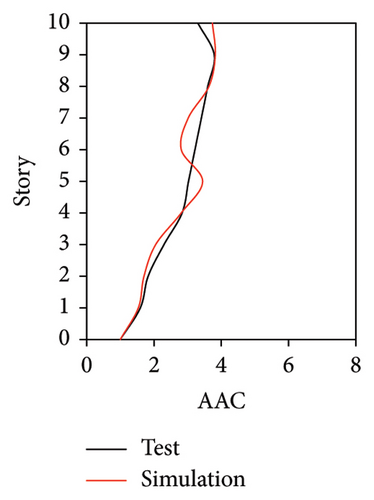
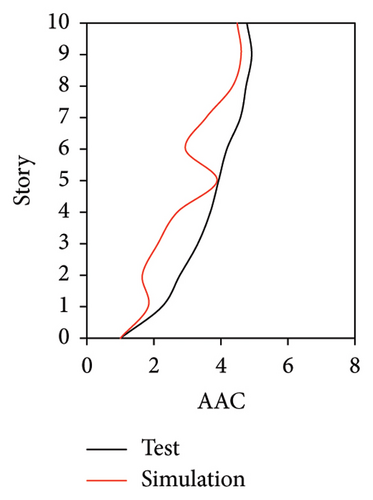
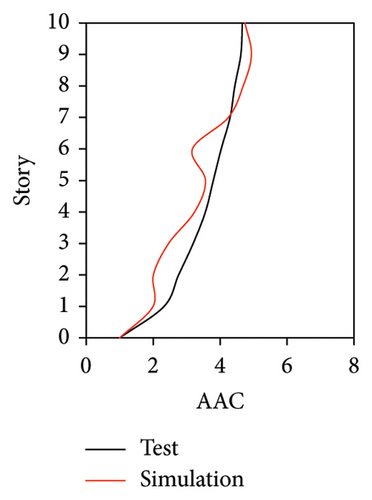
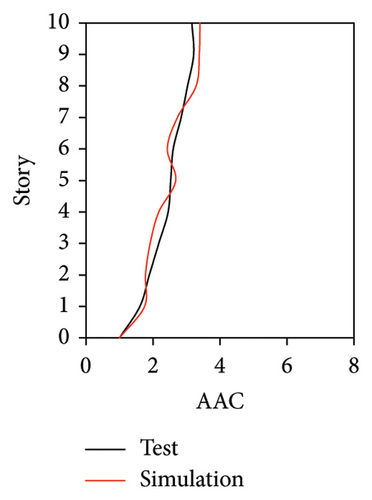
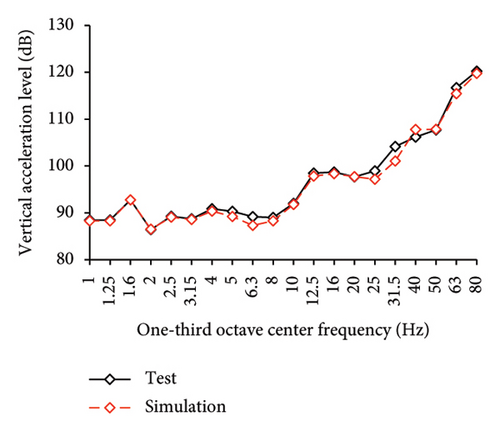
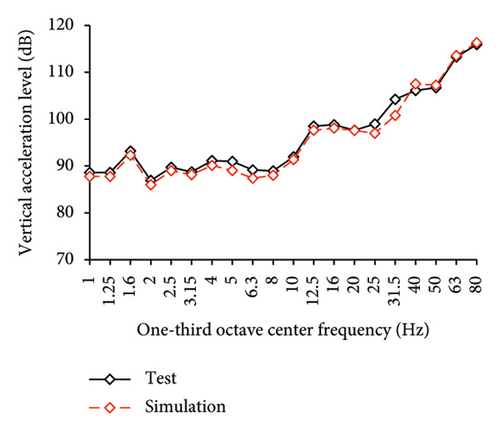
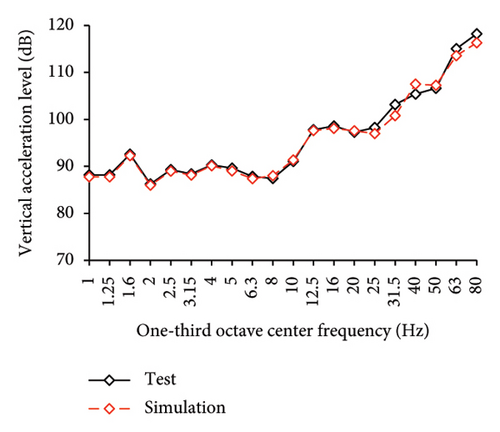
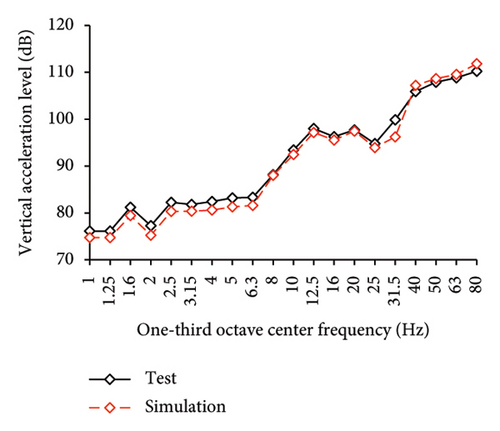
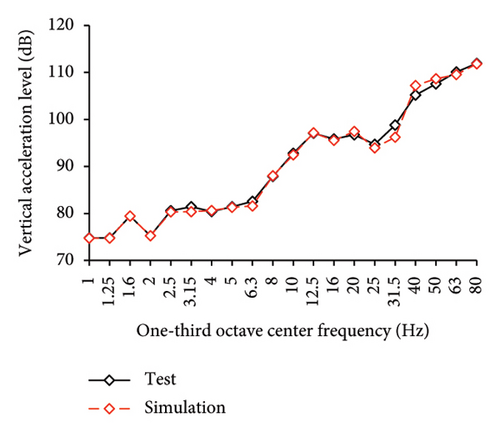
Figures 10 and 11 compare the simulated and experimental results in the time domain. Figure 10 indicates that the simulated acceleration time histories on the 9th story (where the peak acceleration is observed) agree well with those of tests, indicating that the numerical model can simulate the vibration responses of FBS well in the time domain. The simulated and experimental AACs of each floor are compared in Figure 11. The numerical model can generally reflect the differences between the vertical vibrations of the center and corners of the slab and generally simulate the distribution of accelerations along the height of the structure. Although the difference between the experimental and simulated results at point A3 under MV1 is not negligible, the average relative errors of the maximum AACs at points A1, A2, and A3 under four metro-induced vibrations were 2.6%, 2.8%, and 3.2%, respectively, indicating that this simulation strategy can simulate the uneven vibrations of the floor slab of the FBS. The considered difference at the point A3 is caused by the difference between the expected and actual positions of measured points. The vertical vibration of floor slab is large, leading to significant difference in vibration responses at different positions on the floor. Due to the manual installation of the accelerometers, the actual positions of measured points in the test model may deviate from the expected positions. In contrast, the data of numerical simulation are based on the expected positions of measured points. This discrepancy may lead to the difference between experimental and simulated results.
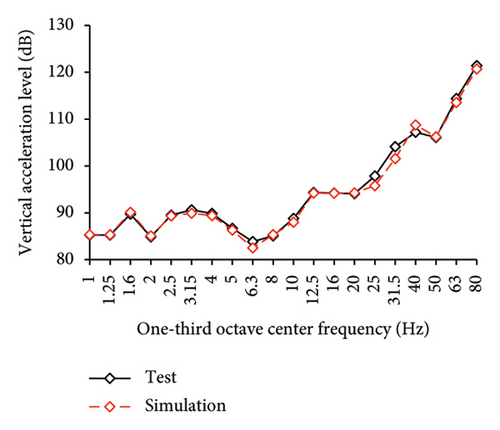
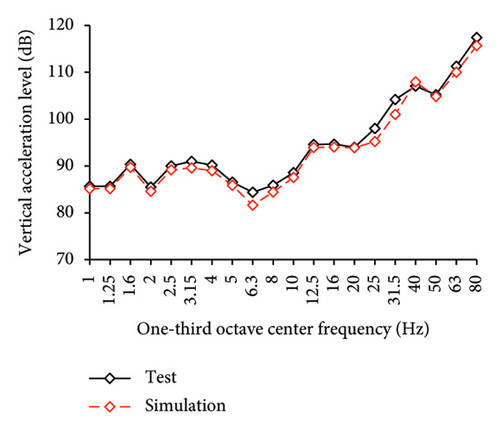
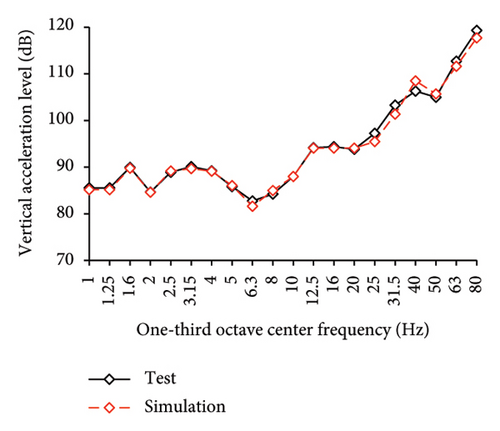
In the frequency domain, the one-third octave vertical acceleration level is often used to evaluate the vibration intensity. Following the Standard for Limits and Measurement Methods of Vibration in the Room of Residential Buildings [27], the one-third octave band vertical acceleration levels of one-third octave band from 1 to 80 Hz were calculated, as shown in Figure 12. The vertical acceleration vibration levels at each one-third octave center frequencies for the numerical model and test are essentially identical. The average relative errors of maximum vertical acceleration level at points A1, A2, and A3 under four metro-induced vibrations were 0.2%, 0.1%, and 1.6%, respectively, indicating that the numerical model can also accurately simulate the vibration intensity in the frequency domain for FBS.
3.4. Comparison of Vertical Vibrations of BIS
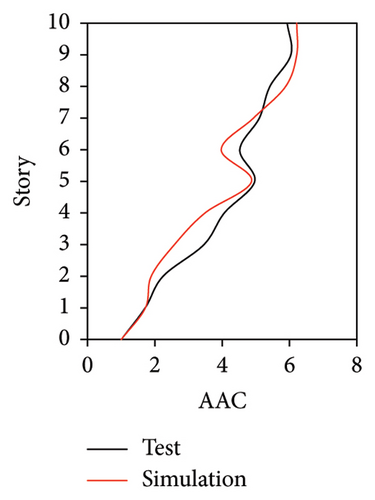
Because the vertical accelerations at points A1, A2, and A3 in the tower of BIS exhibited negligible differences, only the vertical accelerations at point A1 were adopted for the analysis and discussion. The simulated and experimental AACs of each story, acceleration time histories, and one-third octave band vertical acceleration levels of the 9th story of BIS are compared in Figures 13, 14, and 15, respectively. Meanwhile, the AACs of the BIS and the tower in FBS, which are identical structures, are also compared in Figure 14. Notable differences were observed in the AAC distributions along the height of buildings. Specifically, the AACs of the FBS generally increased along the height of structure, and the maximum AAC was observed at the 9th story with a value of 6.0. In contrast, the acceleration amplification effect was significantly reduced for BIS. Two notable characteristics should be emphasized. First, the AACs of the tower in BIS remained approximately constant throughout the height of structure. Second, the maximum AAC of the BIS was only 2.6, which is only approximately 43% of that of the FBS, indicating a good control effect realized on the metro-induced vertical vibration using base isolation.
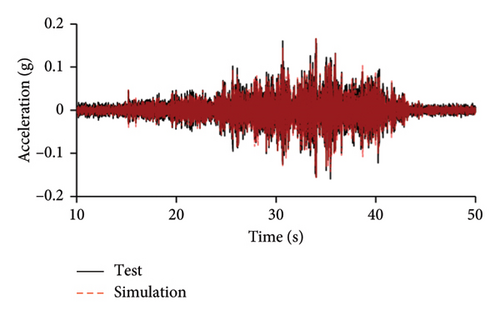
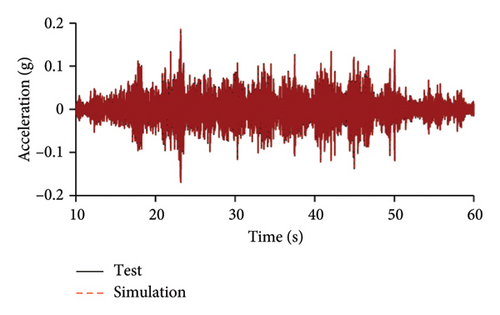
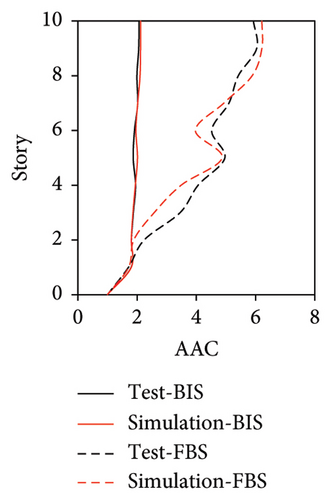
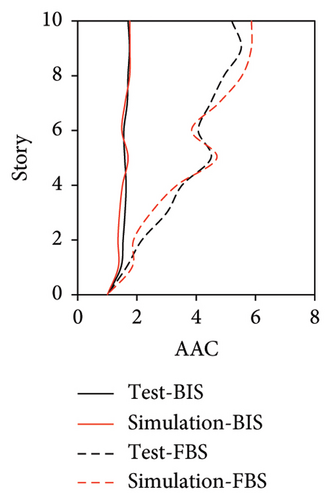
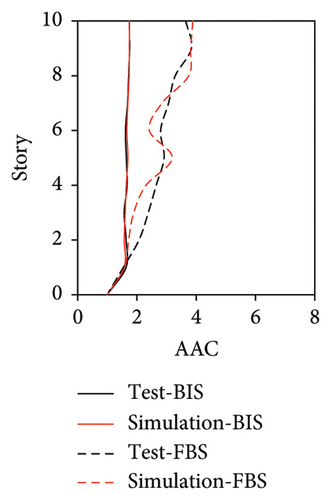
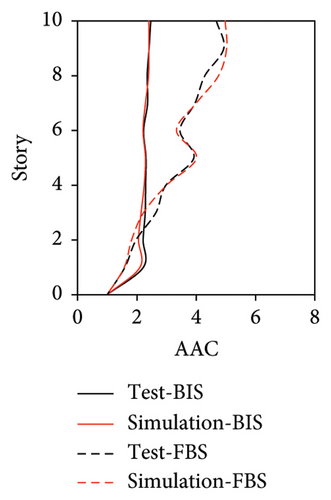
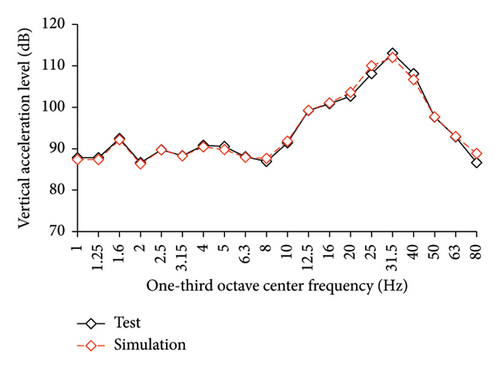
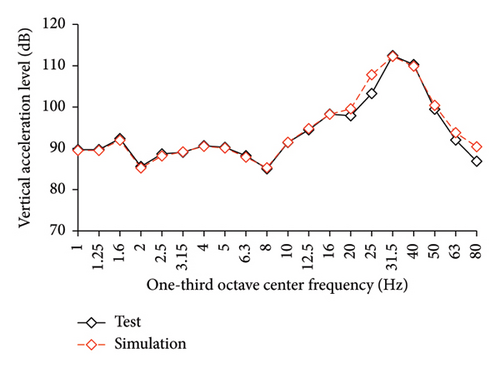
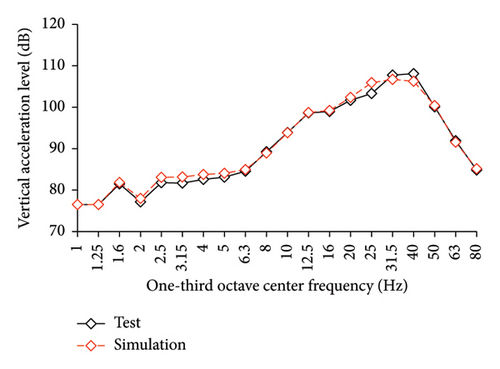
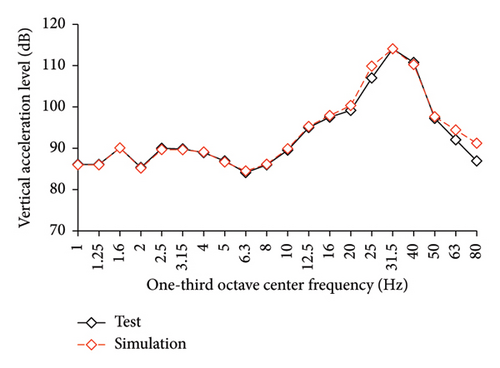
Regarding the simulation results, the relative errors of the maximum AACs under the four metro-induced vertical vibrations were 1.4%, 3.5%, 0.8%, and 0.4%, respectively, with an average error of 0.6%. The relative errors of the maximum vertical acceleration levels in one-third octave band under the four metro-induced vertical vibrations were 0.9%, 0.2%, 1.0%, and 0.1%, respectively, with an average error of 0.2%, indicating that the numerical simulation strategy can simulate the vibrations of the floor slab of the BIS in time and frequency domains and capture the corresponding control effect of the isolation system. Numerical simulation strategy can also be used to simulate the distribution of AACs along the height of the BIS.
3.5. Comparison of Vertical Vibrations of IIS
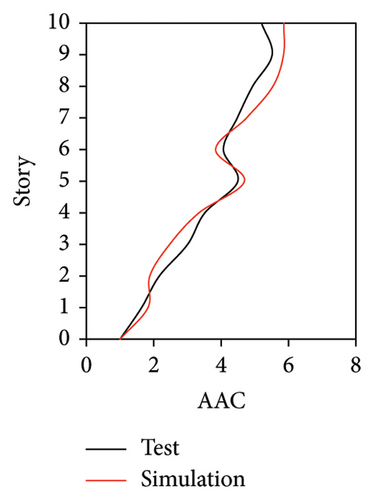
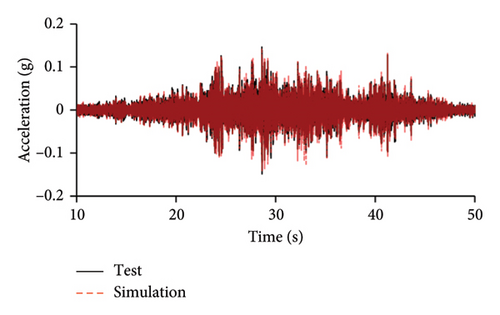
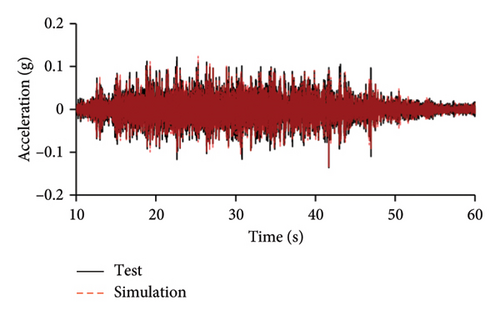
The simulated and experimental AACs, acceleration time histories, and one-third octave band vertical acceleration levels at 9th story of the tower in IIS are compared in Figures 16, 17, and 18, respectively. Similar to BIS, the vertical accelerations at points A1, A2, and A3 in the tower of IIS also exhibited negligible differences. Hence, the vertical accelerations at point A1 were selected to reflect the vibration responses of tower. For the chassis, the AACs adopted the average values of all the measured points. Figure 17 also shows the comparison of AACs of the IIS and that of the FBS. Notable differences were also observed in the distribution of AACs along the height of FBS and the tower of IIS. The AACs were significantly reduced in the IIS. Similar to the BIS, the AACs of the tower in the IIS remained approximately constant throughout the height of the structure. The maximum AAC of the IIS was only 2.3, approximately 38% and 88% of those of the FBS and BIS, respectively.
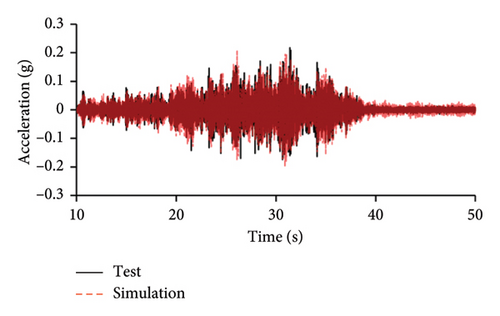
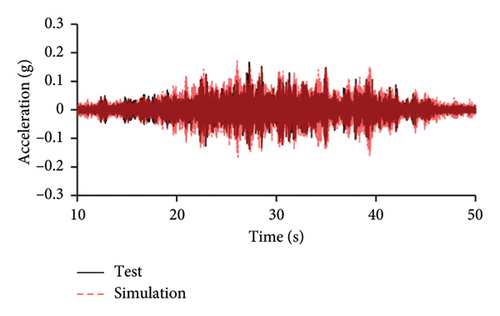
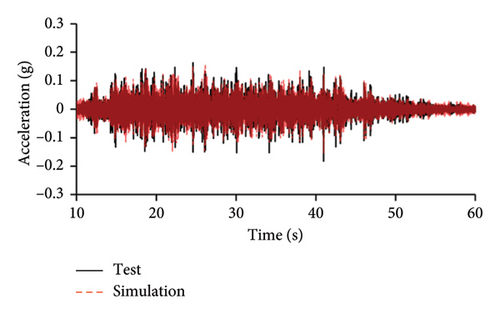
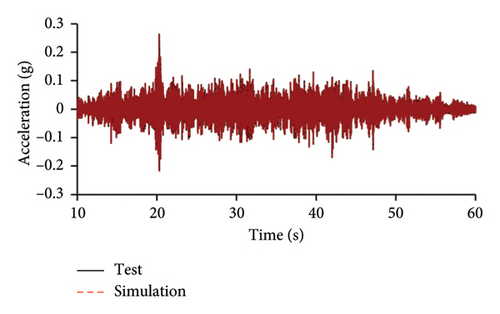
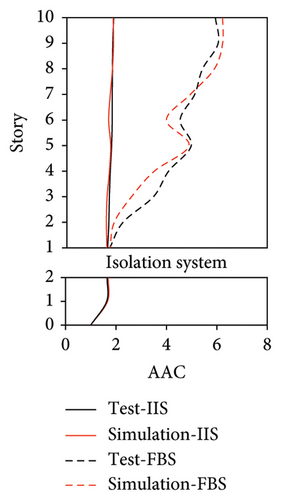
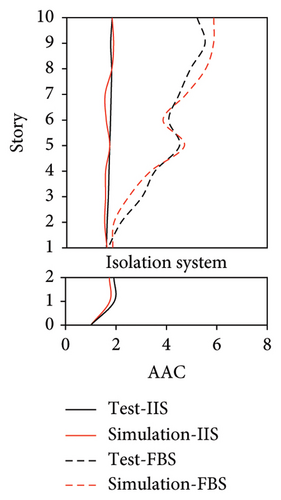
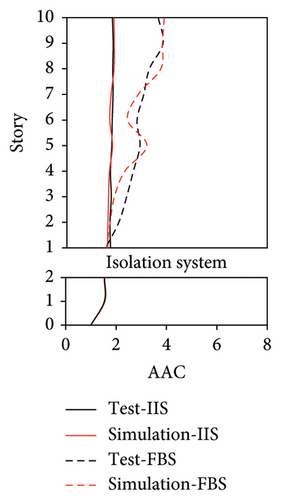
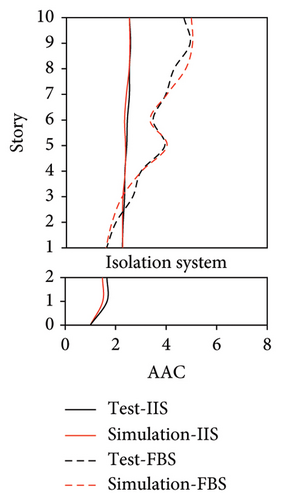
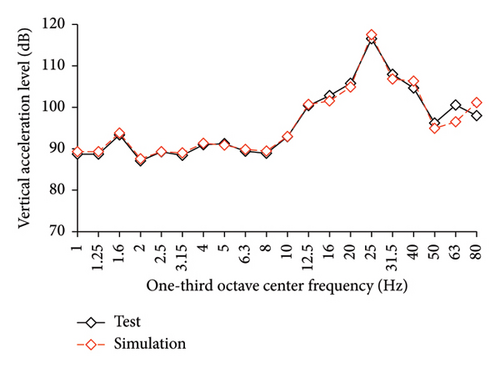
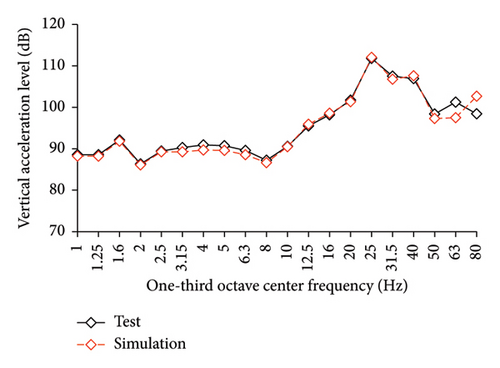
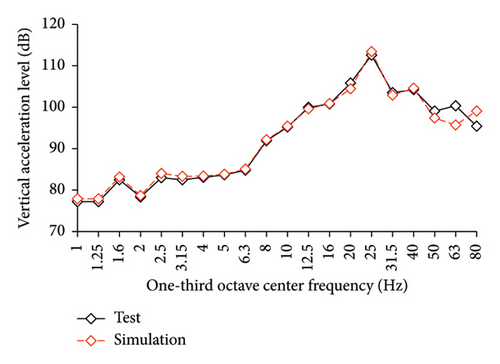
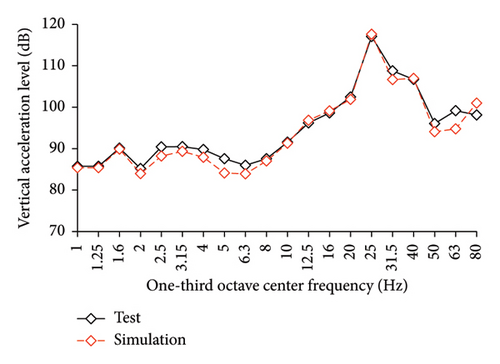
Regarding the simulation results, the relative errors of the maximum AACs of the tower under the four metro-induced vibrations were 0.9%, 3.0%, 2.2%, and 1.1%, respectively, with an average value of 0.6%. The relative errors of the maximum one-third octave vertical acceleration level of the tower under the four metro-induced vibrations were 0.8%, 0.2%, 0.7%, and 0.4%, respectively, with an average value of 0.6%. The average relative error of the maximum AACs of the large chassis was 4.2%. These results indicate that the numerical simulation strategy can also simulate the vibrations of the floor slab of the IIS and capture the corresponding control effect of the interstory isolation system.
4. Influence of Mesh Size and Parameters of the Rayleigh Damping Model on Vertical Vibrations
4.1. Influence of Mesh Size
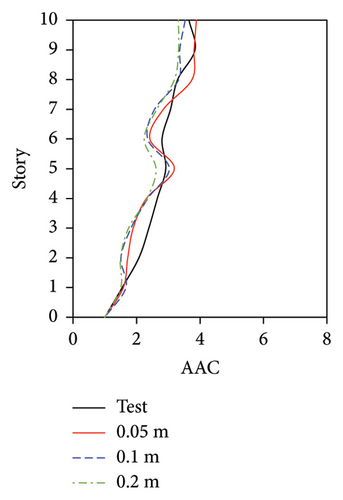
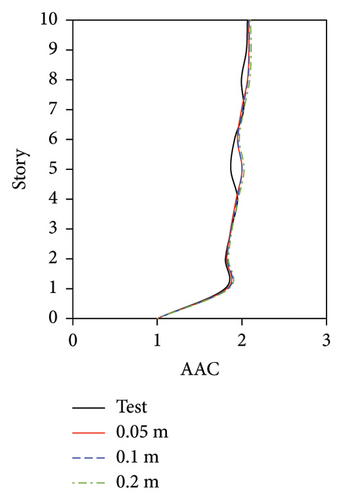
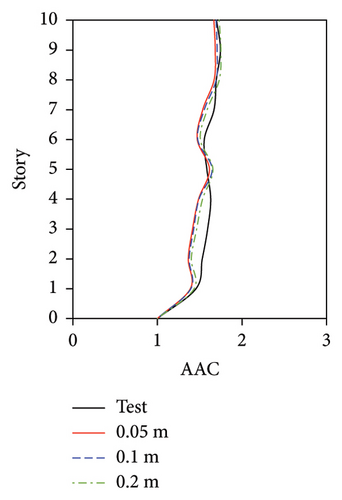
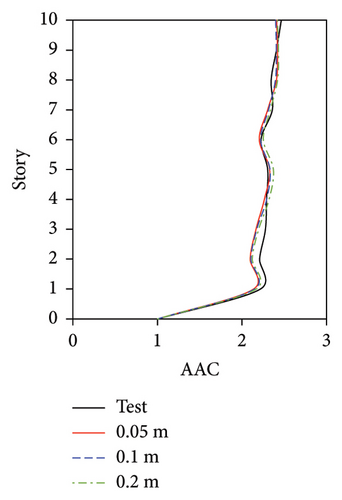
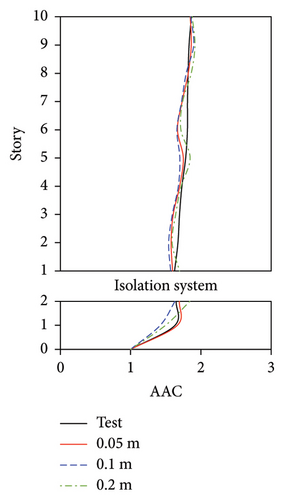
The vertical vibrations of the floor slabs may be affected by the mesh size of the element for the floor slabs. In actual engineering practice, to simulate the vertical vibration of floor slabs, a mesh size of 0.5–1 m is usually adopted for the slabs. Because a scaled ratio of 1/10 was adopted for the shaking table test, a mesh size of 0.05–0.1 m may have a certain extent of influence on the vibration performance. Hence, the numerical models with mesh sizes of 0.05 and 0.1 m for the floor slabs were considered. In addition, a mesh size of 0.2 m for the floor slabs was also considered. The maximum relative difference (1.5%) in the periods of the numerical models with three mesh sizes was negligible. Similar to the results in Section 3.2, relatively small difference was also observed between the simulated results of three damping models using an identical mesh size. Hence, the AAC distributions simulated using the Rayleigh damping model are compared in Figures 19, 20, and 21.
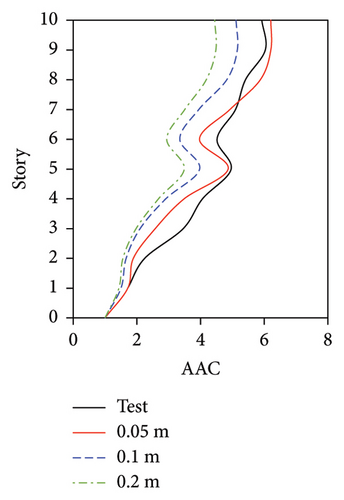
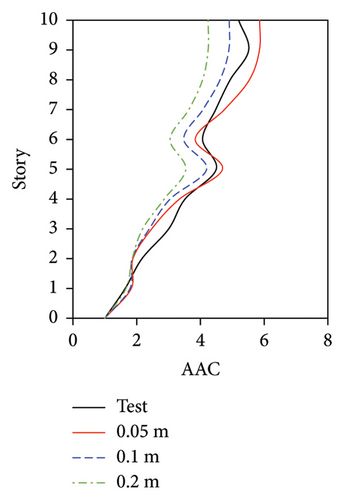
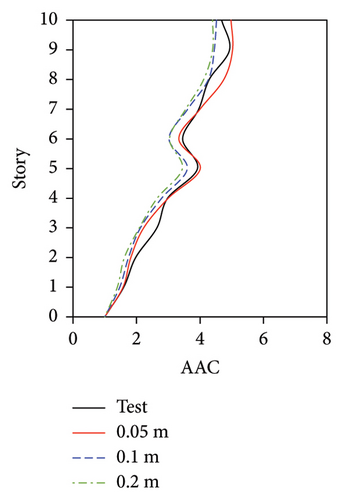
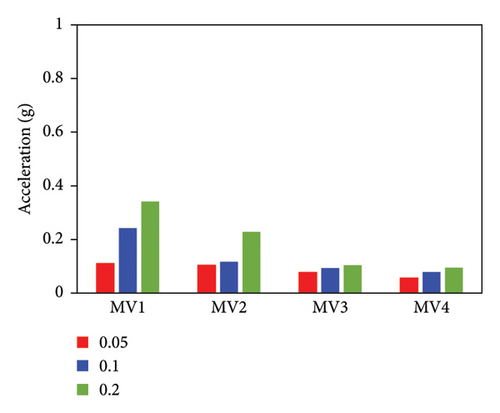
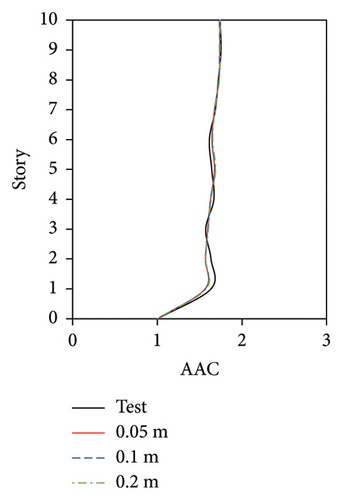
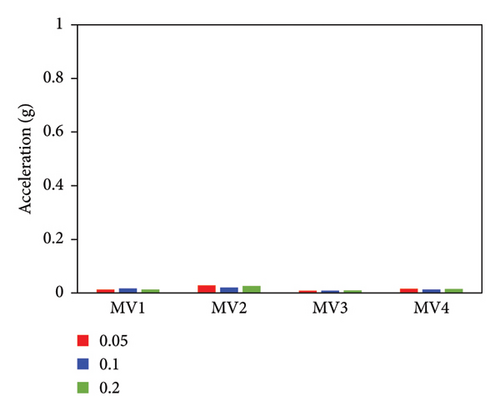
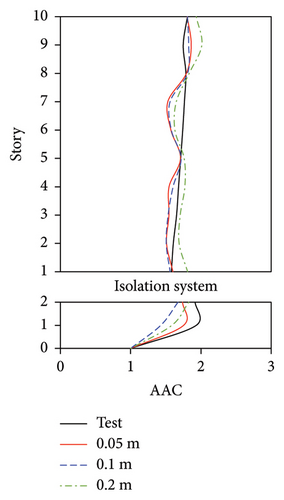
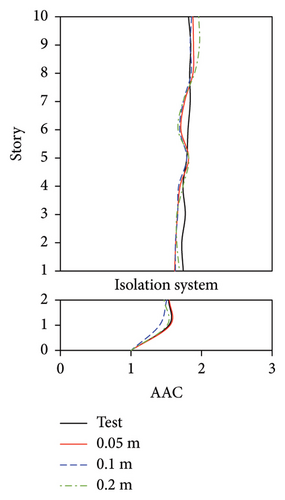
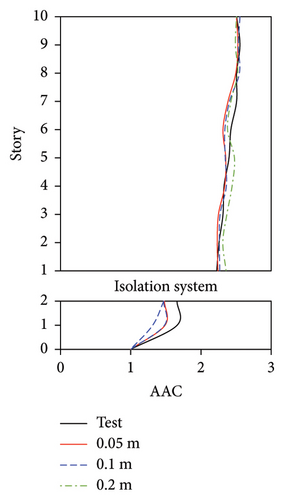
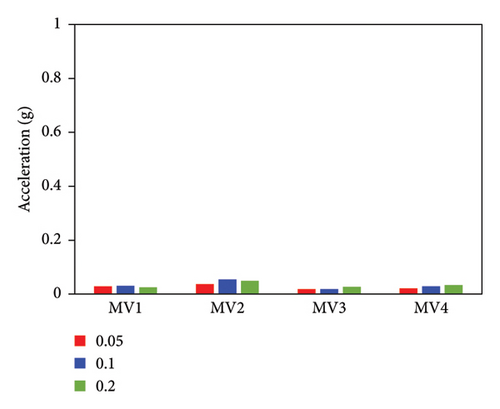
For the FBS, although the distribution pattern of the AACs along the height of the building was not significantly affected by the mesh size, the relative errors of the maximum AAC between the simulation and test results exhibited notable differences. 2-norm error of the simulated and experimental vertical accelerations significantly increased with the increasing of mesh size, as shown in Figure 19(e). The smallest mesh size (0.05 m) yielded the highest accuracy. Specifically, when the mesh size was 0.05 m, the relative errors between the simulated and experimental maximum AACs under the four metro-induced vibrations were 2.9%, 6.1%, 1.6%, and 2.0%, with an average relative error of 3.2%. As the mesh size increased to 0.1 m, the simulated maximum AACs under the four metro-induced vibrations were 14.7%, 11.3%, 12.4%, and 9.8% smaller than the test values, respectively, with an average relative error of 12.1%. Notably, when the mesh size reached 0.2 m, the simulated maximum AACs under the four metro-induced vibrations were 25.7%, 23.2%, 13.4%, and 10.8% smaller than the test values, with an average relative error of 18.3%.
These results indicate that a large mesh size significantly underestimates the vertical vibration of the FBS, as shown in Figure 20. A mesh size of 0.05 m for the scaled FBS and a mesh size of 0.5 m for the actual structure may be appropriate for the evaluation of vertical vibration for FBS.
For BIS, a negligible difference was observed between the simulation results of the mesh sizes of 0.05, 0.1, and 0.2 m, and the relative difference of simulated maximum AACs under three mesh sizes was less than 3%. The maximum 2-norm error of the simulated and experimental vertical accelerations for MV1, MV2, MV3, and MV4 was only 0.16, 0.34, 0.12, and 0.21 m/s2, respectively, indicating that the corresponding results agreed well with the test results. As mentioned above, the AACs of the FBS exhibited notable differences between different slab positions. In contrast, those of the tower in the BIS remained approximately constant between different slab positions and through the height of the structure. Hence, when a large mesh size was adopted, the simulated results of the maximum AAC of the FBS slab were underestimated. In contrast, because the tower of the BIS exhibited integral vertical vibration, the mesh size had a negligible influence on the simulated results.
For the tower in the IIS, a negligible difference was observed between the simulation results of the mesh sizes of 0.05 and 0.1 m, and the maximum relative errors between the experimental and simulated AACs under MV1, MV2, MV3, and MV4 were only 1.7%, 3.0%, 2.2%, and 1.1%, respectively. When the mesh size increased to 0.2 m, the relative errors between the experimental and simulated AACs under MV1, MV2, MV3, and MV4 were 2.7%, 11.3%, 6.8%, and 1.9%, respectively. For the large chassis in the IIS, the simulated AACs of the numerical model with a mesh size of 0.1 m exhibited the maximum relative errors, with an average value of 17.0%. Corresponding average error for the model with a mesh size of 0.2 m was 9.6%, which was larger than the average errors for the model with a mesh size of 0.05 m with a value of 5.9%. 2-norm error of simulated and experimental vertical accelerations, as shown in Figure 21(e), also indicated that the simulation accuracy of the model with a mesh size of 0.05 m was generally good.
In engineering practice, the vertical vibration of an upper tower is a significant concern. Based on the above discussion, it can be concluded that the mesh size has a considerable influence on the metro-induced vertical vibrations of the FBS owing to the nonuniform vibration of the floor slabs. A mesh size of 0.5 m is recommended for the actual engineering practice of FBS. As for the BIS and IIS, a negligible difference was observed between the simulation results of the model with mesh sizes of 0.05 and 0.1 m for the scaled structure, which is mainly attributed to the integral vertical vibration of the upper tower. Hence, a mesh size ranging from 0.5 to 1 m is recommended for the actual engineering practice of BIS and IIS, and a mesh size of 0.5 m is preferred. For the numerical simulation of scaled structures for the shaking table test, a mesh size of 0.05 m multiplied by the scaled ratio is therefore recommended for the shell elements of slabs to simulate the vertical vibration of BIS and IIS.
4.2. Influence of Parameters of Rayleigh Damping Model
| Cases | wi (Hz) | Modal participating mass ratio (%) | wj (Hz) | Modal participating mass ratio (%) |
|---|---|---|---|---|
| FB1 | 76 | 57 | 86 | 61 |
| FB2 | 76 | 57 | 110 | 70 |
| FB3 | 76 | 57 | 225 | 90 |
| FB4 | 76 | 57 | 1216 | 99 |
| Cases | wi (Hz) | Modal participating mass ratio (%) | wj (Hz) | Modal participating mass ratio (%) |
|---|---|---|---|---|
| II1 | 26 | 45 | 27 | 46 |
| II2 | 26 | 45 | 182 | 74 |
| II3 | 26 | 45 | 326 | 90 |
| II4 | 26 | 45 | 563 | 99 |
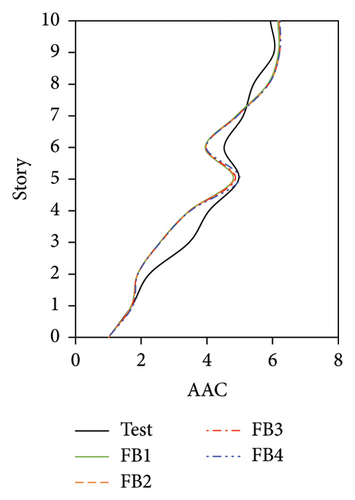
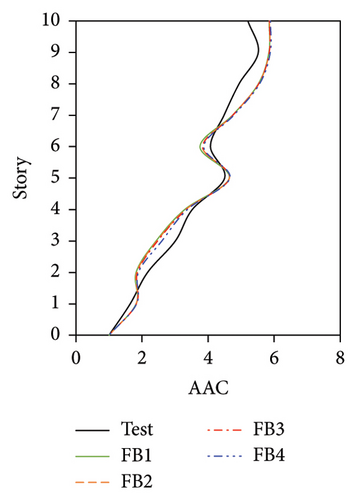
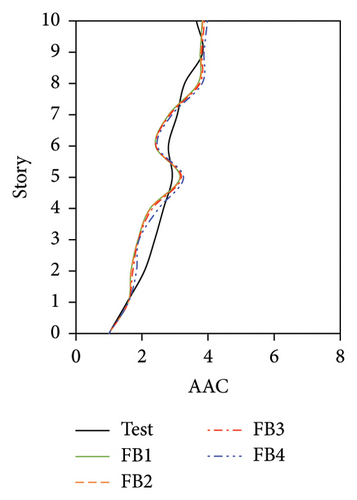
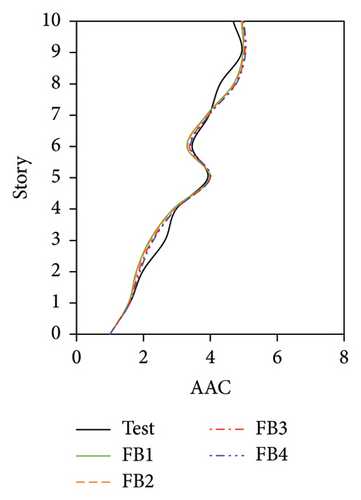
The distributions of the AACs of the four FBS models using different wj values are shown in Figure 22. The maximum AACs of FB1 were only 1.1%, 1.8%, 4.1%, and 3.5% lower than those of FB4 under the four metro-induced vertical vibrations. The relative differences among the simulated results for the four cases were considered negligible, which can also be proved by the identical 2-norm (presented in Figure 22(e)) of the errors between the test and numerical vertical accelerations.
The AAC distributions of the four numerical models of the IIS with different wj values are compared in Figure 23. Similar to FBS, the AACs of IIS also increased with an increase in wj. For the tower, a negligible relative difference was observed between the AACs of II2, II3, and II4, where the modal participating mass ratios were no less than 70%. The relative difference in the average maximum AACs among the three models was less than 3.0%, and the maximum relative error between the simulation and test values was 1.9%. By contrast, the AACs of II1, in which wj only adopted the second-order vertical vibration frequency and the corresponding modal participating mass ratio was only 46%, were underestimated to a certain extent. The average maximum AACs of the tower in II1 were 9.8% lower than the test value. Regarding the chassis, the relative errors between the test AACs and the simulated results of II3 and II4, in which the modal participating mass ratios reached 90%, were 4.1% and 4.0%, respectively. In contrast, the relative errors between the test AACs and the simulated results of II1 and II2 reached 20.7% and 10.7%, respectively. When the modal participating mass ratio increased from 46% to 90%, 2-norm of the errors between the test and numerical vertical accelerations decreased. After the modal participating mass ratio reached 90%, the simulation accuracy became stable. Hence, a modal participating mass ratio of no less than 90% is recommended for the IIS.
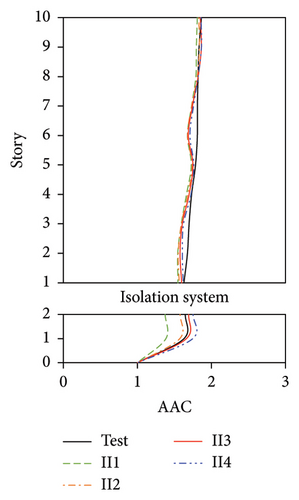
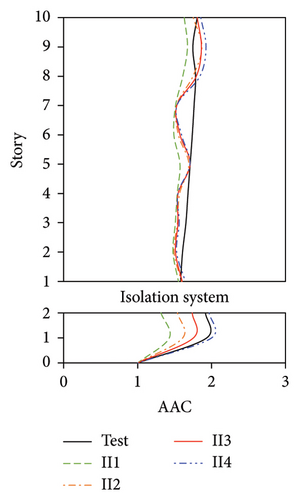
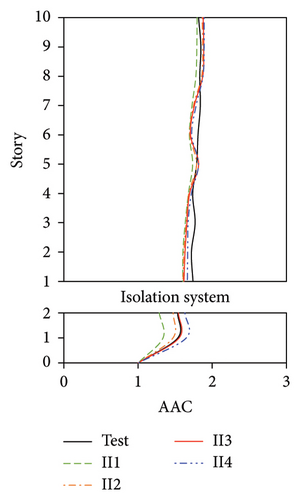

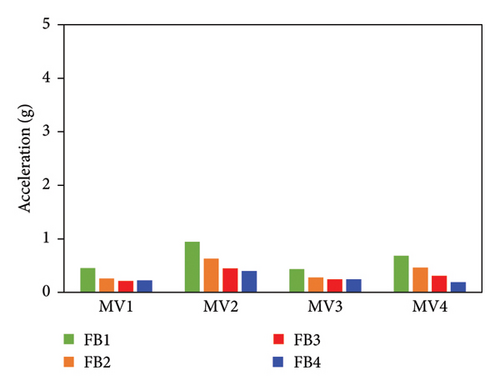
In conclusion, for the FBS and BIS, when wj adopted the second-order vibration frequency, the modal participating mass ratios reached 61% and 90%, respectively, and good results were obtained. The influence of the selected wj was negligible for both FBS and BIS. For the IIS, the numerical model yielded good results only after the modal participating mass ratio reached 90%. Hence, a modal participating mass ratio of no less than 90% is recommended for selecting wj.
5. Conclusion
- 1.
In the generalized simulation strategy, the recommended mesh size for the slab was 0.5 m multiplied by the scaled ratio (1/10) for the scaled structure, i.e., 0.05 m in this research. The simulation accuracies of numerical models using Rayleigh damping, modal damping, and distributed modal damping models were basically identical. When the Rayleigh damping model was adopted, damping coefficients were recommended to be calculated using the first-order vertical frequency and vertical frequency corresponding to a modal participating mass ratio no less than 90%. The AAC distributions at different positions on the slab and along the height of the building, acceleration time histories, and one-third octave band vertical acceleration levels were simulated well using this strategy. The relative differences between the simulated and experimental maximum AACs and one-third octave band vertical acceleration levels were less than 4.2%.
- 2.
For the distribution of AACs at different positions of the slab, the acceleration at the central part of the FBS slab was approximately 20%–32% larger than that at the corners of the slab. In contrast, the difference of vertical accelerations at different positions on the slab of the BIS and IIS was negligible. The accelerations of the FBS generally increased along the height of the building. In contrast, the accelerations of the tower in the BIS and IIS remained approximately constant throughout the building height. The maximum AACs of BIS (2.6) and IIS (2.3) were 43% and 38% of FBS (6.0), respectively.
- 3.
The mesh size significantly affected the metro-induced vertical vibrations of the tested FBS. Only a mesh size of 0.05 m could yield good results. As for the scaled BIS and IIS, a negligible difference was observed between the simulated results of the models with mesh sizes of 0.05 and 0.1 m. Based on these findings, a mesh size of 0.5 m is recommended for real engineering practice for FBS, BIS, and IIS, although a mesh size of 1 m could also be suitable for BIS and IIS.
- 4.
For the FBS and BIS, when wj of the Rayleigh damping model adopted the second-order vibration frequency, the modal participating mass ratios reached 61% and 90%, respectively, and good results were obtained. The influence of the selected wj was negligible for both FBS and BIS. For the IIS, the numerical model yielded good results only after the modal participating mass ratio reached 90%. Hence, a modal participating mass ratio of no less than 90% is recommended for selecting wj.
Although the shaking table tests and generalized simulation strategy can assist in the relative research, further investigations are required to be conducted, including the validation of this strategy against field test data.
Conflicts of Interest
The authors declare no conflicts of interest.
Funding
This work was supported by the financial support received from National Key R&D Program of China (Grant number 2023YFC3805800).
Acknowledgments
This work was supported by the financial support received from National Key R&D Program of China (Grant number 2023YFC3805800).
Open Research
Data Availability Statement
The data that support the findings of this study are available from the corresponding author upon reasonable request.


