Cable Force Identification With Unknown and Variable Elastic Boundary Supports: Theory and Validation
Abstract
The vibration method is widely used for identifying cable tension. However, the boundary conditions of cables in structures are often not ideally hinged, resulting in a significant error in identifying cable forces. To precisely determine the stress state of cables, this paper proposes a methodology for cable force identification with unknown and variable elastic boundary supports. First, an equivalent single-degree-of-freedom (SDOF) model of the cable with variable elastic boundary supports is established. A mathematical relationship between the frequencies of ideal hinged cables and those with elastic boundary supports is then established. Subsequently, the first-order frequency is modified by accounting for the mode shape values at the midpoint and both endpoints of the cable. Finally, a methodology for cable force identification with unknown and variable elastic boundary supports is proposed and validated through numerical simulations, experiments, and on-site tests. The results indicate that the proposed cable force identification method can adapt excellently to the variable elastic boundary supports without relying on known the boundary constraint stiffness. In numerical simulations, the identification errors of the proposed method are all less than 1%, while in experiments and on-site tests, the identification errors are within 5%, demonstrating its high accuracy and strong adaptability. The proposed method considers the complex boundary conditions of cables, eliminating the need to solve for unknown boundary constraint stiffness, indicating that it can adapt to the unknown and variable boundary stiffness of cables.
1. Introduction
Steel cables have extensive applications in long-span structures, plant buildings, and other spatial structures due to their advantages of high strength and lightweight. Researchers have developed diverse innovative intelligent structural systems to expand the potential applications of steel cables, realizing lightweight, efficient, and intelligent designs, such as adaptive cable dome structures [1] and active shape-changing cable-net systems [2, 3]. Through the integration of sensing systems, actuation mechanisms, control systems, and other technologies, these structures can modify their shape and stiffness in response to external environmental conditions or operational demands. This adaptability allows the structures to attain an optimal state in terms of load-bearing capacity and overall performance. Cables play a crucial role as primary load-bearing components in such structures, and monitoring tension is essential for assessing structural performance [4–8].
In practical engineering, the vibration method has been widely used due to its advantages, such as convenient installation, reusability, and the capability of online monitoring. Most importantly, it can be applied during the operational period for structural cables. The vibration method was first proposed by Irvine as the taut string theory, which assumes ideal hinged boundary conditions [9, 10]. However, the actual boundary conditions of cables are more complex and variable, requiring appropriate modifications to the taut string theory [11, 12].
To accurately identify cable forces, numerous scholars have developed various formulae that account for complex boundary conditions, bending stiffness, and other influencing factors [13–15]. Zui et al. [16] derived a formula for calculating cable forces using the first two natural frequencies by solving the vibration differential equation of a cable with both ends fixed. Based on this, Ren et al. [17] combined the energy method to develop a formula for the fundamental frequency that accounts for the effects of sag and bending stiffness. The formula was then validated through comparison with numerical examples. Kim et al. [18] proposed a modified identification method that simultaneously determines cable force, bending stiffness, and axial stiffness, and they also analyzed its feasibility and accuracy using finite element simulations. Rebecchi et al. [19] introduced an experimental method for identifying the cable force under unknown boundary conditions using one vibration frequency and five corresponding mode shapes, requiring only known bending stiffness and mass to calculate the cable force. Additionally, some researchers have employed sensitivity-based finite element model (FEM) updating methodologies or system identification techniques [20–27]. However, numerical inverse analysis is highly dependent on the accuracy of the model, and the identified results can be significantly affected by uncertainties in the model.
The aforementioned model-based methods are primarily applicable to cables with ideal pinned or clamped end conditions. However, dampers or actuators are often installed near the boundaries of cables, resulting in more complex boundary conditions that present significant challenges for accurately identifying cable forces. To address these issues, researchers usually employ two approaches. The first approach involves optimizing the cable force calculation formulae by introducing effective vibration lengths or dimensionless parameters [28–31]. For example, Huang et al. [31] investigated the impact of spring stiffness in end-damping devices on cable boundary conditions and proposed a quadratic equivalent length correction formula that incorporates the effects of spring stiffness within the framework of taut string theory. Furthermore, the accuracy and applicability of this method were validated through numerical simulations and on-site verification on a cable-stayed bridge. Another approach involves deriving cable force calculation formulae using extensive data and curve-fitting techniques [32, 33]. For example, Wang et al. [32] derived an equation that reflects the relationship between vibration frequency and the horizontal tension force of a main cable. Furthermore, the antisymmetric characteristic equation can be transformed into a least squares problem, which can be efficiently solved to determine the main cable tension.
Based on the reviewed literature, some methods modify cable force formulae by introducing effective vibration lengths or dimensionless parameters, while others rely on iterative or fitting formulae. However, for cable-network structures with unknown or time-varying boundary stiffness, these correction formulae or fitted curves may not be valid, making online monitoring of cable forces challenging. In engineering applications, it is crucial to establish explicit and practical formulae that consider the aforementioned factors. Consequently, this paper proposes a methodology for cable force identification with unknown and variable elastic boundary supports. Different from current works, this approach considers the complex boundary effects and can identify cable forces under unknown and variable boundary constraint stiffnesses. In Section 2, an equivalent single-degree-of-freedom (SDOF) system which has been validated in structural analyses under seismic [34–36], explosive loads [37, 38], and rain-wind-induced vibration [39] is introduced. Based on mass and stiffness parameters of the cable, the corresponding generalized mass, generalized stiffness, and other parameters of the equivalent SDOF system are derived. Subsequently, a methodology for cable force identification with unknown and variable elastic boundary supports is presented. Section 3 demonstrates the precision and effectiveness of the proposed method through numerical simulations conducted on a single cable. These simulations investigate the influence of spring support and noise on the accuracy of cable force identification, while further discussing the range of application. In Section 4, tension tests are conducted on a model of single cable with elastic supports to further validate the accuracy and feasibility of the proposed method. Moreover, the proposed method is applied to the Five-hundred-meter Aperture Spherical radio Telescope (FAST), and its precision and engineering applicability are verified through on-site validation of single cable and cable-net structure in Section 5. Finally, Section 6 summarizes the study.
2. Methodology for Cable Force Identification Considering Unknown and Variable Elastic Boundary Supports
This section first introduces the taut string theory, where both ends of the cable are ideally hinged. Subsequently, an equivalent SDOF model is employed to establish a mathematical relationship between the first-order frequency of an ideal hinged cable and a cable with variable elastic boundary supports. Finally, a methodology for cable force identification with unknown and variable elastic boundary supports is proposed.
The methodology for cable force identification considering unknown and variable elastic boundary supports is based on the following assumptions: (1) The cable undergoes slight free vibration in the transverse direction, without considering the influence of the cable bending stiffness; (2) the sag–span ratio of the cable is relatively small, and its shape under transverse loading is parabolic; and (3) the ratio of the displacement to the sag at the cable endpoints is approximately equal to the ratio of their corresponding mode shape values.
2.1. Taut String Theory of Ideal Hinged Cables
2.2. Equivalent SDOF Model of Cables With Unknown and Variable Elastic Boundary Supports
For a cable with variable elastic boundary supports, the end supports exhibit only translational stiffness, while the rotational stiffness is very small and can be neglected. This translational stiffness can additionally vary in accordance with the structural state, influenced by the factors such as the temperature, performance degradation, or functional requirement. Assuming that the parameters and loading conditions of the cable with variable elastic boundary supports are the same as those of the ideal hinged cable, the only difference is that the boundary conditions change from an ideal hinge to an elastic support. The boundary conditions of the cable are simplified to axial and transverse spring supports at both ends, as illustrated in Figure 2. The stiffnesses of the transverse spring supports at both ends are denoted as k1 and k2, while the stiffnesses of the axial spring supports are k3 and k4.

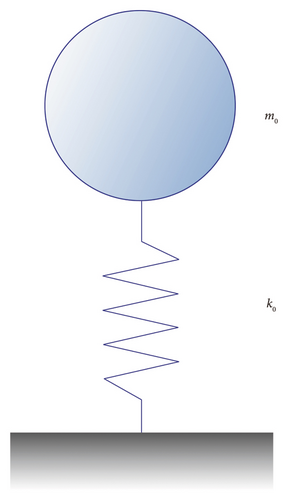
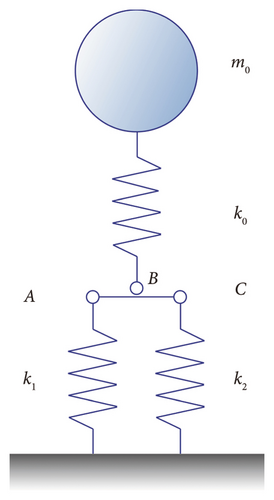
Similarly, a cable with variable elastic boundary supports can also be simplified as an SDOF model. When subjected to artificial or environmental excitation, the cable undergoes small-amplitude vibrations in the transverse plane. In this case, the axial spring supports at both ends have no effect on the natural frequency of the cable, which is further confirmed by the numerical simulation in Section 3.3.1. Therefore, the axial vibration is generally neglected unless the coupling of axial and transverse vibrations is considered. Then, the axial constraint springs k3 and k4 are simplified to chain constraints, and the model of the cable with elastic boundary supports can be further equivalent to the model shown in Figure 3. Based on Figure 1, a cable with variable elastic boundary supports can be represented by an equivalent SDOF model, as shown in Figure 4.


2.3. Static Analysis of a Cable With Unknown and Variable Elastic Boundary Supports
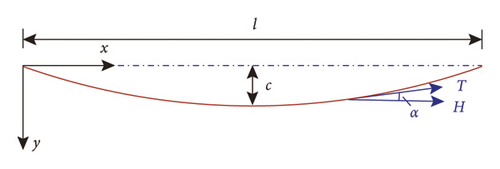
The displacement of the cable with elastic boundary supports in the equivalent SDOF model under transverse load ql is the sum of the displacement of the hinged cable and the displacements of the both transverse support springs, which can be written as (ql)/k0 + (y1 + y2)/2.
2.4. Modification of the First-Order Frequency
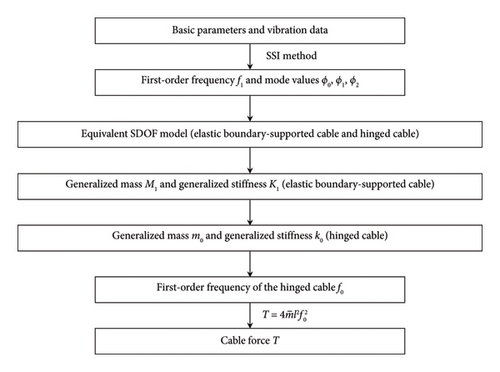
Based on the above discussion, the flowchart of the proposed cable force identification method is shown in Figure 7. The basic parameters of the cable are easy to be obtained, such as line density and length, and there are only three acceleration sensors that need to be installed at the midspan and both ends of the cable. The acquired acceleration signals are processed using modal analysis methods, such as the stochastic subspace identification (SSI) method [40–42]. The SSI method used in this study identifies the frequency and mode shape values of the cable from acceleration data and normalizes the mode shape values at the midpoint and endpoints to obtain ϕ0, ϕ1, and ϕ2. Furthermore, by calculating the generalized mass M1, the cable force can be solved using equation (22). When the boundary constraint stiffness of the cable changes, the proposed method can still obtain the corresponding modal parameters and accurately identify the cable force using the acceleration data from the current structural state.
3. Numerical Verification
In this section, a FEM of a cable with elastic boundary supports is first established. Subsequently, the influence of axial supporting springs on the cable modal parameters is investigated. Furthermore, the proposed method is employed to identify the cable force under both equal and unequal boundary constraints. Finally, a parametric analysis is conducted to validate the accuracy and robustness of the proposed method.
3.1. FEM
In ANSYS software, the LINK180 element is used to simulate the cable, and the COMBIN14 element is used to simulate the supporting springs. The COMBIN14 element allows for the customization of the spring stiffness. Additionally, the actual cable shape is iteratively solved based on different cable force conditions [43]. The FEM of the cable is shown in Figure 8.

The basic parameters of the cable model in this section are as follows: diameter of 0.025 m, length of 12.394 m, mass per unit length of 2.894 kg/m, elastic modulus of 2.19 × 10¹¹ Pa, and rated breaking force of 726.80 kN. Define the ratio of the transverse spring stiffness at the left end to the cable line stiffness as γ1, which is γ1 = lk1/EA; the ratio of the transverse spring stiffness at the left and right ends as γ2, which is γ2 = k1/k2; the ratio of the axial spring stiffness at the left end to the cable line stiffness as γ3, which is γ3 = lk3/EA; and the ratio of the axial spring stiffness at the left and right ends as γ4, which is γ4 = k3/k4. Unless otherwise specified, all parameters are set to default values: The cable force T is 726.80 kN, γ1 takes 10%, γ2 is 1:1, γ3 is set to infinity, and γ4 is 1:1.
By changing the cable force and the support spring stiffness, different working conditions are simulated. After applying an initial load and then releasing it, the cable undergoes free vibration in the transverse plane. The acceleration data from the midspan and both ends of the cable are collected and processed using the SSI method to obtain the first-order frequency and corresponding mode shape values.
3.2. Identification Results
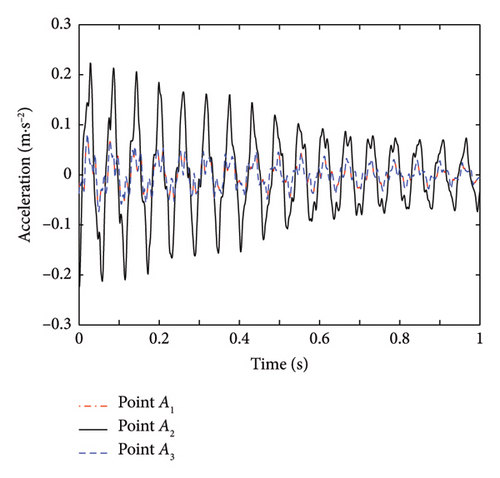
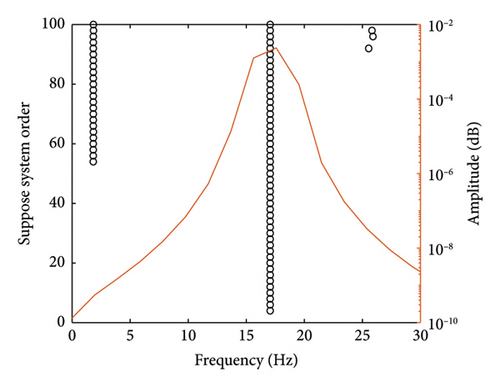
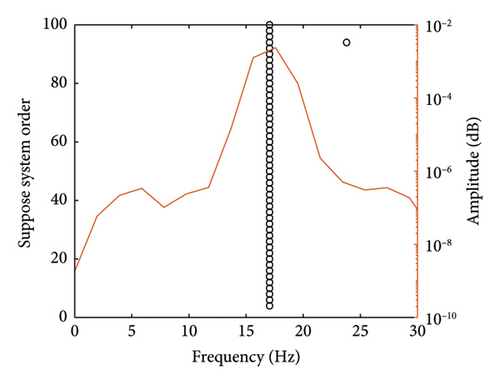
This section illustrates the procedure of cable force identification for the elastic support cable with equal boundary stiffness. When the cable force and all parameters are default (T = 726.80 kN, γ1 = 10%, γ2 = 1 : 1, γ3 = +∞, and γ4 = 1 : 1), the obtained acceleration time history is shown in Figure 9, where the acceleration curves of points A1 and A3 completely overlap due to their symmetric positions. The acceleration data are processed using the SSI method, and the calculated stability diagram and frequency spectrum curve for the midpoint measurement point are shown in Figure 10. The first-order frequency of the cable with elastic boundary supports is f1 = 17.05 Hz, with mode shape values of 0.0662 at points A1 and A3, and 0.2652 at point A2. The modal analysis results obtained directly using ANSYS software reveal that the first-order frequency is 17.0550 Hz, with mode shape values of 0.0545 at points A1 and A3, and 0.2182 at point A2. After normalization, it is evident that the mode shapes obtained from both methods are consistent. Specifically, the mode shape value of the hinged cable is ϕ0 = 0.7503, and the mode shape value of the transverse support springs is ϕ1 = ϕ2 = 0.2497.
The mode shape values obtained from the modal identification are used to calculate the generalized mass of the cable with elastic boundary supports using equation (7), which is M1 = 20.89 kg. By solving equation (15), the generalized stiffness k0 of the cable (including the unknown tension T) is obtained. Equation (2) is then used to calculate the generalized mass of the hinged cable, which is m0 = 17.93 kg. Finally, equation (22) is applied to calculate the cable force T, resulting in a value of 726.04 kN, which is very close to the set value of 726.80 kN, with a relative error of −0.10%, demonstrating its high accuracy. In contrast, the cable force obtained using the Huang formula [31] is 737.48 kN, with a relative error of 1.47%, which is larger than that of the proposed method. In addition, the Huang formula relies on known boundary stiffness, which is challenging to obtain accurately in practical applications.
3.3. Parametric Analysis
3.3.1. Influence of Axial Support Springs
Five levels of cable force are set as follows: 20%, 40%, 60%, 80%, and 100% of the rated breaking force. γ1 is set to infinity, and γ3 is set to four levels: 80%, 100%, 120%, and infinity. Meanwhile, all other parameters are the default values (γ2 and γ4 are 1:1). Modal analysis is conducted on the elastic support cable model with varying axial spring stiffness conditions, and the resulting natural frequency data are presented in Table 1. It can be observed that regardless of how the axial spring stiffness changes, the first-order frequency remains constant. This observation verifies the conclusion that the axial support spring stiffness has no influence on the natural frequency.
| Theoretical cable force (kN) | γ3 | First-order frequency (Hz) |
|---|---|---|
| 145.36 | 80% | 9.05 |
| 100% | 9.05 | |
| 120% | 9.05 | |
| Fully hinged | 9.05 | |
| 436.08 | 80% | 15.71 |
| 100% | 15.71 | |
| 120% | 15.71 | |
| Fully hinged | 15.71 | |
| 726.8 | 80% | 20.32 |
| 100% | 20.32 | |
| 120% | 20.32 | |
| Fully hinged | 20.32 | |
In practical engineering, the axial spring stiffnesses at both ends of the cable are not always equal. Therefore, the impact of unequal axial spring stiffness on the accuracy of the proposed method should be studied. Taking the conditions in Section 3.2 as an example, γ3 is set to 80%, 100%, and 120%, and γ4 is set to 1:1, 1:3, 1:5, and 1:10, keeping all other parameters at default values (γ1 = 10% and γ2 = 1 : 1). The results of cable force identification with different ratios of axial support spring stiffness are shown in Table 2. It can be observed that the unequal axial springs do not affect the accuracy of the proposed cable force identification method.
| Theoretical cable force (kN) | γ3 | γ4 | First-order frequency (Hz) | Identified cable force (kN) | Relative error (%) |
|---|---|---|---|---|---|
| 726.80 | 80% | 1:1 | 17.05 | 726.04 | −0.10 |
| 1:3 | 17.05 | 726.04 | −0.10 | ||
| 1:5 | 17.05 | 726.04 | −0.10 | ||
| 1:10 | 17.05 | 726.04 | −0.10 | ||
| 100% | 1:1 | 17.05 | 726.04 | −0.10 | |
| 1:3 | 17.05 | 726.04 | −0.10 | ||
| 1:5 | 17.05 | 726.04 | −0.10 | ||
| 1:10 | 17.05 | 726.04 | −0.10 | ||
| 120% | 1:1 | 17.05 | 726.04 | −0.10 | |
| 1:3 | 17.05 | 726.04 | −0.10 | ||
| 1:5 | 17.05 | 726.04 | −0.10 | ||
| 1:10 | 17.05 | 726.04 | −0.10 |
3.3.2. Influence of Transverse Support Springs
For the elastic boundary support cable with equal boundary stiffness, γ1 is set to 10%, 25%, 50%, 100%, and infinity, while keeping all other parameters at default values (γ2 = 1:1, γ3 = +∞, and γ4 = 1:1). The proposed method is employed to identify the cable forces. The partial results of cable force identification are presented in Table 3, with the same cable force levels set in Table 1. It can be observed that the proposed method yields accurate tension values, with relative errors typically less than 1%. When the transverse spring stiffness is infinite, the calculation formula for this method reduces to that of taut string theory.
| Theoretical cable force (kN) | γ1 | First-order frequency f1 (Hz) | Mode shape value | Identified cable force (kN) | Relative error (%) | ||
|---|---|---|---|---|---|---|---|
| ϕ0 | ϕ1 | ϕ2 | |||||
| 145.36 | 10% | 8.71 | 0.9410 | 0.0590 | 0.0590 | 144.97 | −0.27 |
| 25% | 8.91 | 0.9758 | 0.0242 | 0.0242 | 145.39 | 0.02 | |
| 50% | 8.98 | 0.9878 | 0.0122 | 0.0122 | 145.56 | 0.14 | |
| 100% | 9.02 | 0.9939 | 0.0061 | 0.0061 | 145.65 | 0.20 | |
| +∞ | 9.05 | 1 | 0 | 0 | 145.82 | 0.32 | |
| 436.08 | 10% | 14.07 | 0.8373 | 0.1627 | 0.1627 | 434.12 | −0.45 |
| 25% | 15.01 | 0.9294 | 0.0706 | 0.0706 | 436.34 | 0.06 | |
| 50% | 15.35 | 0.9640 | 0.0360 | 0.0360 | 437.32 | 0.28 | |
| 100% | 15.53 | 0.9818 | 0.0182 | 0.0182 | 437.96 | 0.43 | |
| +∞ | 15.63 | 1 | 0 | 0 | 434.39 | −0.39 | |
| 726.80 | 10% | 17.05 | 0.7503 | 0.2497 | 0.2497 | 726.04 | −0.10 |
| 25% | 18.85 | 0.8868 | 0.1132 | 0.1132 | 727.77 | 0.13 | |
| 50% | 19.56 | 0.9406 | 0.0594 | 0.0594 | 730.56 | 0.52 | |
| 100% | 19.93 | 0.9699 | 0.0301 | 0.0301 | 731.98 | 0.71 | |
| +∞ | 20.32 | 1 | 0 | 0 | 734.18 | 1.02 | |
For the elastic boundary support cable with unequal boundary stiffness at both ends, γ1 is 25% and γ2 is set to 1:1, 1:3, 1:5, and 1:10, keeping all other parameters at default values (γ3 = +∞ and γ4 is 1:1). The results of the cable force identification are shown in Table 4, with the same cable force levels set in Table 1. As the stiffness ratio γ2 decreases, the identification error increases slightly, remaining below 0.5%.
| Theoretical cable force (kN) | γ2 | First-order frequency f1 (Hz) | Mode shape value | Identified cable force (kN) | Relative error (%) | ||
|---|---|---|---|---|---|---|---|
| ϕ0 | ϕ1 | ϕ2 | |||||
| 145.36 | 1:1 | 8.91 | 0.9758 | 0.0242 | 0.0242 | 145.39 | 0.02 |
| 1:3 | 8.96 | 0.9838 | 0.0243 | 0.0081 | 145.51 | 0.10 | |
| 1:5 | 8.97 | 0.9855 | 0.0241 | 0.0049 | 145.51 | 0.10 | |
| 1:10 | 8.98 | 0.9866 | 0.0244 | 0.0024 | 145.54 | 0.13 | |
| 436.08 | 1:1 | 15.01 | 0.9294 | 0.0706 | 0.0706 | 436.34 | 0.06 |
| 1:3 | 15.23 | 0.9526 | 0.0713 | 0.0232 | 436.72 | 0.15 | |
| 1:5 | 15.28 | 0.9569 | 0.0715 | 0.0142 | 436.00 | 0.21 | |
| 1:10 | 15.31 | 0.9603 | 0.0717 | 0.0072 | 437.22 | 0.26 | |
| 726.80 | 1:1 | 18.85 | 0.8868 | 0.1132 | 0.1132 | 727.77 | 0.13 |
| 1:3 | 19.32 | 0.9219 | 0.1167 | 0.0389 | 729.82 | 0.42 | |
| 1:5 | 19.41 | 0.9296 | 0.1164 | 0.0235 | 729.83 | 0.42 | |
| 1:10 | 19.49 | 0.9360 | 0.1151 | 0.0118 | 729.45 | 0.36 | |
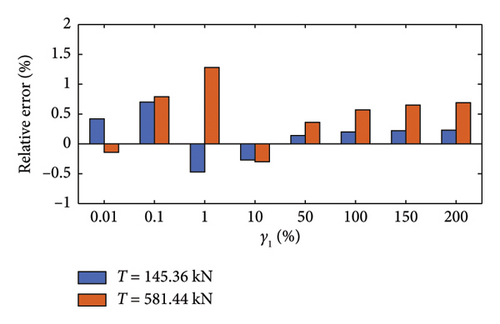
Additionally, to explore the effective range of the proposed method, a parametric analysis of single cable is carried out by changing the stiffness γ1 and the stiffness ratio γ2. When the stiffness of the boundary spring is equal, γ1 is set to 0.01%, 0.1%, 1%, 10%, 50%, 100%, 150%, and 200%, and the cable force takes 20% and 80% of the rated breaking force, keeping all other parameters at default values (γ2 and γ4 are 1:1, γ3 = +∞). When the stiffness of the boundary spring is unequal, with γ2 values of 1:5, 1:10, 1:20, 1:30, 1:40, 1:50, and 1:100, γ1 is set to 0.5%, 1%, and 5% (γ3 = +∞ and γ4 is 1:1).
The histograms of the relative error for the proposed method are illustrated in Figures 11 and 12. It is evident that for elastic support cables with equal boundary stiffness, the proposed method maintains a high level of identification accuracy and stability even as the stiffness of the boundary support decreases significantly. However, for cables with unequal boundary stiffness, the proposed method needs to satisfy the following conditions: (1) The minimum stiffness of the most flexible support should be equal to or greater than 1% of the cable line stiffness, and (2) the stiffness ratio between the two supports should be equal to or greater than 1/100.

3.3.3. Analysis of Anti-Noise Performance
In practical engineering, the structural response is often affected by environmental conditions and the characteristics of data acquisition equipment, resulting in a certain level of noise. This noise can potentially reduce the accuracy of cable force identification. Therefore, it is essential to evaluate the accuracy of the proposed cable force identification method considering the influence of noise interference.
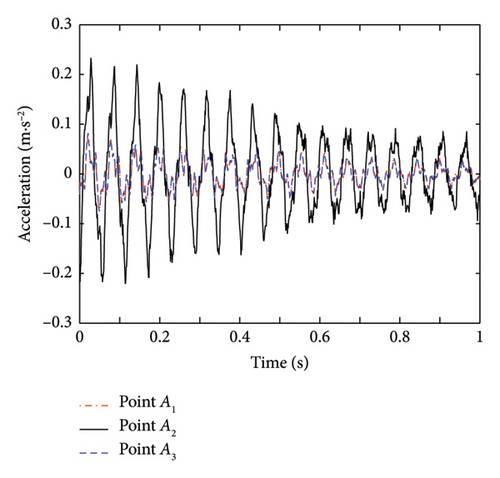
Taking the operating conditions discussed in Section 3.2 as an example, Gaussian white noise is added to the acceleration signals. In this study, the performance of cable force identification is examined under noise levels of 10%, 20%, and 30%. Several examples of acceleration signals with added noise are shown in Figure 13, and the stability diagram and frequency spectrum curve for the midpoint measurement point are calculated as shown in Figure 14. The results of cable force identification obtained through the proposed method are shown in Table 5. Even in the presence of noise interference, the proposed method can accurately identify cable tension. The identified results show a slight increase compared to the case without noise interference, but the relative errors remain less than 1%. Significantly, the cable force calculation formula proposed in this method does not involve signal processing issues and requires only the substitution of the corresponding modal parameters to obtain the cable force. If noise affects the accuracy of the modal identification parameters, it will inevitably affect the accuracy of the proposed method. Therefore, the anti-noise capacity comes from the anti-noise capacity of the SSI method.
| Theoretical cable force (kN) | γ1 | Noise level | First-order frequency f1 (Hz) | Mode shape value | Identified cable force (kN) | Relative error (%) | ||
|---|---|---|---|---|---|---|---|---|
| ϕ0 | ϕ1 | ϕ2 | ||||||
| 726.80 | 10% | 0 | 17.05 | 0.7503 | 0.2497 | 0.2497 | 726.04 | −0.10 |
| 10% | 17.06 | 0.7473 | 0.2521 | 0.2533 | 730.13 | 0.46 | ||
| 20% | 17.05 | 0.7481 | 0.2528 | 0.2511 | 728.50 | 0.23 | ||
| 30% | 17.05 | 0.7515 | 0.2515 | 0.2456 | 724.46 | −0.32 | ||
| 25% | 0 | 18.85 | 0.8868 | 0.1132 | 0.1132 | 727.77 | 0.13 | |
| 10% | 18.87 | 0.8880 | 0.1131 | 0.1109 | 727.86 | 0.15 | ||
| 20% | 18.83 | 0.8801 | 0.1199 | 0.1199 | 732.59 | 0.80 | ||
| 30% | 18.82 | 0.8845 | 0.1197 | 0.1113 | 727.74 | 0.13 | ||
| 50% | 0 | 19.56 | 0.9406 | 0.0594 | 0.0594 | 730.56 | 0.52 | |
| 10% | 19.56 | 0.9412 | 0.0597 | 0.0579 | 730.06 | 0.45 | ||
| 20% | 19.56 | 0.9446 | 0.0514 | 0.0595 | 727.58 | 0.11 | ||
| 30% | 19.55 | 0.9391 | 0.0595 | 0.0623 | 731.63 | 0.66 | ||
| 100% | 0 | 19.93 | 0.9699 | 0.0301 | 0.0301 | 731.98 | 0.71 | |
| 10% | 19.93 | 0.9695 | 0.0313 | 0.0298 | 731.98 | 0.71 | ||
| 20% | 19.93 | 0.9690 | 0.0299 | 0.0322 | 732.55 | 0.79 | ||
| 30% | 19.93 | 0.9717 | 0.0278 | 0.0287 | 730.08 | 0.45 | ||
4. Experimental Validation
In this section, a model of the cable with elastic boundary supports is first constructed in the laboratory, and the tension experiment is carried out under various working conditions. Then, the cable force is measured simultaneously using a tension sensor and the proposed method, with the results compared and analyzed.
4.1. Experimental Setup
The cable model with elastic boundary supports comprises a lever hoist with a capacity of 6 t, two axial springs, two transverse springs, a cable, and a tension sensor, which are connected sequentially through hooks or loops, as illustrated in Figure 15. Steel supports are employed to anchor the model to the ground, and a mounting plate and bolts are used to secure one end of the lever hoist and tension sensor to the steel supports. To accurately simulate the elastic support at both ends of the cable, a tension spring is attached at the lower end of the cable head. The tension spring is stretched using the lever hoist to maintain it within the elastic deformation range, as shown in Figures 15(c) and 15(d). The experimental cable is manufactured by a professional cable factory according to the design drawings, and the basic parameters are as follows: diameter of 13 mm, length of 4 m, mass per unit length of 1.32 kg/m, elastic modulus of 1.95 × 10¹¹ Pa, and rated breaking force of 124.4 kN. These basic parameters were retested in the laboratory to ensure compliance with the experimental requirements.
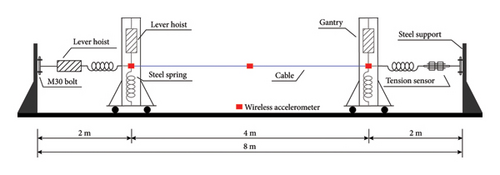
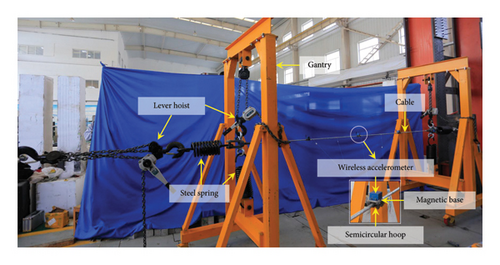
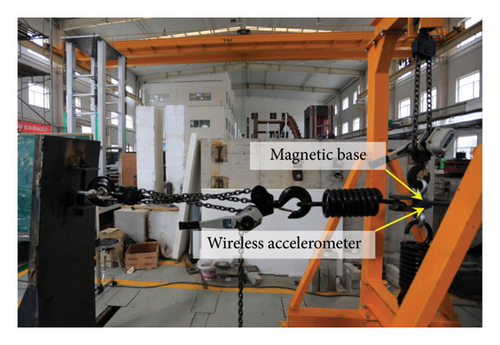
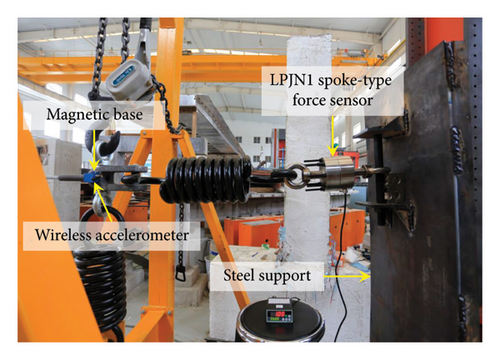
In the experiment, the cable was subjected to three different initial tensions in the horizontal direction using a lever hoist, specifically 1, 1.5, and 2 t (limited by the load-bearing capacity of the steel supports). The elastic boundary support for the cable was configured with three equal stiffness values (γ1 = 0.5%, 2.5%, and 5%) and two unequal stiffness values (γ2 = 1 : 5 and 1 : 10). The cable force was measured using an LPJN1 spoke-type force sensor manufactured by New Transform Technology Co., Ltd, which is regarded as the reference value, as shown in Figure 15(d). The force sensor was calibrated at the Shenzhen New Transform Technology laboratory of metrology with an accuracy of 0.05% F.S. To generate responses, manual excitation of the cable was performed. Acceleration measurement points were placed at the midpoint and both endpoints of the cable. The ZY-A3-7 wireless accelerometer and its accompanying system developed by Beijing Zhengyuan IOT Technology Co., Ltd, as shown in Figure 15(b), were utilized to collect the cable responses with a sampling frequency of 1000 Hz.
The installation and experimental procedure are as follows: (1) Insert M30 bolts into the reserved holes of the steel supports at both ends and the gantry beam plates. Attach one hook of the lever hoist to the bolt rod of the upper beam and the other hook to the upper lifting ring of the cable. (2) Connect the supporting spring for the test conditions between the lower lifting ring of the cable and the lower beam bolt rod, as shown in Figure 15(b). Tighten the lever hoists on both gantries to ensure that the supporting spring at the lower end of the cable remains within its elastic limit, while also ensuring that the cable is level at both ends. (3) As shown in Figure 15(d), connect the LPJN1 spoke-type force sensor to the M30 bolt on the right steel support. Attach one end of the axial spring to the lifting ring of the force sensor, and the other end to the pin of the cable. (4) As shown in Figure 15(c), connect one hook of the lever hoist to the M30 bolt on the left steel support. Attach one end of the axial spring to the other hook of the lever hoist and connect the other end of the spring to the pin of the cable. At this point, the assembly of the cable with elastic boundary supports is complete. (5) Fix the sensor support at the midpoint of the cable using a special fixture. Three wireless accelerometers are magnetically mounted on the cable at both ends and at the midpoint, as shown in Figure 15(b). Slightly adjust the direction of the accelerometers to ensure they capture the transverse vibration response of the cable. The vibration test can begin once the force sensor display is activated. (6) Tighten the left-end lever hoist and apply three different tensions to the cable through the axial spring force. After the force sensor readings stabilize, excite the cable at one-third of its length to induce free vibration. At the same time, three accelerometers collect vibration responses of the cable. After completing the measurements, replace the transverse spring and repeat the process to obtain the vibration responses of the cable under different conditions.
4.2. Experimental Results
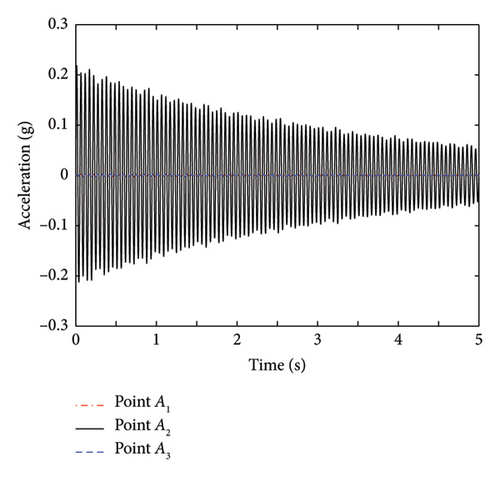
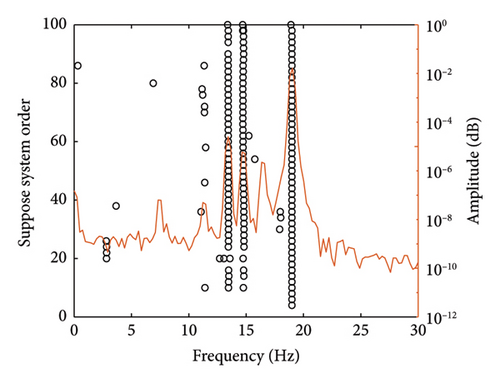
The time-history curves of acceleration for an operating condition are shown in Figure 16. The stability diagram and frequency spectrum curve for the midpoint measurement point are then obtained using the SSI method, as shown in Figure 17. The first-order frequencies and corresponding mode shape values of the cable are determined for various conditions. The results of cable force identification obtained by the proposed method are listed in Tables 6 and 7.
| Theoretical cable force (kN) | γ1 | First-order frequency f1 (Hz) | Mode shape value | Identified cable force (kN) | Relative error (%) | ||
|---|---|---|---|---|---|---|---|
| ϕ0 | ϕ1 | ϕ2 | |||||
| 10 | 0.5% | 10.43 | 0.9420 | 0.0596 | 0.0565 | 9.86 | −1.36 |
| 2.5% | 10.81 | 0.9924 | 0.0018 | 0.0133 | 9.96 | −0.36 | |
| 5.0% | 10.74 | 0.9583 | 0.0501 | 0.0332 | 10.24 | 2.41 | |
| 15 | 0.5% | 12.16 | 0.8788 | 0.0653 | 0.1758 | 14.55 | −3.03 |
| 2.5% | 13.22 | 0.9685 | 0.0256 | 0.0375 | 15.33 | 2.18 | |
| 5.0% | 13.00 | 0.9486 | 0.0425 | 0.0603 | 15.19 | 1.28 | |
| 20 | 0.5% | 14.96 | 0.9245 | 0.0614 | 0.0896 | 20.73 | 3.65 |
| 2.5% | 15.21 | 0.9823 | 0.0115 | 0.0239 | 19.95 | −0.23 | |
| 5.0% | 14.77 | 0.9129 | 0.0824 | 0.0918 | 20.50 | 2.51 | |
| Theoretical cable force (kN) | γ2 | First-order frequency f1 (Hz) | Mode shape value | Identified cable force (kN) | Relative error (%) | ||
|---|---|---|---|---|---|---|---|
| ϕ0 | ϕ1 | ϕ2 | |||||
| 10 | 1:1 | 10.43 | 0.9420 | 0.0596 | 0.0565 | 9.86 | −1.36 |
| 1:5 | 10.27 | 0.9320 | 0.0960 | 0.0395 | 9.68 | −3.24 | |
| 1:10 | 9.85 | 0.8537 | 0.1786 | 0.1136 | 9.87 | −1.26 | |
| 15 | 1:1 | 12.16 | 0.8788 | 0.0653 | 0.1758 | 14.55 | −3.03 |
| 1:5 | 12.23 | 0.8686 | 0.0330 | 0.2254 | 14.90 | −0.68 | |
| 1:10 | 13.08 | 0.9556 | 0.0410 | 0.0477 | 15.24 | 1.61 | |
| 20 | 1:1 | 14.96 | 0.9245 | 0.0614 | 0.0896 | 20.73 | 3.65 |
| 1:5 | 14.68 | 0.9377 | 0.0282 | 0.0960 | 19.63 | −1.85 | |
| 1:10 | 14.43 | 0.9269 | 0.0153 | 0.1295 | 19.23 | −3.87 | |
For an elastic-supported cable with either equal or unequal boundary stiffness, the proposed method can accurately identify the cable forces, with relative errors mostly remaining below 3%. It should be noted that even though the spring stiffness in the laboratory model is known, the actual axial and transverse constraints of the cable may not be exactly equal to the spring stiffness, which is the comprehensive stiffness formed by the supporting springs, hand hoists, and other components connected in series. Only when the boundary stiffness of the cable is relatively high, the spring stiffness approximate the actual support stiffness. Additionally, the proposed method does not need to know the boundary constraint stiffness, and its influence has been considered in the cable force calculating formula through the mode shape values of the endpoints. Therefore, the proposed method is not affected by the boundary stiffness and achieves better cable force identification results.
Comparing the identification results between numerical simulations and model experiments, it can be observed that the proposed method demonstrates a significant improvement over the other methods. However, the improvement under certain working conditions is not as pronounced as that observed in the numerical simulation. The primary reason for this disparity is the limitations imposed by the experimental setup and equipment capacity. The maximum loading level in the model experiment is only 20 kN, while the maximum cable force set in the numerical simulation is 726.80 kN. Therefore, when higher force levels are considered, the proposed method has a greater advantage over the other methods in cable force identification, and the contrasting effect between the proposed method and the others becomes more evident.
5. Engineering Validation of FAST
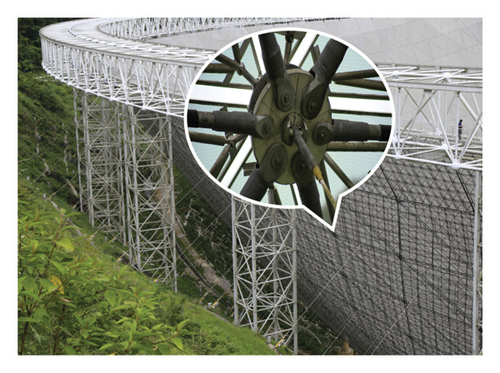
The FAST is the largest and most precise cable-network structure in the world. It is also the first telescope to operate in an active displacement working mode, and the overall structure of FAST is depicted in Figure 18(a). The FAST structure primarily consists of three parts: the active reflector system, the measurement and control system for the feed support system, and the receiver and terminal system. To achieve the active displacement function of the radio telescope, the support structure of the active reflector incorporates a prestressed cable-net structure that relies on a flexible substrate. The primary cable net, hydraulic actuators (Figure 18(b)), controllers, and other integral elements work collectively to dynamically adjust the reflector’s shape, forming an instantaneous parabolic surface with a diameter of 300 m in the observation direction [44–46]. This continuous reciprocating motion state of the main cable network leads to high levels of internal stresses in the cables, making them susceptible to relaxation and fatigue. Consequently, measuring cable forces is crucial for the modification of the overall FEM, the safety assessment of the reflector surface, and the accurate operation of the reflector control system.

In this section, a tensioning experiment of single prototype cable at the cable factory is conducted. The cable tensions obtained through the proposed method are then compared and analyzed. Subsequently, thirty edge cables are selected for on-site measurements, and some of the results are compared with those of the original magnetic flux-based force sensor.
5.1. Prototype Validation of Single Cable
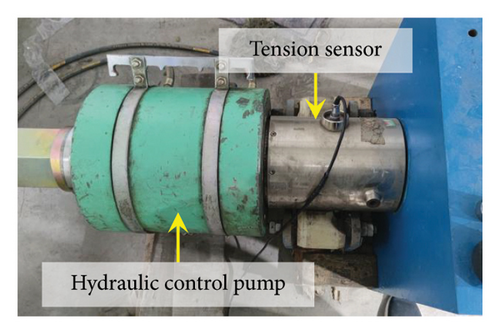
The prototype experiment for the single cable was conducted at a cable factory. The specifications of the employed S6J cable are as follows: cable length of 12.16 m, nominal cross-sectional area of 898.8 mm2, mass per unit length of 9.19 kg/m, elastic modulus of 1.90 × 10¹¹ Pa, and ultimate tensile strength of 1671.77 kN. As shown in Figure 19(a), a hydraulic loading machine was used to tension the cable, allowing direct reading of the tension values. The cable in the experiment was connected to the hydraulic press at both ends, utilizing the same anchors as those employed in the FAST cable network, as illustrated in Figure 19(b), aiming to replicate the cable connections in the cable-net structure as accurately as possible. A controlled hydraulic pump was used to apply loads at five different levels, and the corresponding tension values were recorded in real time. Simultaneously, an artificial excitation was applied to the cable, and the resulting acceleration response data at the midpoint and endpoints of the cable were collected using the previously mentioned accelerometer. The collected data were then processed using the proposed method for cable force identification. What needs illustration is that the actual constraint stiffness in the experiment is a composite stiffness formed by components such as anchor connections and steel loading frames, which is not generated by the spring as in the model experiment.
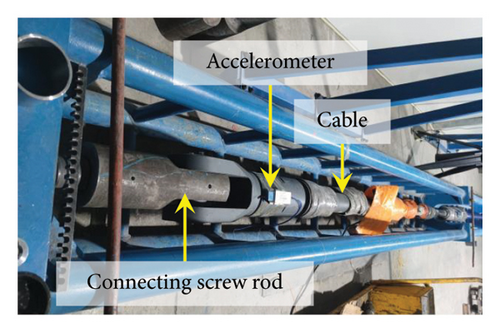
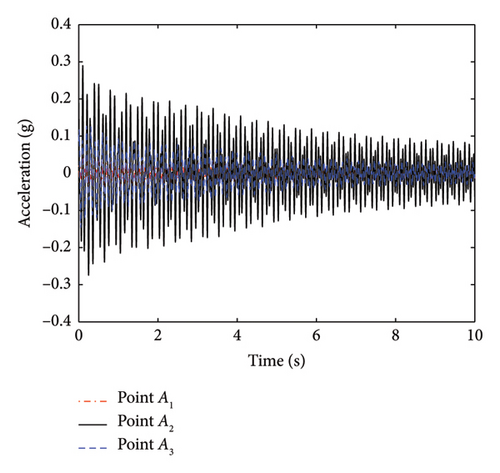
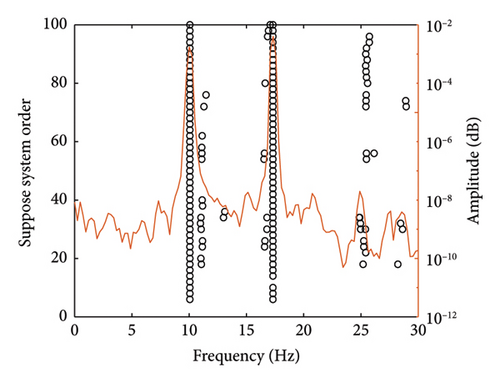
The acceleration time histories for a specified loading condition are shown in Figure 20. The corresponding stability diagram and frequency spectrum curve for the midpoint measurement point are shown in Figure 21. The results of the cable force identification for all loading levels are summarized in Table 8. It can be found that the proposed method accurately determines the tension levels for each loading condition, with relative errors less than 5%, indicating excellent performance in cable force identification and meeting the required precision for engineering applications. It is worth noting that the mode shape values observed at both ends of the experimental cable are not zero. This is because the cable head connected with the loading frame is not an ideal hinge and there is a certain elastic constraint that is closer to the elastic support boundary conditions.
| Reference cable force (kN) | First-order frequency (Hz) | Mode shape value | Identified cable force (kN) | Relative error (%) | ||
|---|---|---|---|---|---|---|
| ϕ0 | ϕ1 | ϕ2 | ||||
| 417 | 7.59 | 0.7877 | 0.0813 | 0.3351 | 413.50 | −0.84 |
| 556 | 8.59 | 0.7279 | 0.2011 | 0.3403 | 582.64 | 4.79 |
| 665 | 9.15 | 0.7551 | 0.1743 | 0.3130 | 632.56 | −4.88 |
| 695 | 9.39 | 0.7470 | 0.2487 | 0.2572 | 675.97 | −2.74 |
| 834 | 10.05 | 0.7040 | 0.1081 | 0.4654 | 820.46 | −1.62 |
5.2. On-Site Validation of a Cable-Net Structure
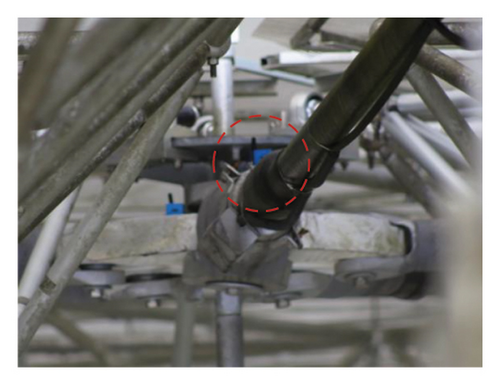
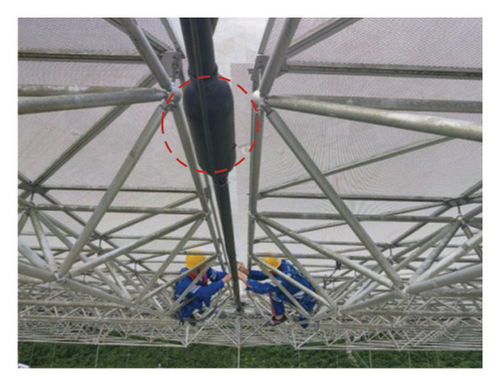
To further validate the applicability of the proposed method in engineering, several edge cables were selected from the FAST cable-net structure. During the maintenance and repair operations, three wireless accelerometers were installed at the midspan and ends of each cable by magnetic base adsorption. These accelerometers were connected to a data acquisition system for real-time signal acquisition and storage, with a sampling rate of 200 Hz. Additionally, magnetic flux sensors were installed on these cables during the construction of FAST. However, they could only measure cable forces during maintenance and repair operations due to the requirement of electromagnetic silence. The values measured from these magnetic flux sensors were used as reference values for comparison, and the sensor layout is illustrated in Figure 22.
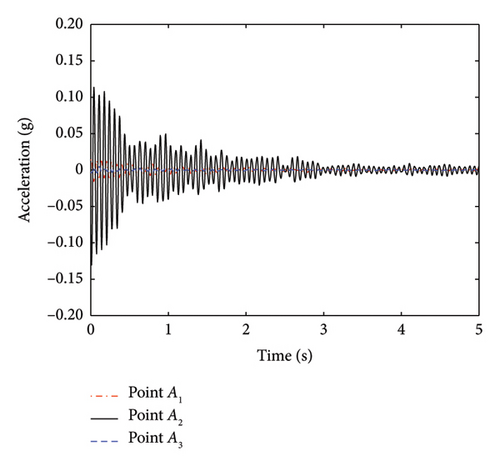
The acceleration response of selected cables is shown in Figure 23 and the basic parameters of cables, frequency, mode shape value, and the results of cable force identification are listed in Table 9, which are also compared with the reference values measured by magnetic flux sensors. It can be seen that the maximum relative error between the proposed method and the magnetic flux measurement is 4.93%, which is within 5%. The proposed method considers the effects of complex boundary conditions and corrects the first-order frequency based on the mode shape values. As a result, the results of cable force identification are more accurate. It is important to note that the accuracy of the magnetic flux sensor depends heavily on the laboratory calibration and may introduce some errors during the long-term measurements, which means that the relative errors calculated in Table 9 do not reflect the actual accuracy of the proposed method. Nonetheless, the close agreement between the proposed method and the results obtained from the magnetic flux sensor demonstrates that the proposed method meets the requirements for engineering applications.
| Cable | Length (m) | Line mass (kg/m) | First-order frequency (Hz) | Mode shape value | Magnetic flux sensor (kN) | Identified cable force (kN) | Relative error (%) | ||
|---|---|---|---|---|---|---|---|---|---|
| ϕ0 | ϕ1 | ϕ2 | |||||||
| A32 | 9.20 | 12.79 | 10.34 | 0.8465 | 0.0342 | 0.2664 | 572.70 | 562.26 | −1.82 |
| A34 | 9.00 | 13.20 | 8.21 | 0.5665 | 0.1407 | 0.6749 | 564.60 | 536.74 | −4.93 |
| A38 | 7.33 | 15.59 | 13.02 | 0.9208 | 0.0543 | 0.1038 | 656.50 | 625.66 | −4.70 |
| A40 | 6.27 | 12.99 | 12.30 | 0.3963 | 0.3787 | 0.7859 | 826.10 | 854.53 | 3.44 |
6. Summary and Conclusions
This paper proposes a methodology for cable force identification with unknown and variable elastic boundary supports. The innovation of this method lies in establishing a mathematical relationship between the frequencies of ideal hinged cables and cables with elastic boundary supports through an equivalent SDOF model. This approach avoids solving the transcendental equations iteratively or fitting the calculation formulae of cable tension. The accuracy and effectiveness of this method are validated through numerical simulations and tension experiments. Parametric analysis indicates the excellent identification performance and noise resistance of the proposed method. Finally, the accuracy of the proposed method is validated through the use of single cable and the cable-net structure of FAST, which further confirms the engineering applicability of the proposed method.
For cables with variable elastic boundary support, directly using the first-order frequency for cable force identification typically results in underestimated forces. The proposed method amends this issue by adjusting the first-order frequency using mode shape values, resulting in a more accurate identified force. The research findings reveal that axial support springs have no impact on cable modal parameters. The proposed method has no usage restrictions for cables with equal boundary stiffness and can accurately and stably identify cable forces regardless of variations in boundary stiffness, while for cables with unequal boundary stiffness, the minimum spring stiffness of the transverse support should be equal to or greater than 1% of the cable line stiffness, and the stiffness ratio between the two supports should be equal to or greater than 1/100. Furthermore, on-site measurements of both single cable and cable-net structure of FAST demonstrate that the proposed method meets the accuracy requirements for practical engineering, with the relative errors of cable force identification consistently below 5%.
In conclusion, the proposed method can accurately identify cable forces using known cable parameters and vibration data from three measurement points. It is particularly suitable for cables with unknown and variable boundary constraint stiffnesses. This method holds significant potential for application in online cable force monitoring for innovative and smart structural systems with variable configurations. Future work will further discuss the influence of bending stiffness and sag, and provide the applicability range of the proposed method.
Conflicts of Interest
The authors declare no conflicts of interest.
Funding
This research was supported by the National Natural Science Foundation of China (Grant No. 52027811) and the Dalian High-Level Talent Innovation Support Program (Grant No. 2019RD01).
Acknowledgments
This research was supported by the National Natural Science Foundation of China (Grant No. 52027811) and the Dalian High-Level Talent Innovation Support Program (Grant No. 2019RD01).
Open Research
Data Availability Statement
All data, models, or code that support the findings of this study are available from the corresponding author upon reasonable request.


