Experimental Study on the Damping Ratio Evaluation of a Cable-Stayed Bridge Based on Damping Dissipation Function
Abstract
Damping ratio is a fundamental dynamic parameter of the structure. Recent monitoring of cable-stayed bridges has shown that the damping ratio changes under different operating conditions. In general, the damping ratio of a structure can only be evaluated after the structure is built, and it is still challenging to theoretically calculate the damping ratio of a structure beforehand. To further understand the mechanism of the bridge damping ratio, this paper proposes an evaluation method based on the damping dissipation function. The effects of the initial and modal strain energy of the structure on the damping dissipation are considered. The damping dissipation function of substructures of a laboratory cable-stayed bridge model was tested, and the structural system damping ratio was evaluated. Furthermore, the theoretical discussion and experimental verification of the effect of support friction on the damping ratio were conducted. The results indicate that the damping ratio of the substructure varies with both the vibration amplitude and the initial stress level. Consideration of the initial strain energy during testing the substructure damping dissipation function can lead to more accurate results in the evaluation of the damping ratio of the structural system. In addition, support friction also significantly influences the damping ratio of the longitudinal drift and vertical bending modes of the structure.
1. Introduction
Damping is a critical dynamic parameter of the structure, responsible for dissipating energy during structural vibration. The damping ratio is commonly employed to quantitatively characterize the damping effect across different modes of a structure. Structures with low damping ratios are highly susceptible to abnormal vibrations under dynamic loading. Large-span bridges, in particular, are typically characterized by low damping, making them very sensitive to phenomena like wind-induced vibrations [1]. Therefore, it is important to analyze and monitor the damping ratio of bridges.
Numerous experiments have been tested to determine the damping ratio of real bridges. In general, large-span bridges have relatively low damping ratios. Tsing Ma suspension bridge has a span of 1377 m, a first-order frequency of 0.117 Hz, and a damping ratio of 0.68% [2]. Xihoumen Bridge is a suspension bridge with a main span of 1650 m, a first-order frequency of 0.0953 Hz, and a damping ratio of 0.57% [3]. The spanning capacity of cable-stayed bridges is lower as compared to suspension bridges. Sutong Bridge has a span of 1088 m and a first-order frequency of 0.185, which corresponds to a damping ratio of 0.5% [4]. The first three orders of self-oscillation frequency and damping ratio of 10 suspension and cable-stayed bridges are collected from published papers [2–8], as shown in Figure 1. The frequency is inversely proportional to the span, decreasing as the span increases. For a few short-span cable-stayed bridges, the damping ratio reaches more than 3%. Most suspension and cable-stayed bridges have damping ratios below 1%. Li et al. [9] counted the damping ratios of simply supported bridges, continuous girder bridges, continuous rigid-frame bridges, and arch bridges and gave recommended values for design, which were 3.5%, 4%, 2.5%, and 2.5%, respectively. Overall, the distribution of damping ratios is rather discrete, unlike the significant correlation between frequency and span.
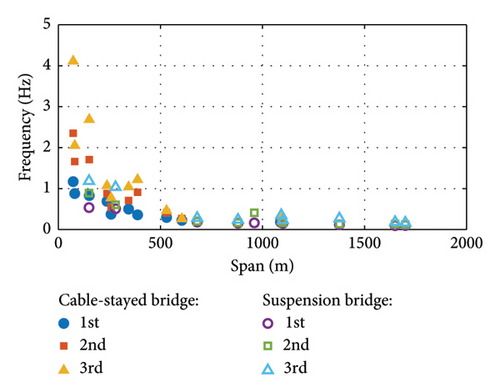
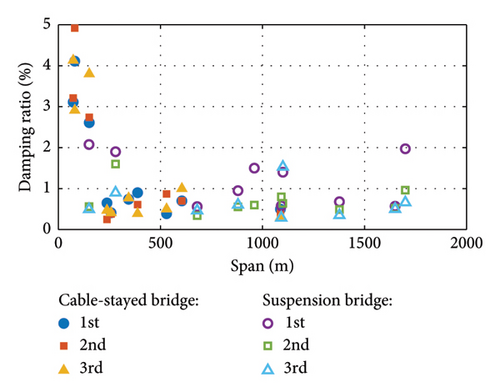
With the widespread installation of bridge health monitoring systems, many studies have explored the characteristics of damping ratios using data collected from bridges. Ni, Zhang, and Liu [4] tested the dynamic characteristics of a cable-stayed bridge with a main span of 1088 m. The test results for three different seasons showed that the uncertainty in the damping ratio was larger compared to the frequency. Li et al. [3] measured the damping ratio of a suspension bridge during vortex vibration and found that the damping ratio has a tendency to increase with increasing wind speed. Hwang et al. [10, 11] analyzed 2.5 years of monitoring data from a cable-stayed bridge and observed that the damping ratio increases with the root mean square of acceleration. Additionally, they found a negative correlation between the damping ratio and temperature. Dan et al. [12] investigated the effect of traffic loads on the dynamic characteristics of suspension bridges and demonstrated that traffic loads contribute to damping. Shang et al. [13] proposed an automatic extraction method for the attenuation response and identified the Z24 damping ratio. Similarly, Gong et al. [14, 15] also utilized the method of extracting the attenuation response to identify the damping ratio of a cable-stayed bridge. The results indicated that the damping ratio was related to the traffic load and negatively related to the temperature. Cheynet et al [16]. identified the damping ratios of a bridge using the free decay response due to traffic loading and concluded that this method is more accurate than the stochastic subspace method. In addition, some studies [17, 18] have been conducted to improve the recognition accuracy of the damping ratio. Understanding the underlying mechanism of bridge damping remains a challenge in the field of study.
The sources of bridge damping are typically categorized into three components [19]: material damping [20], friction damping [19], and medium damping [21]. Material damping arises from molecular motion within the material. Studies on metals [20, 22] and concrete [23, 24] have demonstrated that material damping is related to vibration amplitude, stress level, temperature, and other factors. Material damping is a nonnegligible part of the overall damping of a bridge, and the material type has a significant effect on damping. Since concrete material damping is significantly greater than steel, concrete main girders generally have higher damping than steel main girders as well. In the Chinese wind-resistant design code for highway bridges (JTG/T 3360-01-2018) [25], the damping ratio is taken not only according to the structural form of the main girder but also according to the material type. The values of modal damping ratio for vibration-dominated main girder are taken as 0.3% for steel box girders, 0.5% for steel truss girders, 1% for steel–concrete hybrid girders, and 2% for concrete girders. Frictional damping occurs due to frictional force in the contact parts of the components. There are many member contact surfaces in bridges that have the potential for frictional damping, such as bearing friction. In the seismic design of bridges, the friction of the bearings is usually utilized to increase the damping of the bridge, thus reducing the peak acceleration of the bridge. The support friction provides most of the damping under the action of ground vibration. Mustafa, Matsumoto, and Yamaguchi [26] evaluated the loss factor and the support friction coefficient of the substructure by means of the modal strain energy scaling method. In addition to bearing friction, the joints of structural members, such as bolted connections, are similarly frictionally damped. Gong et al. [19] investigated the nonlinear damping ratio of bridges induced by bolt joint friction, and the results showed that the joint friction also induces changes in the damping ratio of bridges. Friction damping is usually amplitude-dependent and varies with vibration amplitude [27]. Medium damping arises from the interaction of the structure with air, water, and other mediums. Air generates aerodynamic forces on the structure, where the term related to the velocity of the structure is aerodynamic damping [28]. It is possible for the aerodynamic damping to be negative, which means that instead of energy dissipation occurring due to air action, the structure absorbs energy from the air, causing an increase in the vibration response of the structure. In general, the contribution of these three types of damping is different in different situations, such as normal operation, earthquakes, and wind-induced vibrations.
Damping ratio assessment can be divided into two categories: damping force–based and damping energy–based models. The significant advantage of force-based damping models is that the damping ratios not only can be evaluated but also can be introduced into the dynamics equations to solve the response of the structure. For frictional and aerodynamic damping, theoretical models of friction and aerodynamic forces, respectively, can be used to assess the contribution of these two types of damping. A typical application of this is evaluating the damping effect of friction bearings in earthquake engineering applications [29]. The mechanism of material damping forces has not been fully investigated. To introduce the material damping effect in dynamic calculations, an assumed damping force, such as viscous damping, is usually used. However, for damping ratio assessment, the simple use of viscous damping is often inadequate due to its frequency dependence. In order to address the frequency dependence of proportional viscous damping, some studies [30] have used nonproportional viscous damping to match the obtained damping ratio with the measured values. These methods are effective in calculating the dynamic response of the structure but cannot be used to evaluate the damping ratio of the structure beforehand. The complex modal method has yielded positive results in assessing composite materials damping [31] and evaluating damper effectiveness [32, 33], providing a relatively accurate assessment of damping.
Due to the complexity of material damping forces, some studies have attempted to evaluate the damping ratio of structural systems using an energy-based approach, thereby avoiding assumptions about the damping forces. Kawashima, Unjoh, and Tunomoto [34] suggested that the damping dissipation of bridge members is related to the modal strain energy. They divided a cable-stayed bridge model into three substructures: towers, main girders, and cables. The damping dissipation functions of the substructures were tested experimentally, and the damping ratios were calculated. The results show that the calculated damping ratios were slightly smaller than the measured values, but the trends were consistent. Kawashima proposed that the discrepancy might be due to not considering friction and energy dissipation from the foundation. Yamaguchi and Ito [35] further simplified the damping dissipation function to a ratio of strain energy to evaluate the modal dependence of the damping ratio. Damping contribution of substructures in cable-stayed bridges is evaluated by strain energy. This strain energy proportion method was successfully applied to the damping assessment of an arch bridge [36] and a steel truss bridge [26]. For each mode, the strain energy is calculated and the loss factor of the substructure is calculated using the least squares method to assess the contribution of the substructure to the system damping ratio. Hua et al. [37] evaluated the damping ratio of steel–concrete composite bridges using the strain energy proportion method. The above study achieved satisfactory results and showed the potential of the energy-based method for damping assessment. However, these methods have not been fully validated, although some methods have been used on actual bridges. It is essential to understand the usage conditions and evaluate the effectiveness of these methods. For example, viscous damping assumes that the damping force is proportional to the velocity, and strain energy proportional damping assumes that the energy dissipated by material damping is proportional to the strain energy. And the application conditions of these methods are not clear.
In terms of damping ratio experiments, sufficient testing of the cable-stayed bridge model and its components is still limited, quantifying the contributions of various components and damping types remains a challenge in evaluating the damping ratio of cable-stayed bridge. This study attempts to evaluate the effectiveness of existing methods and analyze the effect of individual components on the overall damping by testing the damping ratios of each component and the whole of the cable-stayed bridge model. A cable-stayed bridge model is tested in this study, where the damping ratios of the structural system and substructures are measured. A series of experiments are conducted to illustrate the effect of stress level and support friction on the bridge damping ratio. Then, this research proposes a damping evaluation method for cable-stayed bridges based on the damping dissipation function. The variation in initial strain energy is further considered on the basis of Kawashima’s damping dissipation function. The damping dissipation function is assumed to be dependent on both modal strain energy and initial strain energy. In addition, the dynamic response under friction is calculated to evaluate the effect of support friction on the damping ratio. The research results contribute to the analysis of actual bridge damping monitoring. It should be noted that it is impractical to control the damping parameters in the experiment to be consistent with the real bridge. Therefore, the experimental conditions were not made to match those of the real bridge operation during the experiment. However, the experimental results obtained in this paper are still helpful for the understanding of the damping ratio mechanism.
The innovation of this paper lies in two points: (1) The effect of the initial strain energy of the structure on the damping ratio is found experimentally and evaluated by means of a strain energy–dependent damping model; (2) A calculation method for the frictional damping of the support is proposed and verified experimentally. In addition, this paper contributes to the experimental aspect of the cable-stayed bridge model: Each member of the bridge model and the bearing friction are tested. The damping ratios of the members at different stress levels are measured and the damping ratios of the cable-stayed bridge are analyzed for different damage scenarios. Using this benchmark experimental model, the effectiveness of other commonly used methods is evaluated.
2. Formulation of Damping Ratio
This section first introduces two types of damping models: force-based and energy-based models. Since this paper focuses on material damping and friction damping, the friction force model and the two types of material damping force models are introduced first, and the relationship between the corresponding damping force and the damping ratio is analyzed. The energy-based approach requires only the corresponding type of damping dissipation to evaluate the two types of damping. For material damping, it is common to use strain energy–dependent models to assess the material damping dissipation and hence the material damping energy dissipation. Finally, in Section 2.3, a comprehensive assessment method for the damping of cable-stayed bridges is presented. Within the framework of energy-based modeling, the corresponding damping dissipation is calculated using the friction model and the strain energy–related model, respectively, and then, the overall structural damping ratio is evaluated.
2.1. Force-Based Damping Model
The modal damping ratios for each order of the viscous damping model or the hysteretic damping model are obtained from the above equation.
2.2. Energy-Based Damping Model
Clearly, substituting equation (11) into equation (10) yields equation (5).
In fact, strain energy proportional damping and hysteretic damping are essentially the same in terms of results. For an SDOF system, the hysteretic damping dissipation is 2πξmω2A2 [39]; obviously, mω2A2/2 is the elastic potential energy. Thus, the hysteretic damping dissipation energy is also proportional to the strain energy and has the same form as equation (11). The hysteresis damping force can be regarded as the specific damping force corresponding to the strain energy proportion method.
A similar form was used in fitting the damping dissipation function by Kawashima et al. [34].
2.3. Damping Ratio Assessment for Cable-Stayed Bridges
From the above equation, the damping dissipation function for each member is evaluated separately, and together with other forms of damping dissipation such as bearing friction, the damping ratio of the bridge structural system can be calculated.
3. Experimental Setup and Results
3.1. Bridge Description
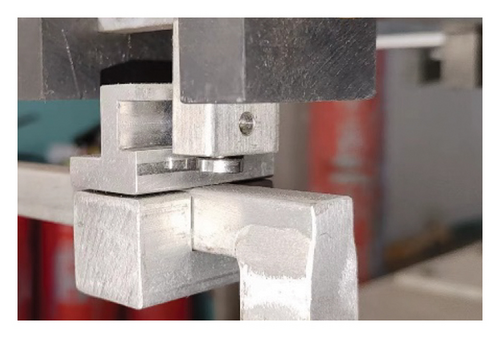
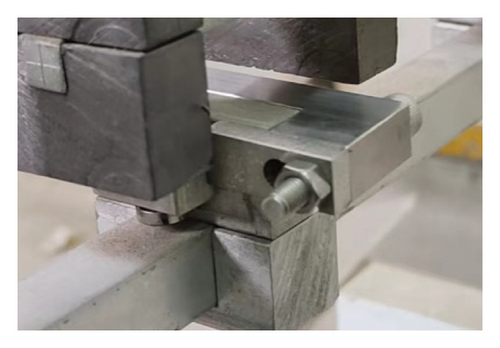
A two-tower cable-stayed bridge with a floating system is investigated. The girder and towers of the bridge are made of aluminum alloy, while the cables are simulated using wire ropes. The material properties of the bridge are shown in Table 1. The layout of the bridge is shown in Figure 2. The bridge has a main span of 3.6 m, side spans of 1.2 m, and a tower height of 1.2 m. There are 8 pairs of cables in total, C1∼C8. Counterweights are installed on the main girders and bridge towers at the node locations shown in Figure 2. The counterweights for the main girder are 1 kg and for the bridge tower are 0.8 kg and 0.4 kg. The counterweights are numbered in Figure 2. The photograph of the bridge is shown in Figure 3. The mass of the accelerometer installed on the bridge is only about 50 g, which is much smaller than the counterweight mass, so the effect of the accelerometer mass can be ignored. The bridge is a fully floating system with no longitudinal restraints on the main girders. The sliding support on the main beam is shown in Figure 4(a). To further analyze the effect of bearing sliding on the bridge damping ratio, this sliding bearing is fixed as shown in Figure 4(b). Therefore, during the experiment, the sliding or fixed bearing can be flexibly used to compare the change in damping ratio between the two cases.
| Elastic modulus (N/m2) | Inertial moment (m4) | Area (m2) | Density (kg/m3) | |
|---|---|---|---|---|
| Girder | 7.2 × 10¹⁰ | 4.2 × 10⁻⁹ | 1.3 × 10⁻⁴ | 2800 |
| Tower | 7.2 × 10¹⁰ | 6.0 × 10⁻⁹ | 2.1 × 10⁻⁴ | 2800 |
| Cable | 1.9 × 10¹¹ | — |
|
8015 |
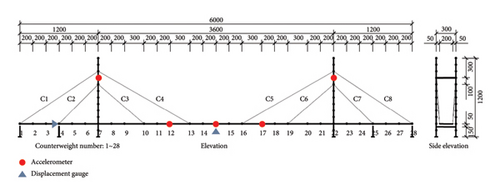

Accelerometers are installed on the main girder and towers to test the self-oscillating frequencies and modes. Laser displacement gauges are installed at the midspan and at the bearing location to measure the vertical displacement of the girder and the horizontal displacement at the bearing location, respectively. The sampling frequency of the sensors is 200 Hz. The frequency domain decomposition method is used to identify the natural frequencies and modal shapes.
A planar model of the bridge is developed in the commercial finite element software ANSYS, as shown in Figure 5. The main girder and towers are modeled using BEAM4 elements, and the cables are modeled using LINK10 elements. The model has a total of 67 nodes, 118 elements. The frequencies and modal shapes of the bridge are calculated and compared with the measured values; the results are shown in Table 2 and Figure 6. The bridge has a longitudinal drift frequency of 1.56 Hz and a first-order vertical bending frequency of 3.80 Hz. The first torsional mode of the bridge occurs at the 5th order with a self-oscillation frequency of 13.18 Hz and a damping ratio of 0.15%. Therefore, torsional and vertical bending coupling does not occur in the test. Since this higher torsional frequency does not correspond to the general bridge situation in practice, the torsional modes are not discussed further in this paper.

| Longitudinal drift mode | Vertical bending mode | |||
|---|---|---|---|---|
| 1st | 2nd | 3rd | ||
| Measured | 1.56 | 3.80 | 6.24 | 11.36 |
| FEM | 1.56 | 3.69 | 6.32 | 11.89 |
| Error (%) | 0.00 | 2.98 | 1.27 | 4.46 |


3.2. Experimental Setup and Damping Ratio Identification
- 1.
Substructure damping dissipation function test: The free decay processes of the substructures are tested under different initial strain energy Ui states. The initial strain energy of the substructure under gravity is changed by applying different counterweights. The variation in the damping ratio with vibration amplitude is analyzed to further calculate the variation in damping dissipation function with modal strain energy Un fitting the damping energy dissipation function f(Un, Ui) of the substructures from measured data.
- 2.
Damping ratio test of cable-stayed bridge structural system: The damping ratio of a cable-stayed bridge is tested under different counterweights and cable damage. The damping ratio test results of the structural system are used to verify the accuracy of the proposed method. In addition, the effect of support friction on the damping ratio is analyzed by comparing the results of sliding and fixed supports.
3.3. Results
3.3.1. Damping Ratio Test for Tower
-
Case T1: No additional counterweights are installed on the bridge tower.
-
Case T2: Installation of 1.6 kg extra mass at the top of the bridge tower.
-
Case T3: Installation of 3.2 kg extra mass at the top of the bridge tower.
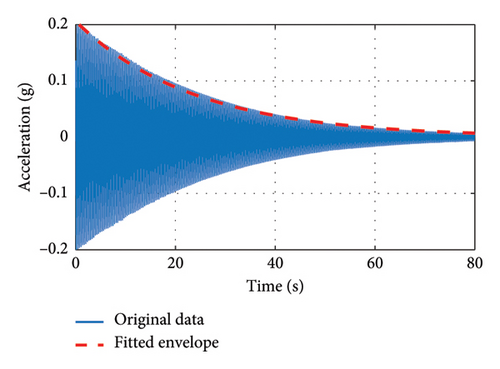
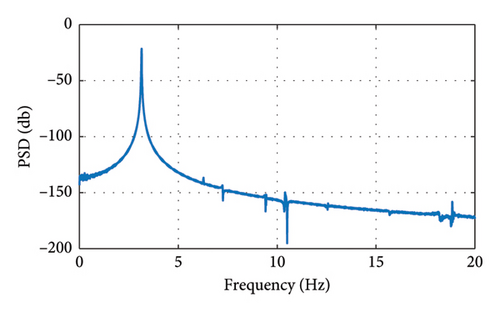
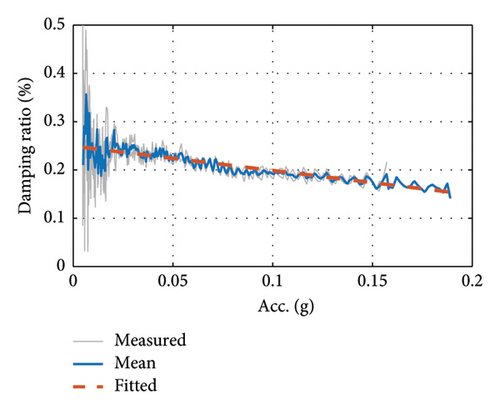
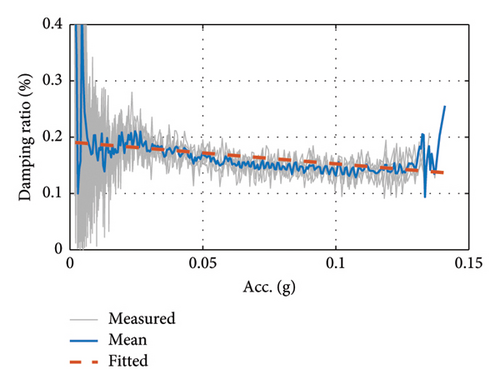
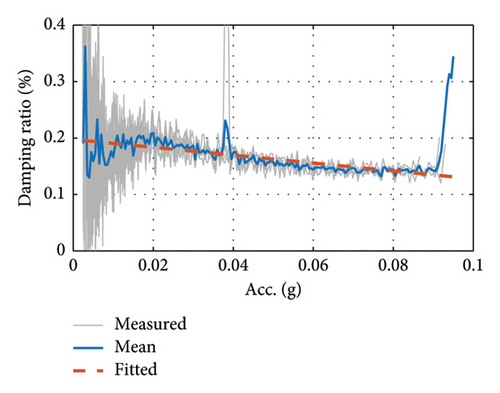
3.3.2. Damping Ratio Test for Cable
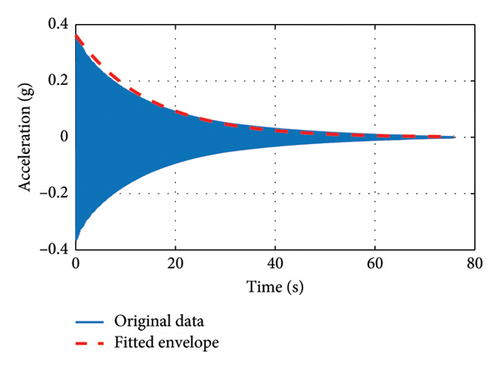
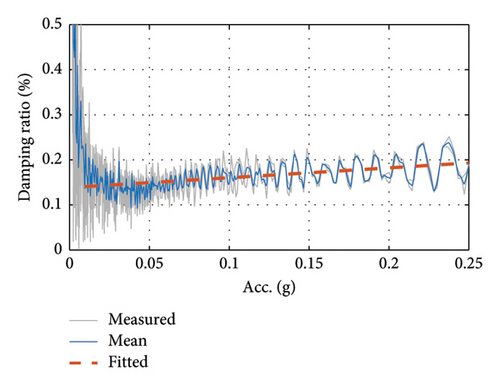
The damping ratio decreases with decreasing amplitude, opposite to the change in the damping ratio of the tower, which may be due to the different materials of the tower and the cable. Although the bridge tower is also involved in the vibration in this test, the damping ratios obtained from the test are both in the range of 0.1%–0.2%. This shows that the level of the damping ratio of the cable is close to that of the tower in the model, so it is acceptable to use the above equation as the result of the damping ratio of the cable.
3.3.3. Damping Ratio Test for Girder
-
Case G1: fixed support, remove counterweights No. 10–19, 4 kg counterweight on midspan;
-
Case G2: fixed support, remove counterweights No. 11–18, 6 kg counterweight on midspan;
-
Case G3: fixed support, remove counterweights No. 13–16, 10 kg counterweight on midspan;
-
Case G4: fixed support, added link support in the midspan, remove counterweights No. 11–18, 6 kg counterweight on midspan;
-
Case G5: fixed support, added link support in the midspan, remove counterweights No. 12–17, 8 kg counterweight on midspan;
-
Case G6: fixed support, added link support in the midspan, remove counterweights No. 13–16, 10 kg counterweight on midspan;
-
Case G7: fixed support, added link support in the three-quarter span, remove counterweights No. 12–17, 8 kg counterweight on midspan.
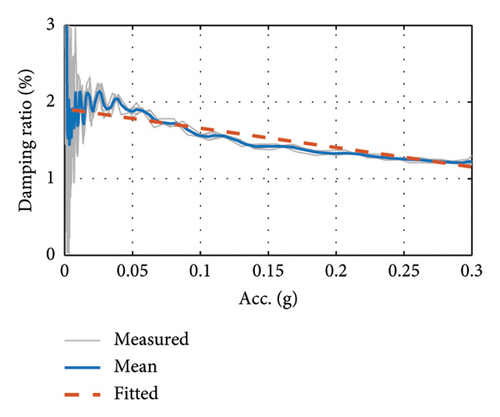
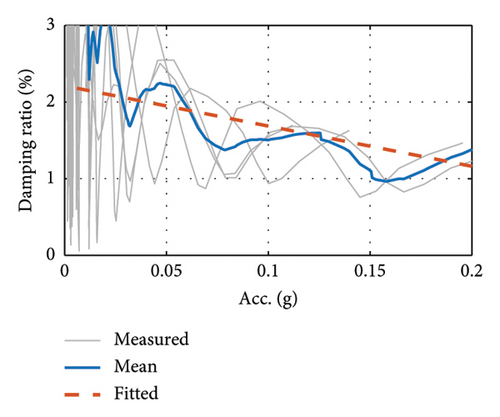
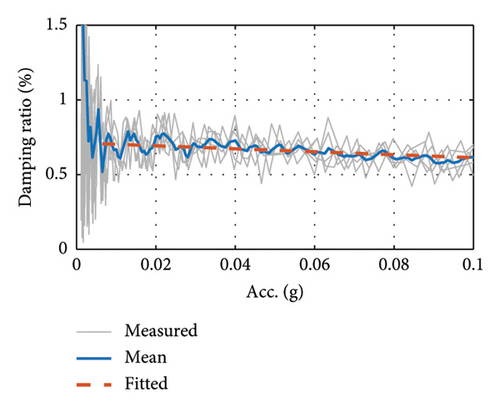
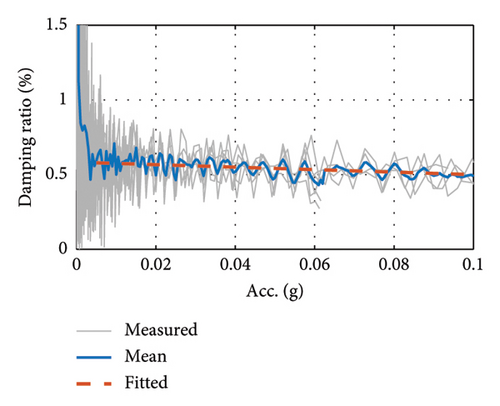
Table 3 shows the results of the damping ratio tests obtained from the envelope fitting method, reflecting the variation in the damping ratio for each case condition. From Cases G1 to G3, the 1st-order damping ratio increases from 0.71% to 1.71% as the girder mass decreases. In addition, the 2nd-order damping ratios of the girder, Cases G4 to G6, are significantly lower compared to the 1st order.
| Number of tests | 1 | 2 | 3 | 4 | 5 | Mean |
|---|---|---|---|---|---|---|
| Case G1 | 1.74 | 1.71 | 1.66 | 1.73 | — | 1.71 |
| Case G2 | 1.43 | 1.72 | 1.61 | 1.36 | 1.90 | 1.61 |
| Case G3 | 0.73 | 0.71 | 0.75 | 0.67 | 0.71 | 0.71 |
| Case G4 | 0.63 | 0.66 | 0.65 | 0.66 | 0.66 | 0.65 |
| Case G5 | 0.52 | 0.51 | 0.53 | 0.54 | 0.53 | 0.53 |
| Case G6 | 0.51 | 0.53 | 0.53 | 0.47 | 0.54 | 0.52 |
| Case G7 | 0.32 | 0.44 | 0.31 | 0.34 | — | 0.35 |

3.3.4. Damping Ratio Test for Cable-Stayed Bridge System
-
Case S1: sliding supports;
-
Case S2: fixed supports;
-
Case S3: fixed support, remove counterweights No. 13–16, 10 kg counterweight on midspan;
-
Case S4: fixed support, remove counterweights No. 10–19, 4 kg counterweight on midspan;
-
Case S5: fixed support, remove the cable C6, remove counterweights No. 13–16, 10 kg counterweight on midspan;
-
Case S6: fixed support, remove the cables C5 and C6, remove counterweights No. 13–16, 10 kg counterweight on midspan;
-
Case S7: fixed support, remove the cables C3 and C5∼C8, remove counterweights No. 13–16, 10 kg counterweight on midspan.
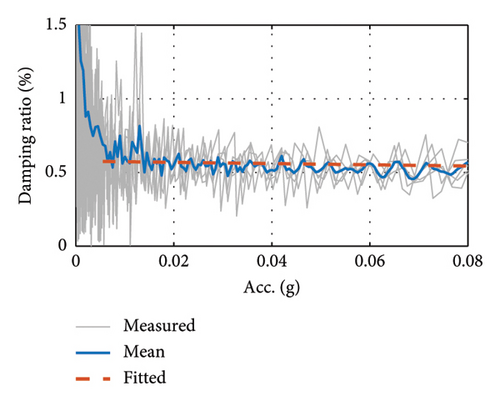
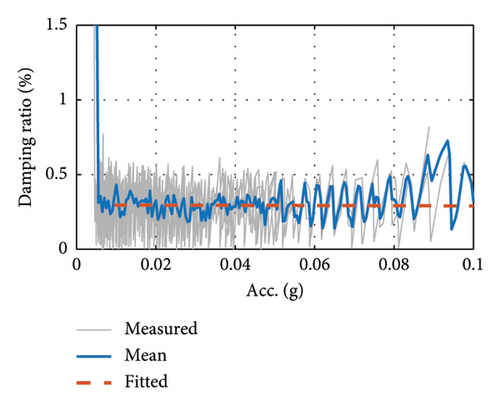
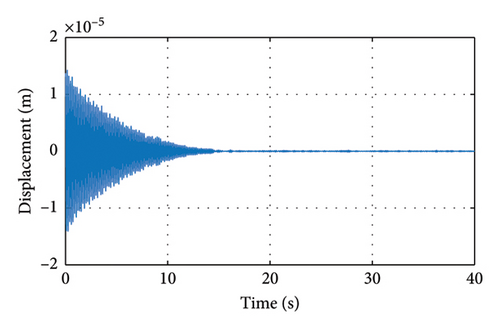
Figure 11 shows the midspan displacements and support displacements for Cases S1 and S2. The comparison of these two cases illustrates the effect of support sliding friction on the damping ratio. From the vertical displacements, it can be seen that Case S1 has a more significant displacement decay than S2 in the range of about 0–10 s, indicating a larger damping ratio. And this period of time corresponds exactly to the condition in Figure 11(b) where the support slides. Thus, friction does increase the damping ratio of the structure during the time that the support is sliding. And when the support is no longer sliding, in Case S2, there is still a small displacement in the bearing area, caused by the deformation of the abutment due to its nonrigidity. In order to clearly compare the effects of support friction, the first three orders of damping ratios are identified using acceleration data during support sliding, and the results are shown in Figure 12. It can be seen that the first three orders of damping ratios of the structure are increased after the occurrence of support sliding, which shows the effect of support sliding friction on the damping ratio. In addition, the sliding of the support also contributes to the large dispersion in the results of the damping ratio.
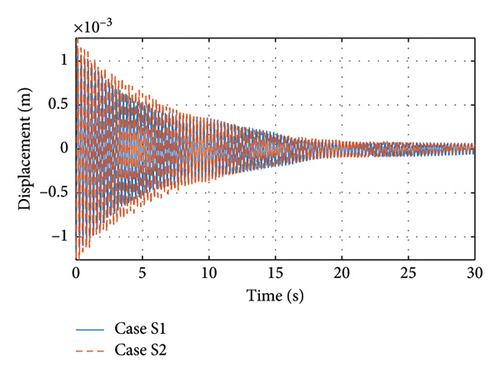
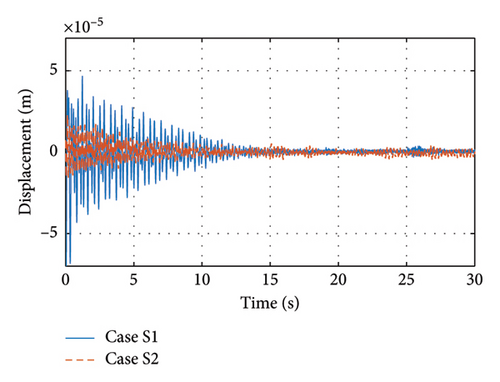
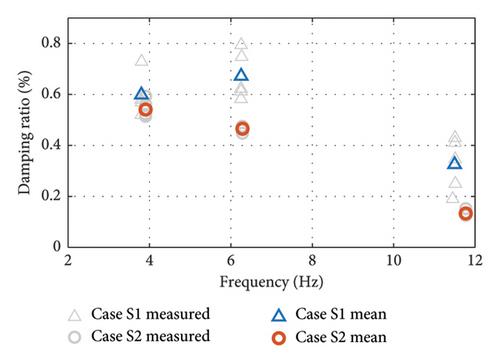
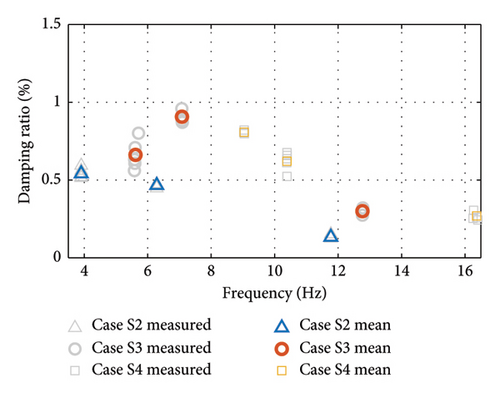
Figure 13 shows the bridge damping ratio with different counterweights installed on the main girder. Cases S3 and S4 remove the 4 and 10 kg counterweights from the beam, respectively. Compared to the original Case S2, both the S3 and S4 have increased the first three orders of damping ratios. This result shows the effect of the initial stress level of the bridge on the damping ratio. The reduction in the counterweight on the bridge leads to a decrease in the initial stress level of the bridge, and the damping ratio increases with the decrease in the initial stress level. This pattern of change is consistent with that of bridge towers and main girders.
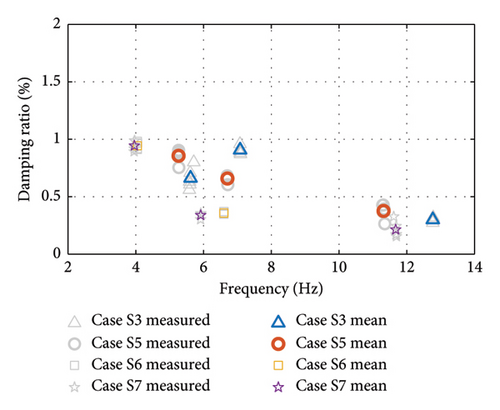
Cases S5∼S7 are based on S3, where the number of cables is varied in order to analyze the effect of changes in the force transfer path of the structural system on the damping ratio, as shown in Figure 14. As the number of cords decreases, the change in damping ratio does not show a clear pattern. The pattern of variation in the damping ratio needs to be further analyzed in conjunction with the strain energy of the structure. The first three orders of natural frequencies and damping ratios tested are summarized in Table 4.
| Case | Damping ratio (%) | Frequency (Hz) | ||||
|---|---|---|---|---|---|---|
| 1st | 2nd | 3rd | 1st | 2nd | 3rd | |
| S1 | 0.60 | 0.68 | 0.33 | 3.80 | 6.25 | 11.50 |
| S2 | 0.54 | 0.47 | 0.13 | 3.90 | 6.28 | 11.77 |
| S3 | 0.66 | 0.91 | 0.30 | 5.62 | 7.08 | 12.77 |
| S4 | 0.81 | 0.62 | 0.27 | 9.04 | 10.38 | 16.37 |
| S5 | 0.86 | 0.66 | 0.38 | 5.26 | 6.70 | 11.31 |
| S6 | 0.94 | 0.36 | — | 4.04 | 6.60 | — |
| S7 | 0.94 | 0.34 | 0.21 | 3.96 | 5.92 | 11.67 |
4. Discussion
This section first discusses the effect of support friction, analyzes the displacements of the support in different modes, and further calculates the equivalent damping ratio resulting from friction. Second, the damping dissipation function is obtained based on the strain energy analysis, and the damping ratio of the structural system is further evaluated.
4.1. Effect of Support Friction
4.1.1. Longitudinal Drift Mode
For the longitudinal drift mode, the support displacement is generated by the modal displacement. Thus, the modal shape can be normalized by the support displacement to obtain the modal mass m, damping c, and stiffness k as shown in Figure 15(a). The modal force generated by the friction force Fc in this case is still Fc, since the corresponding modal amplitude is 1.
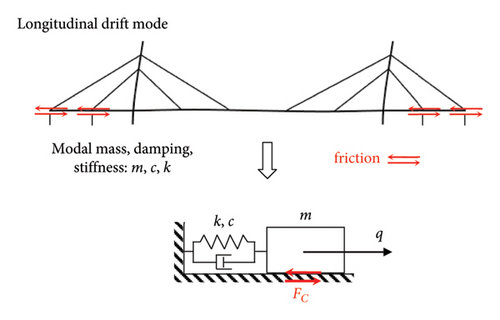
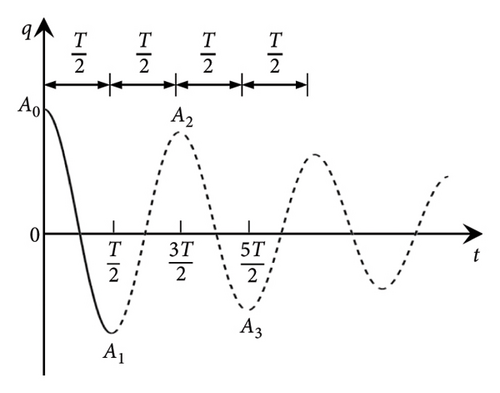
Obviously, the envelope of the free decay response no longer obeys an exponential decay in the presence of friction.
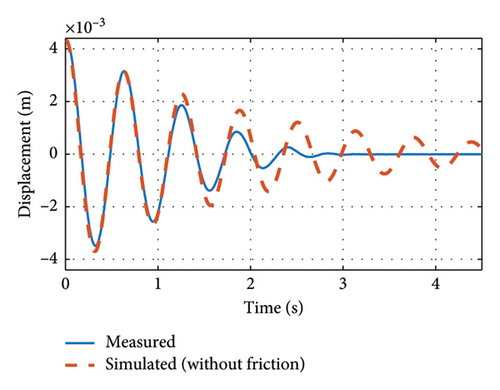
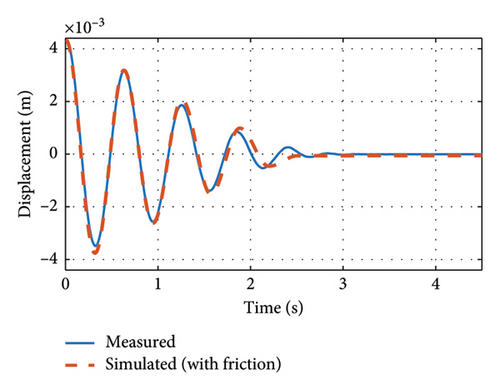
The longitudinal drift mode of the bridge was tested, and the horizontal displacements at the support locations are shown in Figure 16. The attenuation response curve is difficult to fit the measured values without considering friction, as shown in Figure 16(a) because the measured attenuation response is no longer in accordance with the exponential attenuation, while, with the consideration of friction, the calculated attenuation response can be easily matched with the measured value, as shown in Figure 16(b). The viscous damping ratio and the friction force are obtained by genetic algorithm optimization. The above results show a significant effect of support friction on the damping ratio of the longitudinal drift modes.
4.1.2. Vertical Bending Mode
There are two types of support displacements caused by the vertical bending modes of the structure: modal displacement and geometric deformation displacement, as shown in Figure 17. The modal displacement is caused by the coupling of the antisymmetric vertical bending mode with the longitudinal drift mode, while geometric deformation displacement mainly occurs in symmetric vertical bending modes. Since the total length of the girder is unchanged after the geometrical deformation, the displacement occurs at both ends.
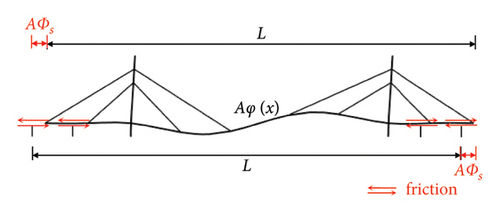
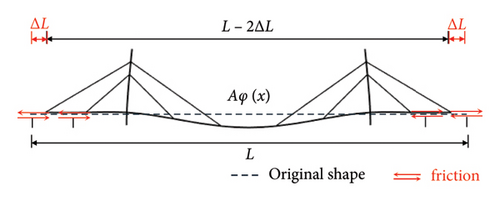
Modal displacements are discussed first. The support modal displacement ϕs can be obtained from the modal analysis. The modal displacement amplitude is A, and the support displacement is Aϕs, as shown in Figure 17(a).
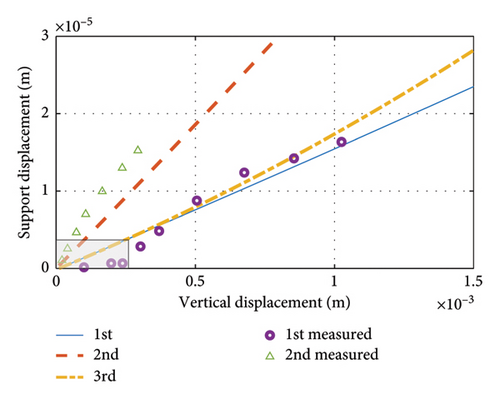
Figure 18 shows the vertical displacements versus support displacements for the first two orders. The points on the vertical displacement and support displacement envelopes are extracted and compared with the calculation results of the proposed method, as shown in Figure 19. The results show that the proposed method achieves satisfactory accuracy in calculating the bearing displacements. It can be noted that in the shaded region of Figure 19, even though there is a vertical displacement, the support displacement is almost zero. This suggests that in this region the support may not be able to overcome the friction and slide, implying that the actual friction has a more complex mechanism than in equation (1).
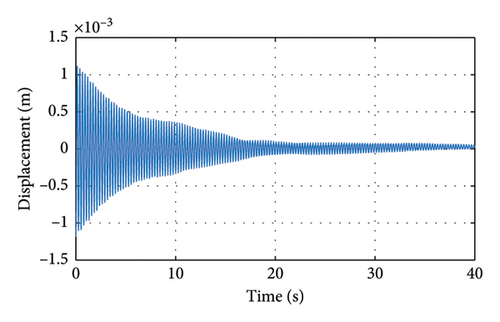
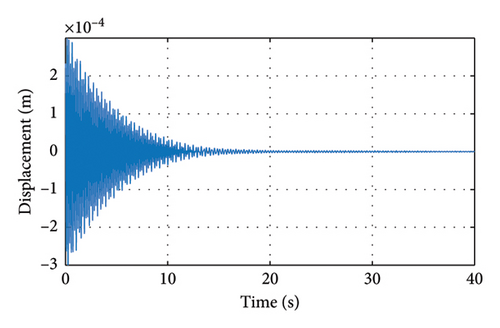
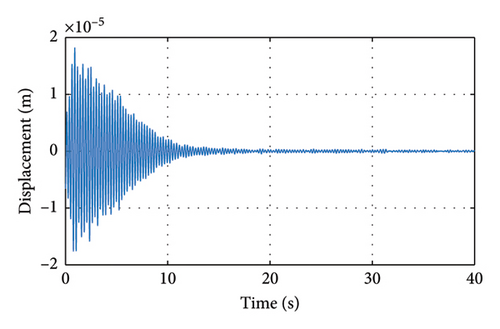
The damping ratio of the structure is evaluated using equation (29), where the friction fri is obtained by genetic algorithm optimization. The calculated results are shown in Figure 20, and after considering the friction damping, the obtained results are basically consistent with the working Case S1, which verifies the accuracy of the method.
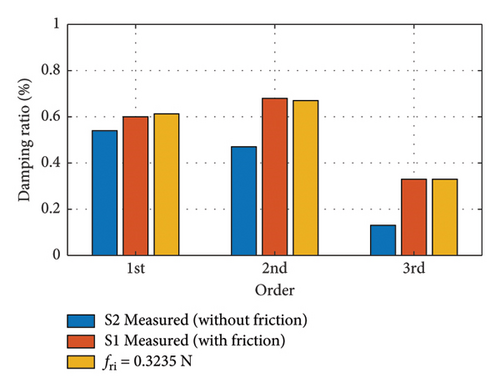
Theoretically, the friction obtained in this section should be consistent with that of Section 4.1.1. Consider the following two points: (1) the difference in the order of magnitude of the bearing displacements. The support displacements due to vertical bending modes are much smaller than those of longitudinal drift modes; (2) the complex mechanisms that may exist for friction. These factors may lead to changes in friction. Overall, the friction obtained is still in the same order of magnitude, and the results are acceptable.
4.2. Strain Energy Analysis of Substructures and Structural Systems
4.2.1. Substructure Damping Dissipation and Strain Energy
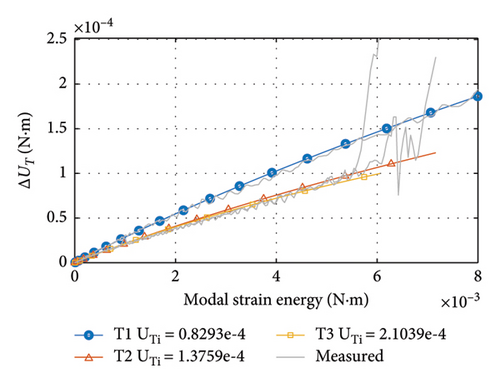
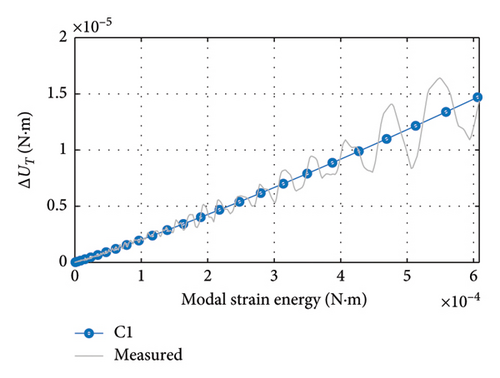
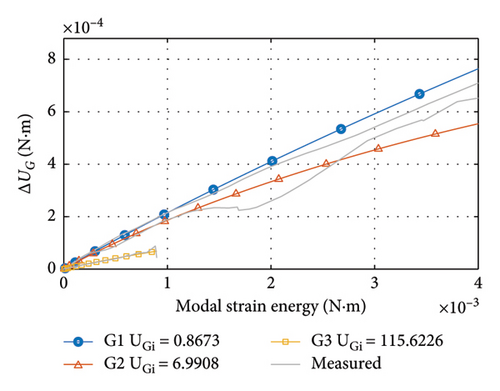
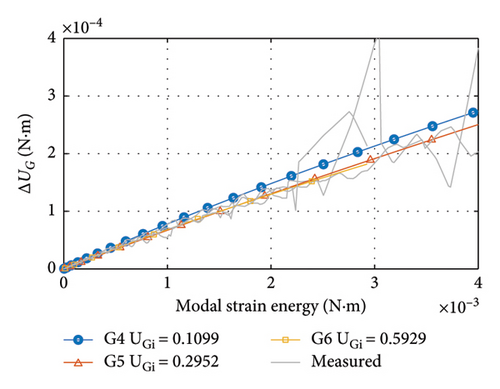
Based on the experimental results in Section 3.3, the damping ratios are converted to damping dissipation energy, the modal displacements are converted to strain energy, and then, the damping dissipation functions are fitted. The damping dissipation function is chosen to be of the form in equation (13), which considers the variation in the damping ratio with amplitude. In addition, the initial strain energy for each condition is evaluated by finite element calculations.
The results of fitting the damping dissipation function are shown in Figure 21. Since the damping dissipation is nonproportional, the fits are obtained as curves. The greater the slope of the curve, the more damping energy is dissipated and the greater the damping ratio. These results will be further used to evaluate the damping dissipation at different initial strain energy and modal strain energy.
4.2.2. Initial and Modal Strain Energy of Structural Systems
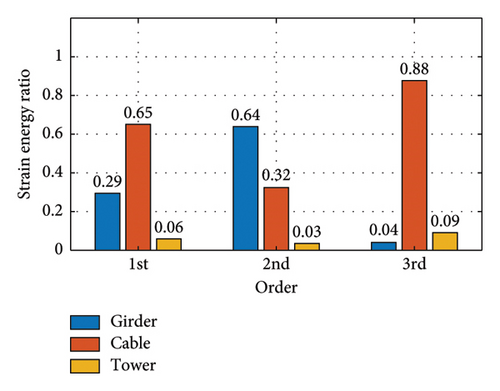
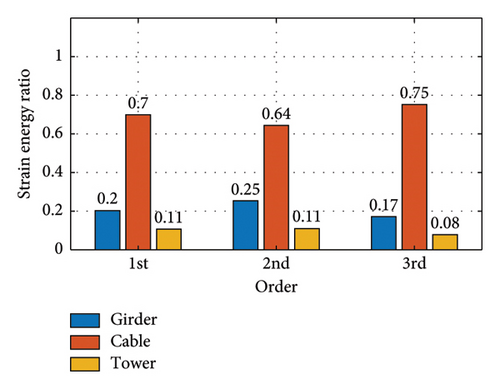
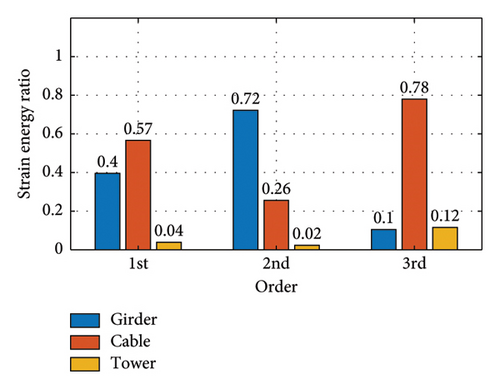
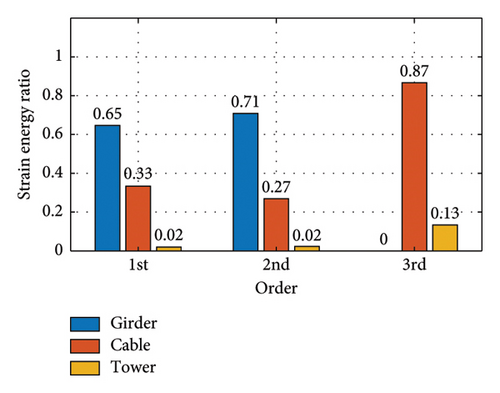
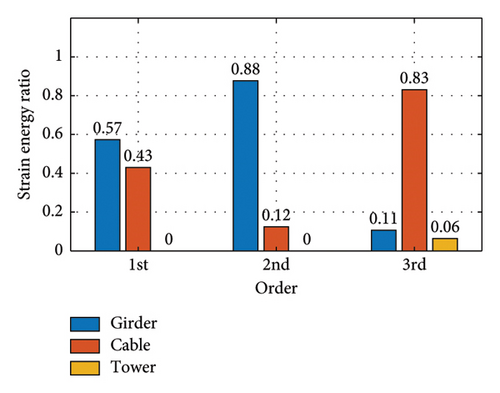
In this section, the initial strain energy Ui and modal potential energy (Un + Ue) of Cases S2∼S7 in the structural system test are evaluated by means of finite element calculations. Table 5 lists the initial strain energy and modal potential energy of the structure. The initial strain energy of each substructure is listed separately because evaluating the damping dissipation of each substructure requires substituting the initial strain energy and the modal strain energy into the corresponding modal dissipation function.
| Case | Initial strain energy Ui | Modal potential energy Un + Ue | ||||||
|---|---|---|---|---|---|---|---|---|
| Girder | Tower 1 | Tower 2 | Cable | Total | 1st | 2nd | 3rd | |
| S2 | 0.9177 | 0.0777 | 0.0777 | 1.2746 | 2.3477 | 0.00604 | 0.00164 | 0.02112 |
| S3 | 0.2818 | 0.0272 | 0.0272 | 0.4225 | 0.7586 | 0.00378 | 0.00012 | 0.02773 |
| S4 | 0.0291 | 0.0019 | 0.0019 | 0.0301 | 0.0631 | 0.00134 | 0.00010 | 0.00012 |
| S5 | 0.4261 | 0.0274 | 0.0256 | 0.4173 | 0.8964 | 0.00312 | 0.00001 | 0.00962 |
| S6 | 1.0315 | 0.0530 | 0 | 0.4229 | 1.0573 | 0.01754 | 0.00046 | — |
| S7 | 1.2675 | 0.0278 | 0 | 0.6174 | 1.9127 | 0.01676 | 0.00107 | 0.01277 |
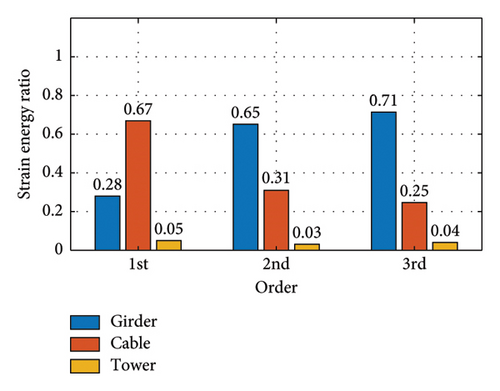
Figure 22 shows the modal strain energy ratios for each operating condition. With this figure and Table 5, it is possible to calculate the modal strain energy of the substructure for each operating condition.
4.3. Comparison of Damping Models
In this section, the structural damping ratio is analyzed using the proposed damping dissipation function method. The damping ratios for conditions S2∼S7 are evaluated using the complex modal method (hysteresis damping), the strain energy proportion method, the viscous damping method, and the proposed damping dissipation function method, respectively.
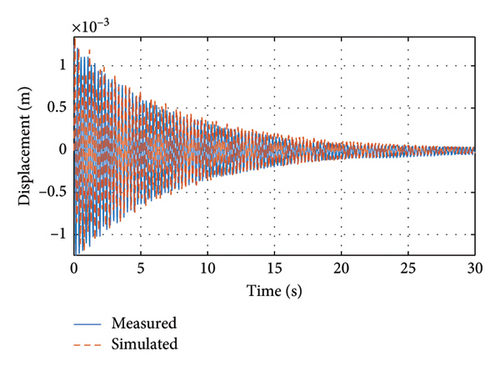
Rayleigh viscous damping is discussed first. Directly using the Rayleigh damping model to construct the damping matrix based on the measured results, the dynamic response of the finite element model is then calculated, as shown in Figure 23. The simulation results are in general agreement with the measured results. However, Rayleigh damping does not reveal the relationship between the members and the overall damping of the structure.
The effectiveness of the above four methods for evaluating overall damping with known member damping is further discussed, and the results are shown in Figure 24. It should be noted that in the calculations of the other three methods, the corresponding damping ratios are selected based on the modes of the main beams, respectively. This is because it can be found in Section 3.3.3 that the damping ratios of the main beams have great variability at different modes. The damping ratios of the main girder are chosen to be 1.73%, 0.56%, and 0.28%, respectively, while the damping ratios of the bridge tower and tie ropes are chosen as 0.16% and 0.18%, respectively. In contrast, the substructure damping changes are not considered in general complex modal method and the strain energy proportional damping method.
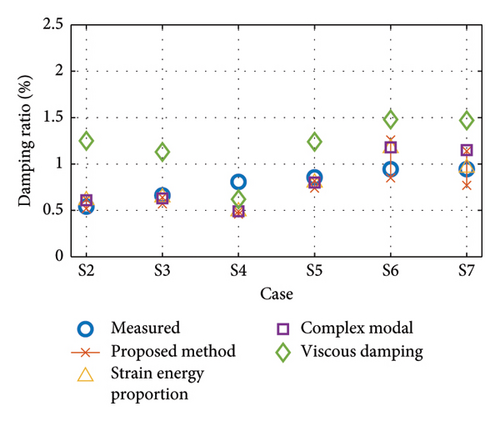
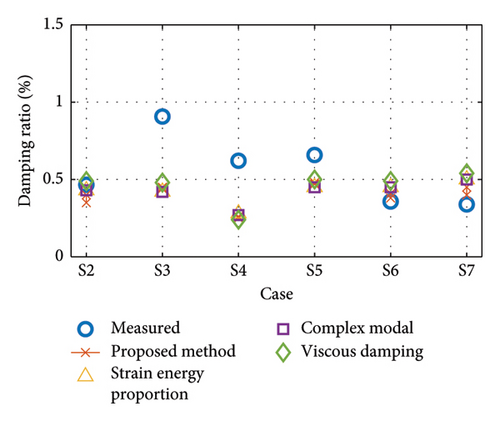
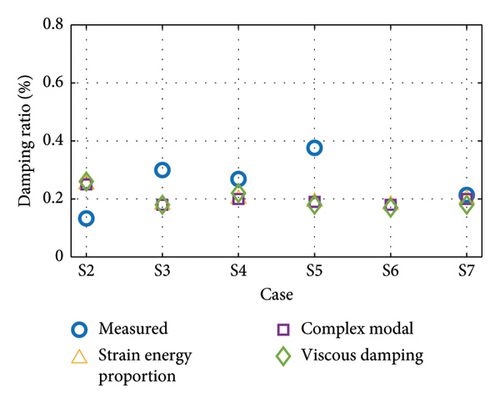
The proposed method considers the variation in the damping ratio with the vibration amplitude, and hence, a range of damping ratios is obtained. From Figure 24(a), it can be seen that the results of the proposed method are in general agreement with the measured values. The evaluation results of the 2nd-order damping ratios are generally small compared to the results of the measured data. In the 3rd-order damping ratio evaluation, the damping dissipation function degenerates into a proportion of strain energy, since the dependence of the amplitude and initial stress level of the girder is neglected. The results of the evaluation of the damping ratio are in general agreement with the measured values.
It can be seen that the results of the complex modal method are almost identical to those of the strain energy proportion method. As mentioned in Section 2.2, the hysteretic damping dissipation is also proportional to the strain energy. Although the complex modal method obtains damping by solving for eigenvalues and the strain energy proportional method evaluates damping according to the modal strain energy, the two methods are consistent in their results. The viscous damping method, on the other hand, overestimates the first-order damping ratio, while the second- and third-order results are close to those of the other methods.
The experimental results illustrate the need to consider the initial stress levels and modes of the substructure. The damping ratio of the structural system also changes with the stress level. In addition, using the same substructure damping ratio for all orders of modes may lead to unreliable evaluation results.
Although the method proposed in this paper achieves satisfactory results in some cases, there are still some cases where it is difficult to accurately assess the damping ratio. The reasons for this are manifold: the assumption of correlating the damped dissipation energy with the strain energy; the assumption of modal decoupling; the accuracy of the substructure damped dissipation energy assessment; and the adequacy of considering the sources of the damped dissipation energy. Adequate consideration of the above factors remains challenging. The purpose of this paper is to provide new insights into the assessment of damping ratios through experiments and to evaluate commonly used damping assessment methods.
5. Conclusions
- 1.
The damping ratio of the substructure varies with both the stress level and model shape. Furthermore, it changes with amplitude during vibration. Simply assume that the damping ratio of a substructure is constant at different stress levels and modal orders may lead to errors in the assessment of the structural system’s damping ratio.
- 2.
The damping ratio of the structural system is also influenced by the initial stress level. Changes in the counterweight on the bridge lead to variations in the damping ratio. Energy-based assessment methods are more accurate than the complex modal approach. The proposed method for assessing the damping ratio of a structural system, based on the damping dissipation function, yields generally satisfactory results.
- 3.
Support friction not only affects the longitudinal drift modes of cable-stayed bridges but also impacts the vertical bending modes. The proposed method for calculating the bearing displacement can be well applied to the evaluation of the bearing friction damping ratio. During vibration in the vertical bending mode, modal and geometric deformation displacements of the bearings occur. The energy dissipation resulting from friction-induced work leads to a change in the damping ratio. The damping ratios due to support friction for the model bridge are in the range of about 0.06%–0.21%.
This paper experimentally illustrates the necessity of considering substructure stress levels and modes in the evaluation of damping ratios and proposes a methodology for evaluating frictional damping of supports. The results of the study offer new insights into damping ratio assessment. However, as discussed in Section 4.3, challenges remain in bridge damping ratio assessment, and further research is needed to elucidate the damping mechanism.
Conflicts of Interest
The authors declare no conflicts of interest.
Funding
This study is supported by the National Natural Science Foundation of China (52278313, 52411540031), Shanghai Qi Zhi Institute Innovation Program (SQZ202310), and Research & Development Program of China Railway Shanghai Group Corporation Limited (2022152, 2022158).
Acknowledgments
This study is supported by the National Natural Science Foundation of China (52278313, 52411540031), Shanghai Qi Zhi Institute Innovation Program (SQZ202310), and Research & Development Program of China Railway Shanghai Group Corporation Limited (2022152, 2022158).
In this study, the authors used ChatGPT to assist in refining and improving the language of the manuscript. ChatGPT was solely used for enhancing the clarity and fluency of the text and was not involved in the design of the research, data analysis, or drawing of conclusions. All research content and analyses were independently conducted by the authors. After using this tool, the authors reviewed and edited the content as needed and take full responsibility for the content of the publication.
Open Research
Data Availability Statement
The data that support the findings of this study are available from the corresponding author upon reasonable request.


