A Bridge Crack Detection and Localization Approach for Unmanned Aerial Systems Using Adapted YOLOX and UWB Sensors
Abstract
The management and maintenance of the aging bridges can benefit from an efficient and automatous bridge inspection process, such as crack detection and localization. This paper presents a robust and efficient approach for unmanned aerial vehicle (UAV)-based crack recognition and localization. An adapted YOLOX model is used in the proposed approach to improve accuracy and efficiency of crack recognition, and hence to enable real-time crack recognition from the captured UAV images at the edge-computing devices. In this way, non-crack images can be recognized in real-time during data acquisition and be filtered out to relieve the burden of subsequent data recording. In addition, a self-organizing positioning system based on ultra-wide-band (UWB) sensors is employed in the proposed system to enable real-time UAV positioning and crack localization in GNSS-denied areas such as spaces underneath the bridge deck. Experiment studies were carried out to investigate the impact of the quantities of employed UWB base stations on the UAV positioning accuracy. Finally, the proposed approach is tested on a self-developed UAV system and the effectiveness is validated through laboratory tests and real-world field tests.
1. Introduction
Bridges are vital for economic development, linking diverse geographical regions [1]. In countries like the United States and China, many bridges have been in service for over a decade, with some exceeding 50 years [2]. Throughout their service life, bridges are subject to various forms of deterioration and damage due to extreme environmental conditions and overloading. Without timely repairs, these issues can compromise the functionality of essential bridge components and even the integrity of the entire structure. Consequently, transportation authorities typically mandate periodic assessments of bridge conditions [3]. To support these assessments, numerous studies have explored the use of visual sensing technologies to evaluate visible damages on bridge [4] and to construct 3D models for accurate damage localization and visualization [5].
Concrete cracks are among the most common deteriorations in bridges, and the presence of cracks in critical components can signal compromised durability. This may reduce the load-carrying capacity of the bridge components and potentially lead to catastrophic failure of the entire structure. Consequently, crack assessment is a critical aspect of routine bridge inspections [6]. However, the traditional manual inspection approach for concrete crack assessment is labor-intensive, time-consuming, and heavily dependent on human judgment, which can vary with the inspector’s experience. Therefore, there is a pressing need to develop an advanced concrete crack inspection technique that can either assist or fully automate the crack detection and quantification process.
Recognizing the significance of automated crack inspection for bridge maintenance, researchers from both industry and academia have explored numerous image processing-based methods aimed at automating the bridge inspection process. To assure the inspection accuracy, advanced image processing techniques that are capable of extracting salient image features for damage recognition are typically necessary. Recent developments in deep learning (DL) techniques have provided effective tools for damage recognition, leveraging deeper layers that autonomously learn significant features from training datasets [7, 8]. The flexibility in DL model design enables robust feature representation and enhanced object recognition capabilities. Consequently, DL approaches, particularly those based on convolutional neural networks (CNN), have been employed to identify various types of structural surface damage, including concrete cracks [9, 10], road impairments [11], loosened bolts [12], etc. Studies have demonstrated the effectiveness of CNN-based techniques in classifying various types of surface damage within complex environments [13]. Furthermore, researchers have utilized DL methodologies to pinpoint specific areas of concern within images [14]. Initial applications of region-based convolutional neural networks (R-CNN) for object detection have evolved into more sophisticated DL-based object detection methods, such as Faster R-CNN [15], Feature Pyramid Networks (FPN) [16], Single-Shot Multi-box Detector (SSD) [17], and You Only Look Once (YOLO) [18]. Inspired by these advancements, DL-based object detection has been applied across various structures, detecting damage on concrete structures [19], sewer pipes [20], tunnels [21], roads [22], embankments [23], dams [24]. Moreover, numerous studies have explored the integration of deep learning with unmanned aerial vehicles (UAVs) for structural damage detection [25, 26].
While identifying damage pixels or areas in images is crucial, these cannot be directly used to assess bridge conditions or optimize maintenance strategies. Damage localization, the process of pinpointing the exact three-dimensional locations of damage in bridges, is a necessary subsequent step. Currently, there are two primary approaches for damage localization. The first leverages unmanned aerial system (UAS) positioning data or employs three-dimensional reconstruction of the structural surface [27]. For instance, Global Navigation Satellite System (GNSS) data from UAS have been utilized for localizing damage on concrete bridges [28], and a method based on three-dimensional reconstruction allows for displaying damage on point cloud models [29]. The second approach involves stitching collected images to create a panoramic view of the structure’s surface. This can be achieved by manually stitching perpendicular images taken at fixed intervals by a wall-climbing UAS, resulting in a comprehensive view of the detection area [30]. However, challenges arise when concrete surfaces lack distinct features for effective image stitching, and GNSS data may be unavailable in certain areas, such as under bridges. Thus, a reliable positioning system is essential for effective UAS-based bridge inspections [31]. Alternative methods in GNSS-denied environments include the use of vision-guided UAS, where a vision-inertial fusion algorithm aids in damage detection and localization [32]. Another external positioning method utilizes ultrasonic beacons as a substitute for GNSS, synchronizing inspection videos and mobile beacon logs for accurate damage localization [33]. Nevertheless, these methods often rely on post-processing recorded videos, which is often computational expensive due to the large file sizes typical in bridge inspections and can introduce errors in localization due to potential misalignment in time synchronization between position logs and video data.
Recent studies on UAV-based crack inspection primarily use UAVs as image acquisition tools, relying on offline post-processing for crack detection. Since crack locations are unknown in advance, these approaches often require capturing redundant image data, which significantly reduces the efficiency of crack inspection. To address this issue, this paper proposes a novel UAV system equipped with an onboard computer for real-time crack recognition. In this way, only images containing concrete cracks are recorded for the subsequent crack segmentation and quantification in order to prevent data overload. An enhanced YOLOX-based crack detection model is implemented within the Robot Operating System (ROS), enabling simultaneous image acquisition and processing while operating within the UAV’s limited computing resources. Furthermore, while existing studies focus primarily on crack recognition and quantification from UAV images, they often overlook the importance of accurate crack localization that is essential for crack assessment, particularly in GNSS-denied environments such as areas beneath bridge deck. To overcome this limitation, the proposed UAS platform also adopts an ultra-wide band (UWB)-based positioning system, which also operates within the ROS to provide precise UAV positioning synchronized with the captured images. Combined with the crack detection results and camera projection model, the 3D spatial locations of the detected cracks can be estimated with acceptable accuracy. Experimental studies are carried out to validate the effectiveness of the proposed method for both real-time crack detection and crack localization.
This paper is structured as follows: Section 2 presents the framework of the proposed crack detection and localization system, including the UAS platform, the UWB-based positioning system, and the adapted YOLOX-based crack detection method. The accuracy of the UWB-based positioning system with different numbers of base stations is evaluated using experimental studies presented in Section 3. The effectiveness of the proposed YOLOX-based crack detection model is validated in Section 4 against other deep learning-based models, including RetinaNet, Single-Shot Multi-box Detector (SSD), and YOLOv3. Section 5 presents laboratory and in-situ field tests conducted to validate the effectiveness of proposed system in real-world crack detection and localization. Finally, conclusions and future work are summarized in Section 6.
2. Methodology
This section introduces a novel approach for the automated detection and localization of concrete cracks in GNSS-denied areas for bridges, utilizing RGB images and UWB positioning data collected by a UAS platform. The system, depicted in Figure 1, is composed of a multi-rotor UAV equipped with two wheels, a vision camera, a UWB-based positioning system, a 4G transmitter, and an onboard computer. The onboard computer is connected via the 4G transmitter to a laptop that is used for data collection and visualization. The UWB positioning system includes several base stations placed within the inspection area and a tag mounted on the UAV. Throughout the inspection, this tag communicates with the base stations to provide precise UAV positioning data.
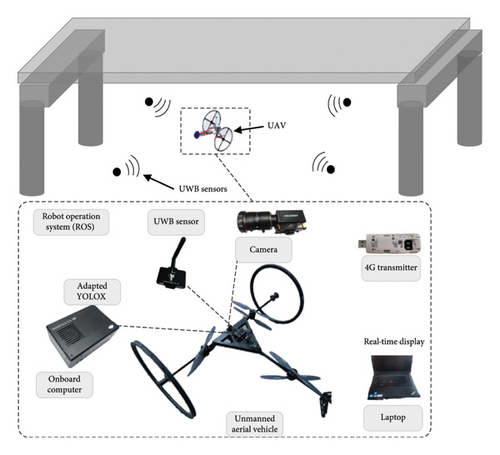
Data from the various sensors are synchronized and merged to the onboard computer that runs the Robot Operating System (ROS), where the onboard computer communicates with the sensors via “nodes” and the various types of sensor data are transmitted via “messages” and “topics”. Data synchronization is completed using the timestamps in ROS. In addition, the onboard computer deploys a pretrained adapted YOLOX model, which is pruned to operate effectively with the limited computing resources from the onboard computer, to enable real-time crack detection. In this way, crack images can be identified by the onboard computer in real-time during the data acquisition and are transmitted to the laptop for subsequent crack segmentation, localization, and visualization.
2.1. Real-Time UAV Localization With UWB Sensors
To use the UWB-based positioning system for UAV localization, multiple base stations are set in the inspection area prior to UAV data collection. At least three base stations are required, and the base stations remain stationary throughout the data collection process. Based on the positions of the base stations, a fixed coordinate system can be established to define the spatial coordinates of the UAV. To determine the coordinates of the UAV, a UWB tag is mounted on the UAV and the UWB tag keeps communicating with the base stations using pulse radio signals throughout the data acquisition process. The distance between the UWB tag and a base station can be calculated by measuring the round-trip travel time of the radio signal. Using trilateration methods based on the measured distances between the UWB tag to three or more base stations, the coordinates of the UWB with respect to the UWB base stations can be estimated as shown in Figure 2.

2.2. Crack Detection With Adapted YOLOX Model
Collected images are processed by an adapted YOLOX model running on the onboard computer for real-time crack recognition. The traditional YOLO series employ an anchor-based pipeline that requires manual clustering analysis to determine optimal anchors. This increases the model complexity and consequently hinders the real-time implementation of traditional YOLO series on edge computing devices. Comparing to the tradition YOLO series, YOLOX model adopts an anchor-free design, simplifying predictions by allowing each location to directly predict the bounding box. This design of YOLOX model lowers the computational costs while maintaining reasonable detection accuracy, which makes YOLOX preferable in real-time object detection tasks in edge computing devices such as the onboard computer in UAV.
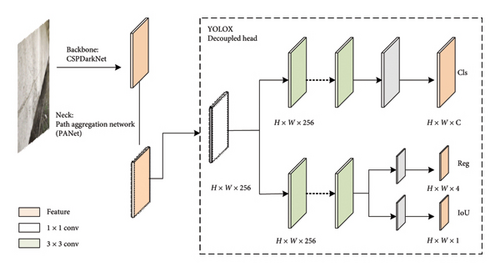
The performance of YOLOX model has been validated against original YOLO series models on the large public dataset called Common Objects in Context (COCO) benchmark dataset [34]. The architecture of the adopted YOLOX model is shown in Figure 3, in which a decoupled head is incorporated to resolve the conflict between the classification tasks and regression tasks in original coupled head in YOLO models. The adopted YOLOX model uses a DarkNet backbone [18] that is integrated with a Cross Stage Partial Network (CSPNet) [35] to enhance the learning capabilities as well as to reduce memory costs in the feature extraction process. The neck of the YOLOX model uses a Path Aggregation Network (PANet) [36].

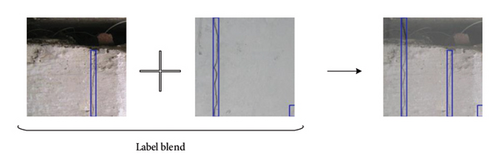
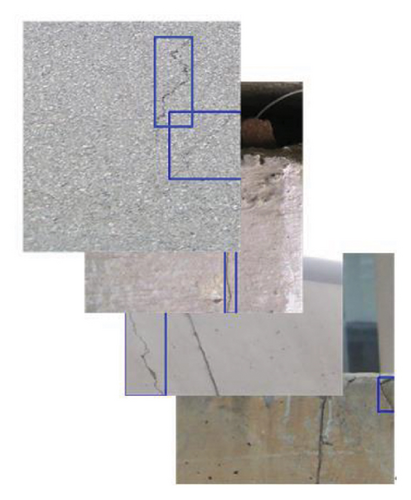
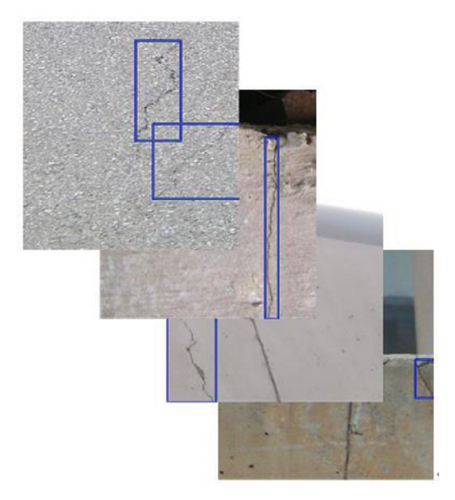
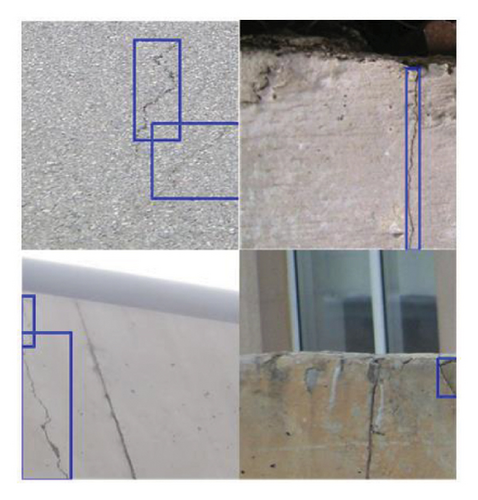
The Mosaic data augmentation method is proven to be effective in increasing dataset diversity and hence increasing the detection accuracy in small object detection tasks with complex background [38]. In this study, the Mosaic method is applied to randomly combine four images into a single image that includes target objects from each constituent image as shown in Figure 5. Each resultant image is then randomly cropped and scaled to match the size of the original image. In this process, the coordinates of the target bounding boxes are adjusted according to the scaling of the image. The purpose of this random cropping and scaling is to diversify the samples.
In the original YOLOX model [34], the Mosaic and MixUp strategies were implemented but discontinued for the last 15 epochs due to the potential negative impact on detection accuracy. Nevertheless, the conclusion was reached according to the experimental results based on COCO datasets and thus may not completely apply to crack detection scenarios. Therefore, this study further investigates how these robust data augmentation strategies affect the crack detection performance of the YOLOX model. Detailed information is presented in Section 4.3.
2.3. Crack Localization by Integrating UWB Positioning Data
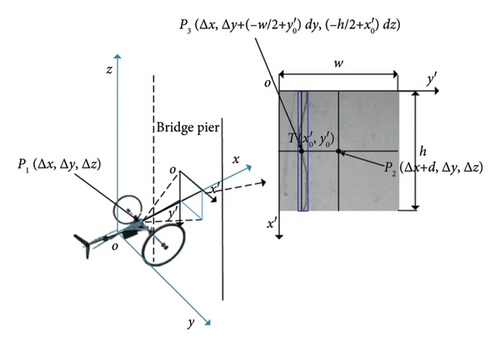
For bridge condition assessment, it is important to determine the accurate spatial locations of the detected concrete cracks. In this study, these crack locations are determined based on the UWB positioning data. Firstly, a global 3D coordinate system is established based on the initial local UAV frame before taking off, for which the x-axis is aligned parallel to the longitudinal direction of the girder and the z-axis is pointing upwards. In this way, the XOY plane coincides with the facade of the bridge beam. The coordinates of the UAS in this 3D coordinate system is calculated in real-time by the onboard computer and is synchronized with the collected images. In this way, once a crack is detected and the corresponding bounding box is identified in an image, the image coordinates of the center point is computed and are then transformed to the 3D coordinate system using the pre-calibrated camera model and the 3D coordinates of the UAV. The approach is illustrated in Figure 6 and is presented with details as follows.
3. Experimental Validation for UWB-Based Localization System
3.1. Description of the Testing Experiment
In this proposed method, the crack localization accuracy is highly dependent on the positioning accuracy of UWB sensors, which can be affected by various factors such as the signal obstacles, measuring distances, and environmental conditions. Increasing the number of UWB base stations can theoretically increase the positioning accuracy and robustness. In this study, experiments are conducted to quantitively evaluate the impact of the number of base stations on the positioning accuracy of a UWB self-organizing network, specifically designed for under-bridge inspection applications.
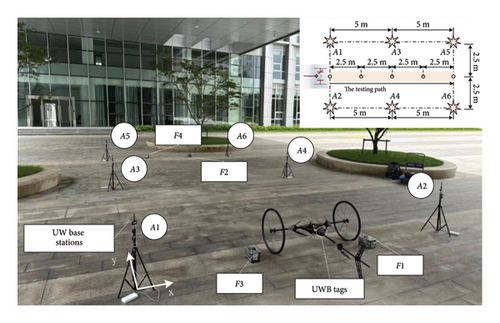
The experiments are conducted underneath the corridor of a building structure to simulate an under-bridge environment. The deployment and testing scheme of the UWB network are illustrated in Figure 7. A total of six base stations are deployed initially. The experiment investigates the system’s positioning accuracy by selectively de-activating a few base stations. Specifically, the configurations tested include active participation of 3 (A1 ~ A3), 4 (A1 ~ A4), 5 (A1 ~ A5), and 6 (A1 ~ A6) base stations in the positioning process. The base station A1 is designated as the origin of the UWB coordinate system. The positive X-axis points from A1 to A2 and the positive Y-axis points from A1 to A3, while the Z-axis direction is established perpendicularly according to the right-hand screw rule. The coordinates for the base stations A1 through A6 are set at (0, 0), (5, 0), (0, 5), (5, 5), (0, 10), and (5, 10) respectively, measured in meters. During the experiments, the movement of UAV system is controlled to move straightly along a predefined path, as shown in Figure 7. The movement along the lateral direction is constrained by two parallel ropes that are fixed on the four points F1, F2, F3, and F4.
3.2. Experimental Results and Discussions
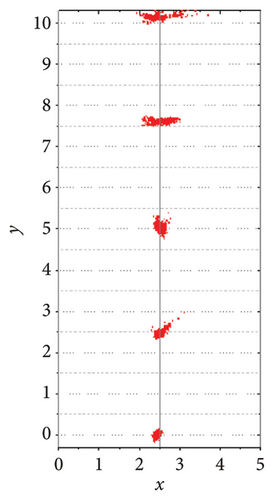
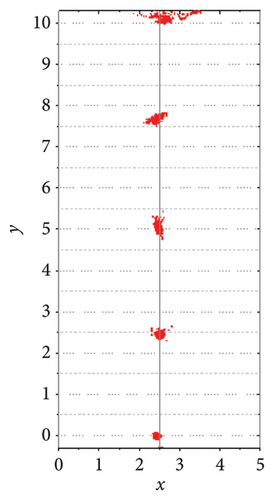
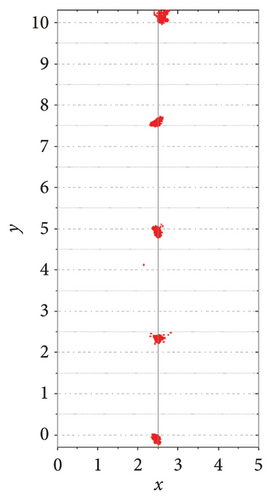
The positioning results based on 3, 4, 5, and 6 active base stations are illustrated in Figure 8(a) through Figure 8(d), respectively. In each figure, the UAV’s estimated trajectory based on UWB data is marked with red points, while the actual UAV trajectory is depicted with grey lines. As shown in Figure 8(a), when only three base stations A1 ~ A3 are used for positioning, the resulting accuracy shows significant dispersion towards the end of the trajectory. This discrepancy decreases remarkably as the number of base stations goes from three to five, while the discrepancy from six base stations is similar to that from five base stations.
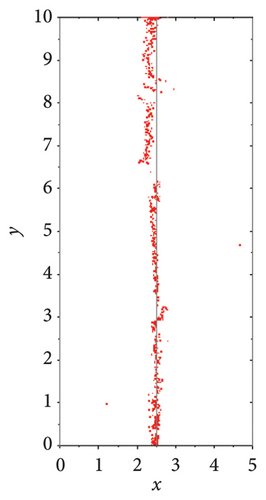
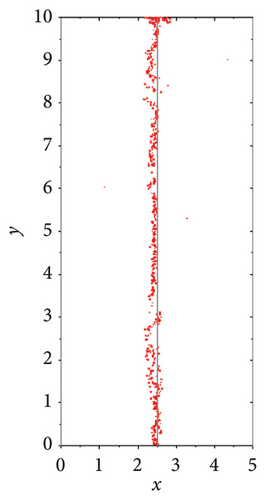
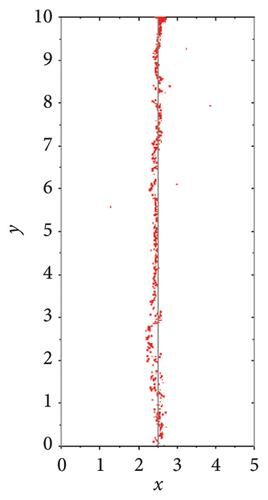
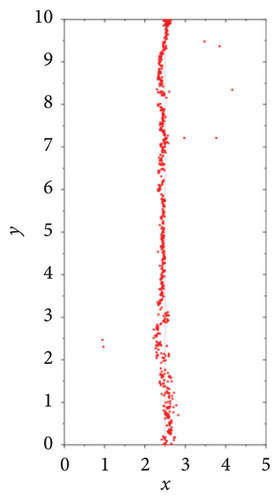
Figure 9 illustrates the positioning results of various measurement points within a corridor under different base station configurations. As indicated by results in Figure 9(a), 9(b), 9(c), and 9(d), the positioning increases as the distance from the base stations increases, attributed to the weakening of the UWB signal over greater distances. This attenuation makes it challenging to determine distances accurately, leading to increased positional errors. The discrepancy can be mitigated by increasing the number of base stations. With more base stations available, the UWB signal is measured more accurately, which enhances overall positioning accuracy. Notably, the results displayed in Figure 9(d) demonstrate robust positioning even at distances up to 10 m from the base stations. For example, when using six anchors, the standard deviation for the measurement point (2.5, 10) is 0.08 m in the X direction and 0.15 m in the Y direction. In contrast, with only three base stations, the standard deviations at the same point increase to 0.54 m in the X direction and 0.36 m in the Y direction. These results highlight that a greater number of base stations significantly enhances the robustness of the positioning outcomes.

4. Experimental Validation for YOLOX-Based Crack Detection Model
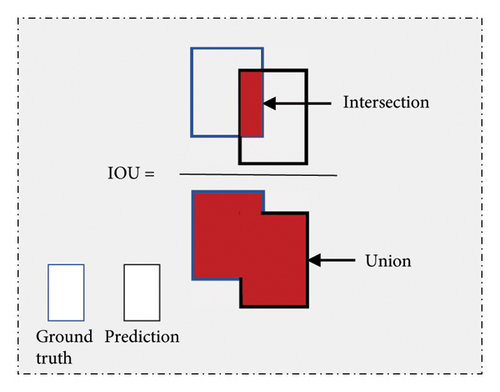
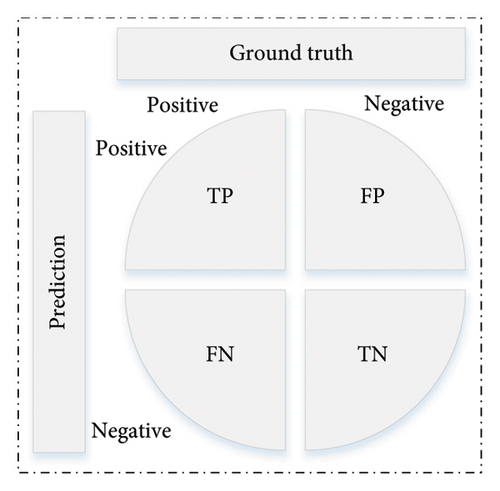
In this section, concrete crack images collected from routine inspection reports are manually annotated with precise location information to prepare the dataset. Four different network architectures—YOLOX, RetinaNet, Single-Shot Multi-box Detector (SSD), and YOLOv3—are evaluated to demonstrate the effectiveness of the proposed YOLOX-based crack detection method. To assess whether the predicted bounding boxes accurately identify the target cracks, an Intersection over Union (IoU) criterion with a set threshold is employed. A higher IoU value indicates a closer match between the predicted bounding boxes and the actual ground truth, as illustrated in Figure 10(a).
4.1. Dataset Description
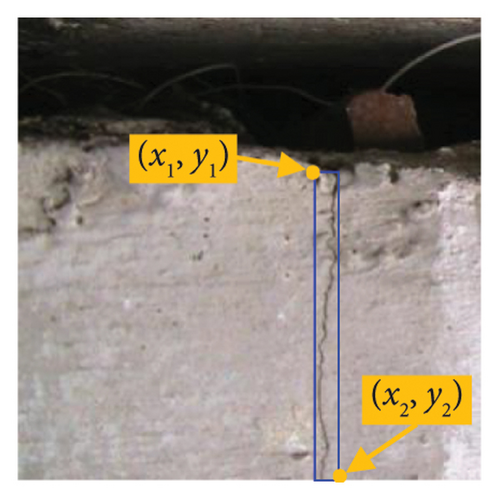
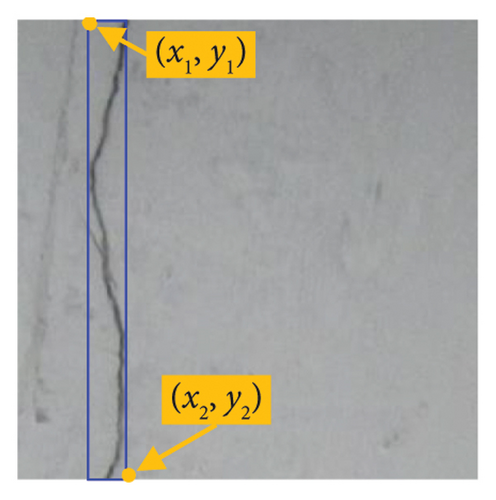
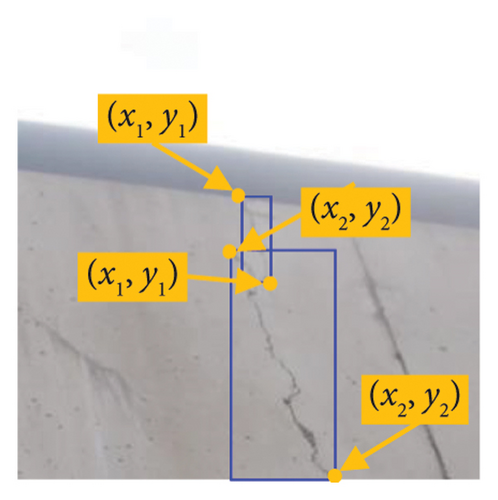
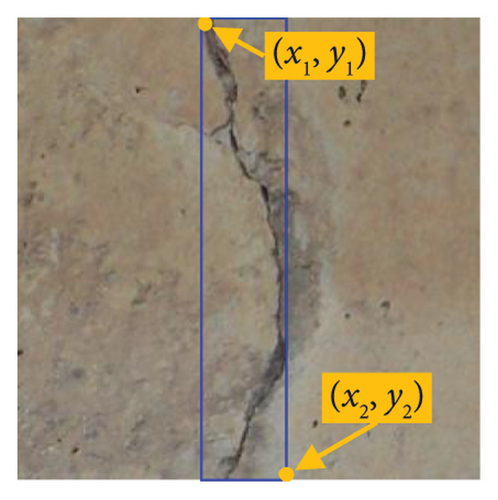
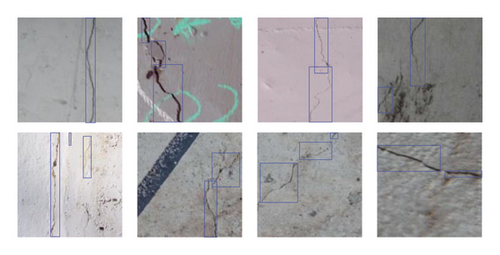
The background for concrete crack images collected in-situ are often complex due to variations in illumination and the texture of degraded concrete surfaces. The dataset utilized in this study is derived from field bridge inspection reports, containing 562 concrete crack images totally. These crack images were manually annotated using the tool Labelme [39] and the annotation is aimed at creating a bounding box for each crack by manually selecting the upper left corner and bottom right conner of the box. These crack images were then segmented into 9728 image patches, each with a size of 544 × 544 pixels as shown by the examples in Figure 11. In the training process, 80% image patches (7782 patches) were used for training and 20% image patches (1946 patches) were used for validation. Detailed information regarding the collection, selection and composition of this training dataset can be found in the author’s dissertation [40].
4.2. Implementation Details
Instead of training the crack detection model from scratch, transfer learning is utilized in this study to facilitate the training process, through leveraging the pre-trained model and weights from other object detection tasks based on the COCO dataset [41]. The hyper-parameter, learning rate, is used to determine the step size in optimizing the objective functions. Existing literature indicates that gradually decreasing the learning rate during training process, which is often referred to as learning rate annealing, can improve convergence rate and training accuracy [42, 43]. Therefore, a warmup strategy is employed in this study for the first five epochs, where a lower learning rate is initially used and then incrementally increased to a predetermined value. Following the warmup period, cosine annealing is applied to gradually decrease the learning rate. In addition, robust data augmentation techniques including Mosaic and MixUp strategies are applied in the first 60 epochs to reduce overfitting and to enhance model generalization. The model training is carried out using the MMdetection deep learning framework with a PyTorch backend and an NVIDIA TITAN RTX GPU with 24 GB memory.
4.3. Experimental Results for Different Training Strategies
- •
Case 1: Data augmentation was applied throughout all 120 epochs;
- •
Case 2: Data augmentation was employed only during the first 60 epochs, with no augmentation applied for the remaining 60 epochs;
- •
Case 3: No data augmentation was used at any point during the training process.
These experiments are specifically aimed at determining how these augmentation strategies influence the effectiveness of the YOLOX model in detecting cracks, providing insights into the optimal use of such techniques for enhancing model accuracy.
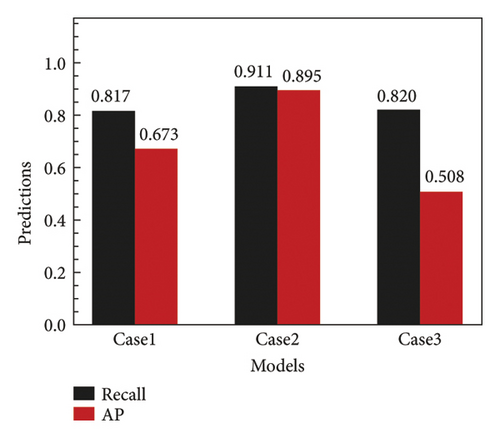
The resultant training accuracy of three experiments is compared in Table 1. The comparison results with an IoU threshold equal to 0.5 are presented in Figure 12. As indicated by the precision-recall curves shown in Figure 12(a), Case 2 training strategy consistently outperforms Case 1 and Case 3. Additionally, the precision-recall curve for Case 1 is better than that of Case 3, suggesting better performance when data augmentation is applied throughout the training process compared to the case without any data augmentation. Figure 12(b) compares the model’s prediction results across the different cases, highlighting that the model trained under Case 2 not only achieves the highest average precision of 0.911 but also the highest recall rate of 0.895. This outcome demonstrates that Case 2, where data augmentation is utilized during the initial 60 epochs and then omitted in the subsequent 60 epochs, is the most effective training strategy. These results suggest that applying strong data augmentation early in the training process can significantly enhance the model’s generalization performance. It appears that initiating training with robust augmentation helps the model learn a more diverse set of features, which are then refined in the later stages of training without augmentation, leading to improved overall accuracy.
| Different training strategy | IoU = 0.2 | IoU = 0.3 | IoU = 0.4 | IoU = 0.5 | ||||
|---|---|---|---|---|---|---|---|---|
| Average precision | Recall | Average precision | Recall | Average precision | Recall | Average precision | Recall | |
| Case 1 | 0.796 | 0.892 | 0.874 | 0.761 | 0.724 | 0.849 | 0.673 | 0.817 |
| Case 2 | 0.932 | 0.942 | 0.921 | 0.934 | 0.910 | 0.925 | 0.895 | 0.911 |
| Case 3 | 0.682 | 0.901 | 0.628 | 0.883 | 0.574 | 0.857 | 0.508 | 0.820 |

4.4. Experimental Results for Different Model Architectures
In this section, the effectiveness of the YOLOX-based crack detection model is validated against various state-of-the-art deep learning models that are widely-used for object detection applications, including RetinaNet, Single-Shot Multi-box Detector, and YOLOv3. The comparison results are indicated in Figure 13. As indicated by the areas enclosed by the precision-recall curve in Figure 13(a), it is evident that MYOLOX has the best performance among the 4 models in crack detection application. The performance of MRetinaNet and MYOLOv3 are close to each other and are both notably better than that of MSSD. The precision-recall curves show that both MRetinaNet and MYOLOv3 are able to maintain a high precision (> 0.95) while achieving an acceptable recall (< 0.6). Nevertheless, when keep lowering the threshold to achieve a recall higher than 0.6, the precision starts to drop dramatically. The YOLOX models outperforms the MRetinaNet and MYOLOv3 for that it is able to maintain a precision higher than 0.95 while achieving a 0.85 recall value, which allows the YOLOX model to recognize existing concrete cracks accurately. This is also verified by the Average Precision (AP) and recall values based on an IoU threshold equal to 0.5 as shown in Figure 13(b). With this IoU threshold, all the 4 models have a recall close to 0.9. Meanwhile, the MYOLOX is able to achieve an AP value equal to 0.895, notably higher than the AP values for MRetinaNet, MYOLOv3 and MSSD that are 0.826, 0.820, and 0.562, respectively.
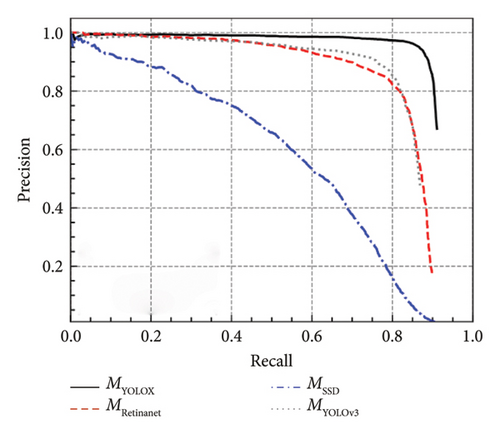
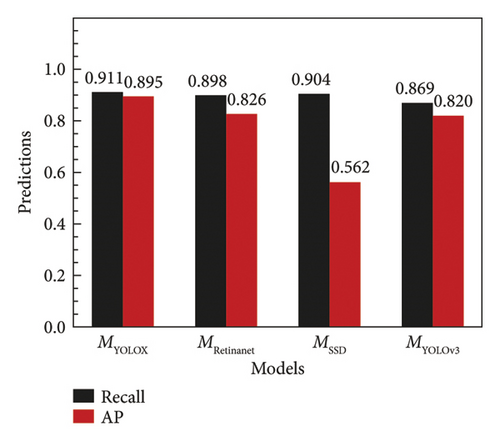
Table 2 provides a summary of the Average Precision (AP) and recall values for the MYOLOX model at different IoU thresholds. As detailed in the table, the AP values for MYOLOX decrease progressively with increasing IoU thresholds, being 0.932 at 0.2, 0.921 at 0.3, 0.910 at 0.4, and 0.895 at 0.5. Similarly, the recall values for MYOLOX also decrease as the IoU threshold increases, recorded at 0.942 for 0.2, 0.934 for 0.3, 0.925 for 0.4, and 0.911 for 0.5.
| Deep learning models | IoU = 0.2 | IoU = 0.3 | IoU = 0.4 | IoU = 0.5 | ||||
|---|---|---|---|---|---|---|---|---|
| Average precision | Recall | Average precision | Recall | Average precision | Recall | Average precision | Recall | |
| MYOLOX | 0.932 | 0.942 | 0.921 | 0.934 | 0.910 | 0.925 | 0.895 | 0.911 |
| MRetinanet | 0.870 | 0.940 | 0.857 | 0.927 | 0.843 | 0.917 | 0.826 | 0.898 |
| MSSD | 0.681 | 0.970 | 0.651 | 0.962 | 0.617 | 0.947 | 0.562 | 0.904 |
| MYOLOv3 | 0.891 | 0.920 | 0.874 | 0.908 | 0.854 | 0.896 | 0.820 | 0.869 |
MRetinanet achieves AP values of 0.870, 0.857, 0.843, and 0.826 for IoU thresholds of 0.2, 0.3, 0.4, and 0.5 respectively. The recall values for MRetinanet are 0.940, 0.927, 0.917, and 0.898 at the same thresholds. MSSD shows lower AP values of 0.681, 0.651, 0.617, and 0.562, with recall values of 0.970, 0.962, 0.947, and 0.904 for IoU thresholds of 0.2, 0.3, 0.4, and 0.5 respectively. MYOLOv3 reports AP values of 0.891, 0.874, 0.854, and 0.820, and recall values of 0.920, 0.908, 0.896, and 0.869 at these thresholds. Comparatively, MYOLOX consistently outperforms the other models across all IoU thresholds, affirming its superior crack detection capabilities. The consistently higher AP and recall values indicate that MYOLOX is more effective in both identifying relevant features and minimizing false positives and negatives. Figure 14 showcases sample prediction results from MYOLOX, further illustrating the practical effectiveness of this method in diverse scenarios.
5. Experimental Validation for the Real-Time Crack Detection and Localization System
5.1. Laboratory Test
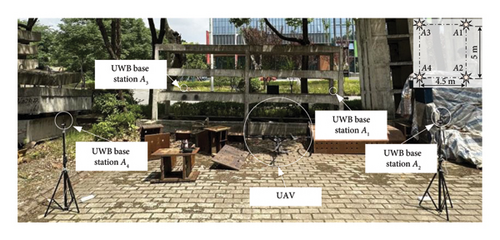
To validate the effectiveness of the UAV-based crack detection and localization system, laboratory tests were conducted using a three-story, two-span prestressed concrete frame, which had previously undergone shake table tests and sustained several severe cracks [44]. Prior to the testing, four UWB base stations were placed as depicted in Figure 15. The base stations were arranged in a rectangular configuration to optimize coverage and precision in localization. The fixed coordinate system used to define the UAV positions was established as follows: coordinate origin was located at A1; the X-axis was defined as the line from A1 to A2 (spanning 5 m); the Y-axis was defined as the line from A1 to A3 (spanning 4.5 m).
The UAV was equipped with a high-resolution camera, originally set to capture images at 5472 × 3648 pixels. For the purpose of these tests, the camera was configured to crop images to the central region, resulting in a resolution of 2736 × 1824 pixels. The frame rate was adjusted to one image every 2 s to balance detail capture and data processing demands.
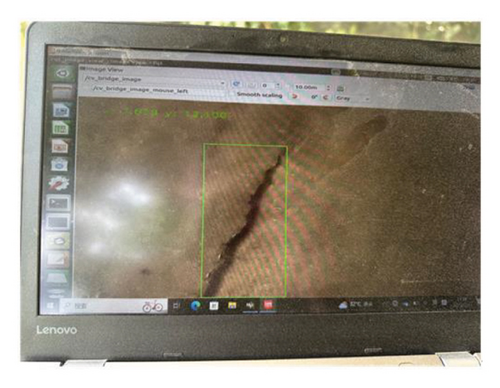
Figure 16 illustrates the operational process of the UAV-based crack detection system. During the experiment, the images captured by the UAS system were processed in real-time by the YOLOX model on the onboard computer for the detection of surface cracks. Crack detection results were transmitted in real-time to a laptop via the 4G network for visualization. The system was designed to automatically recognize and record images with the presence of concrete cracks only, thus relieving the data storage burden on the edge device and enhancing efficiency of the subsequent data processing steps.
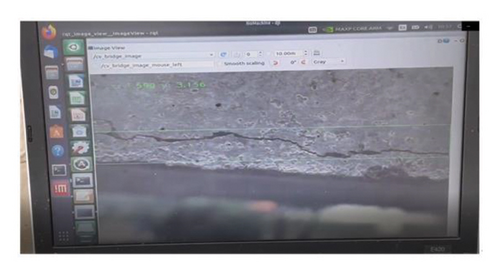
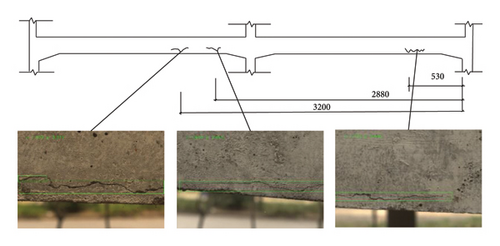
During the detection process, the position of the UWB tag was continuously recorded in the UWB coordinate system, facilitating the localization of detected cracks. Figure 17 demonstrates the capability of the real-time crack detection system as it operates on a concrete structure. As illustrated, the system effectively identifies cracks on the surface. The detected positions of three identified cracks, measured from the right side of the beam, are 0.490 m, 2.963, and 3.212 m. These positions are compared with the actual measured true positions, which are annotated in the figure as 0.530, 2.880, and 3.200 m, respectively. The resulting positional errors are all less than 0.1 m, demonstrating a high degree of accuracy and underscoring the system’s potential for practical engineering applications.
5.2. In-Situ Test on Concrete Bridge Pier
The experimental evaluation of the crack detection and localization system was conducted on a two-span bridge with a concrete pier located in Nanjing, China. The experiment was conducted in the space underneath the bridge deck, aiming to detect concrete cracks at the surface of the concrete pier. Four UWB base stations were used as shown in Figure 18. The base stations were spaced in a square arrangement with 10 m side length. The established coordinate system is originated at A1 and has A1A2 and A1A3 being the X-axis and Y-axis, respectively.
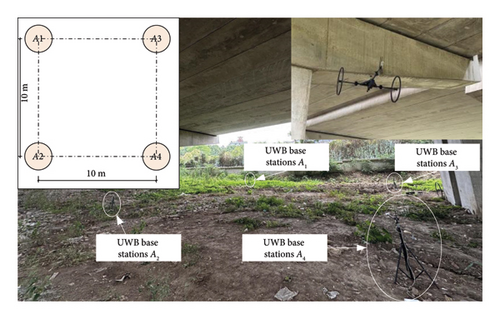
During the data acquisition process, the UAV was manually piloted to approach the concrete pier until the two wheels of the UAV were in contact with the bridge pier. The camera on the UAV then started to acquire images from the concrete pier and the onboard computer simultaneously employed the pretrained YOLOX to process the images for real-time crack detection. Images were acquired and processed at a fixed rate of 0.5 Hz and the UAV was controlled to navigate the entire pier slowly while keeping the wheels in contact with the bridge pier. Positioning data from UWB and IMU were recorded and synchronized by the onboard computer in the meantime for crack localization. Identified crack images and positioning data were transmitted through 4G network to a laptop for visualization and monitoring.
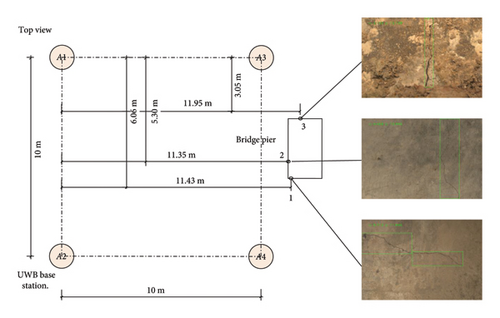
In the experiment, all three cracks on the bridge pier were detected successfully in real-time by the proposed YOLOX model that was ran on the onboard computer. The identified crack images were transmitted to the laptop. The crack locations and examples of the identified crack images were illustrated by Figure 19. The coordinates of the crack centers were also calculated and were compared to the measured coordinates, in order to validate the effectiveness of the proposed crack localization. The results of the comparison are presented in Table 3. As indicated by the results, the errors in estimating the crack locations are typically within ±5%, except for the X coordinate of crack #3 (−10%). For the average absolute error in computing the coordinates is 0.185 m and the average percentage error is 3.24%, which represents a promising level of accuracy for practical engineering applications. The performance of the proposed crack detection and localization method in this experiment demonstrates a great potential in providing reliable and accurate localization of structural damages in real-world bridge inspection applications.
| Comparison | Crack #1 | Crack #2 | Crack #3 | |||
|---|---|---|---|---|---|---|
| X | Y | X | Y | X | Y | |
| Computed values (m) | 6.11 | 11.61 | 5.49 | 11.55 | 2.74 | 12.13 |
| Measured values (m) | 6.06 | 11.43 | 5.30 | 11.35 | 3.05 | 11.95 |
| Error (%) | 0.83% | 1.57% | 3.58% | 1.76% | −10.16% | 1.51% |
5.3. In-Situ Test on Concrete Box Girders
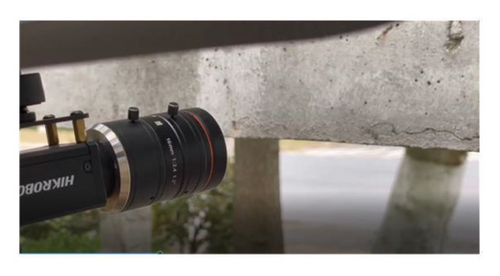
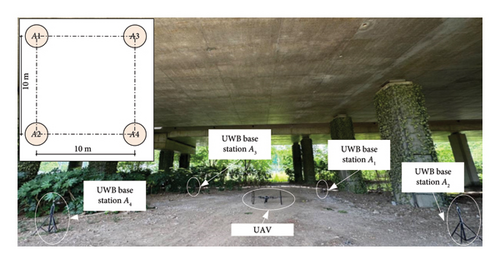
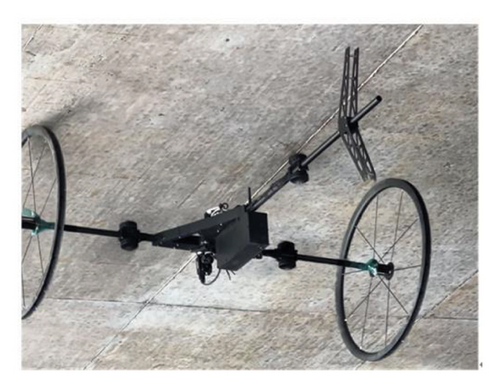
On the same concrete bridge as Section 5.2, another experiment that was aimed to inspect cracks on the bottom surface of the bridge deck was carried out. The setup of the UAV platform and arrangements of the UWB base station were similar to that in Section 5.2, as shown in Figure 20. During the data acquisition process, the UAV was manually piloted to approach the bridge deck until the wheels of the UAV touched the bottom surface of the bridge deck as shown in Figure 21. Images were taken at a 0.5 Hz rate and the UAV was piloted to navigate the entire bridge deck surface.
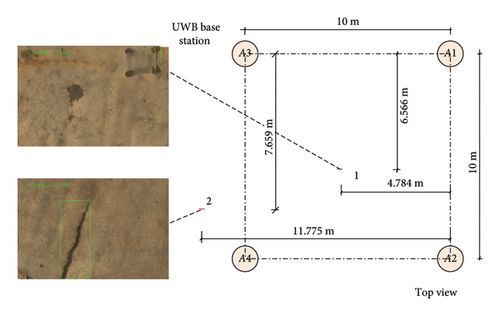
The crack detection and localization results are presented in Figure 22. Two concrete cracks at the bottom surface of the bridge deck were identified successfully. The test successfully identified two significant cracks, with the first located at coordinates X = 6.566 m and Y = 4.784 m, and the second at X = 7.659 m and Y = 11.775 m. These findings highlight the effectiveness of the drone-based system in precisely detecting and accurately locating cracks on the underside of bridge beams, validating its utility in structural health monitoring.
6. Conclusion
This paper explores the intricacies of data acquisition and the automation of crack detection in bridge inspections through a UAV system based on the Robot Operating System (ROS). A crack detection and localization method is proposed and employed on the UAV onboard computer to enable real-time crack recognition and localization during the data acquisition process. After being processed by the crack detection and localization method, only crack images are recorded and sent back for the subsequent data postprocessing, such as crack quantification and visualization. It helps relieve the burden of excessive data storage and postprocessing and thus facilitate the overall inspection process.
The effectiveness of the proposed method is validated using both laboratory tests and in-situ field tests. It can be concluded that the proposed self-organizing UWB positioning system is able to provide stable and accurate UAV positioning data in GNSS-denied spaces, such as the spaces under bridge deck. Four UWB base stations are typically required in order to provide a stable positioning data, while the positioning accuracy and robustness can potentially be further improved by increasing the number of UWB base stations.
The proposed YOLOX-based crack detection method is validated effective in processing acquired images in real-time and identifying concrete cracks with a 0.895 average precision. Data augmentation strategies including Mosaic and MixUp strategies are proved to be effective in improving the accuracy and generalization of the YOLOX crack detection model. Compared with state-of-the-art object detection models, such as RetinaNet, SSD, and YOLOv3 models, the recall performance of the YOLOX model is evidently better, indicating the YOLOX model is able to recognize more existing concrete cracks in real-world crack inspection applications. By integrating the proposed crack detection model with UAV positioning data from UWB sensors, the proposed method can automatically estimate the locations of detected cracks and thus inform the inspectors of the spatial distributions of the cracks on the bridge. In this way, existing concrete cracks on the bridge structure can be inspected, even for the cracks in hard-to-reach areas, such as those underneath bridge decks and high-pier bridge structures.
While the proposed method demonstrates effectiveness in detecting and localizing concrete cracks using the YOLOX-based model, its application is currently limited to this specific type of surface damage. To broaden the application of the proposed method across various types of surface damage, the model would require retraining to function as a multi-class damage classifier. Comprehensive experimental validations are also required to assess the effectiveness of the proposed method on different types of surface damage inspection. Furthermore, the current UAV system requires manual pilot and maintains a visual line of the sight throughout the inspection process, which can pose challenges in real-world scenarios, particularly in complex environments like bridge structures or areas with numerous obstacles. The need for manual operation also complicates the process for operators who must identify inspected areas and track the inspection progress, potentially slowing down the process and introducing human error. To address these challenges, future work can be planned to develop advanced path planning and UAV control algorithms. These improvements aim to enable a fully automated data acquisition process, minimizing human intervention and enhancing the efficiency and accuracy of structural inspections. Such advancements would not only streamline operations but also enhance the adaptability of the system to various inspection environments.
Conflicts of Interest
The authors declare no competing financial interests or personal relationships that could have appeared to influence the work reported in this paper.
Funding
The authors would like to acknowledge the financial support from the National Key Research and Development Program of China (2023YFC3804300), Natural Science Foundation of Jiangsu Province (Grant No. BK20230859), the Fundamental Research Funds for the Central University (No. RF1028623283), Fundamental Research Funds for Central Public Welfare Research Institutes (Grant No. Y424011), and in part by the Tencent Foundation and XPLORER PRIZE.
Acknowledgments
The authors would like to acknowledge the financial support from the National Key Research and Development Program of China (2023YFC3804300), Natural Science Foundation of Jiangsu Province (Grant No. BK20230859), the Fundamental Research Funds for the Central University (No. RF1028623283), Fundamental Research Funds for Central Public Welfare Research Institutes (Grant No. Y424011), and in part by the Tencent Foundation and XPLORER PRIZE.
Open Research
Data Availability Statement
Data, models, and code developed in the study are available upon direct request to the authors.


