Seismic Performance Analysis of Replaceable Corrugated Steel Plate Composite Shear Walls Based on Interaction Relationships
Abstract
Replaceable systems, including the main structure and components, are the primary means of building a resilient city. However, due to the complex interaction relationships, the energy-dissipation effect of such structural systems is not ideal. Accordingly, this study used a replaceable corrugated steel plate composite shear wall as an example, focusing on the seismic performance and energy-dissipation ratio analyses of each component. We attempted to find a suitable stiffness ratio index to determine the interaction relationship of the replaceable corrugated steel plate shear wall. An energy-dissipation evaluation method is proposed based on the stiffness ratio index, and the bearing-capacity formula of the shear wall was modified. The results show that the revised lateral-bearing-capacity formula based on the energy dissipation evaluation exhibited ideal accuracy and could provide a reference for practical engineering applications.
1. Introduction
Traditional shear wall structures dissipate seismic energy through plastic deformation. However, this approach makes the damaged structural parts diffuse and difficult to repair [1, 2]. Accordingly, scholars have developed shear wall structures with replaceable energy-dissipation components [3, 4]. As opposed to conventional structures, the main structure of the replaceable shear wall should always be in the elastic phase during an earthquake, where damage is concentrated on the damaged components. The structural function can be restored by replacing damaged components after an earthquake.
When an earthquake occurs, a large amount of energy is released into buildings [5–7]. To protect the main body of a structure from damage, it is necessary to effectively control the seismic energy [8–10]. Concentrated-energy-dissipation components are known as damage components and are mostly found in dampers [11–13]. Dampers can be classified into several types: displacement, velocity, and compound dampers. Among them, displacement dampers have been widely used in replaceable structures owing to their clear force, stable performance, and ease of replacement [14]. Researchers have focused on proposing novel dampers and experimentally verifying their performance. Ma et al. proposed a novel rotary amplification friction damper, which was shown to have superior seismic control effectiveness in the experimental analysis [15]. Chen et al. proposed a metallic torsional damper using a gear and rack device, and the configuration and working principle of the proposed damper are introduced [16]. Li et al. proposed the corrugated pipe damper and carried out experiment and finite element analysis. The results showed that the damper exhibited good horizontal deformation and energy dissipation capacities, and excellent seismic fatigue performance [17]. In fact, dampers are generally not used independent of their main structure; their performance efficiency varies with the interaction relationship [18]. Therefore, performance efficiency should be investigated to fully exploit the damper performance; however, research in this area is lacking.
For replaceable shear walls, the following limitations hinder their application in practical engineering: (i) Damage control is the key to a replaceable structure, and the requirements for damaged components are more stringent. The stress transfer mode between the damper and main body of the wall is different, which should ensure that the damper fails before the wall. Currently, the main approach for replaceable shear walls is a parameter sensitivity analysis, and there is a lack of research on damage control methods. (ii) The interaction is the basis for evaluating the structural performance efficiency. The optimal performance state between components cannot be achieved in engineering design for various reasons. However, the evaluation criteria based on these interactions are rare.
In essence, the performance efficiency reflects the synergy between the damper and main body of a structure, and an ideal interaction relationship is a necessary condition for the damper to exert its energy-dissipation capacity. Therefore, this study aimed to explore the seismic performance and interaction relationship of a replaceable shear wall. First, we describe the experiments conducted in this study. Subsequently, the replacement area dimensions and shear wall deformation were analyzed. The seismic performance of the replaceable shear wall was investigated, and the interaction relationships, energy dissipation, and energy-dissipation ratio were analyzed. Finally, an energy-dissipation evaluation method is proposed, and the bearing-capacity formula of the shear wall was modified. The revised formula could serve as a reference for practical engineering applications.
2. Materials and Methods
2.1. Wall Body
A shear wall, which is the main body of a toe-replaceable structure, should have excellent energy-dissipation capacity and sufficient bearing capacity. The application and development of reinforced concrete shear walls in practical engineering are limited by shortcomings such as poor ductility, self-weight, and easy cracking [19, 20]. It is difficult to fully exploit the seismic properties of a steel plate shear wall because of its easy buckling [21–23]. A composite shear wall was developed to address the low ductility of reinforced concrete shear walls and easy buckling of steel plate shear walls [24, 25]. Previous studies have shown that concrete not only directly improves the bearing capacity of the steel plate shear wall but also constrains the steel plate to prevent buckling. This effectively increases the seismic efficiency of the steel plate [26, 27].
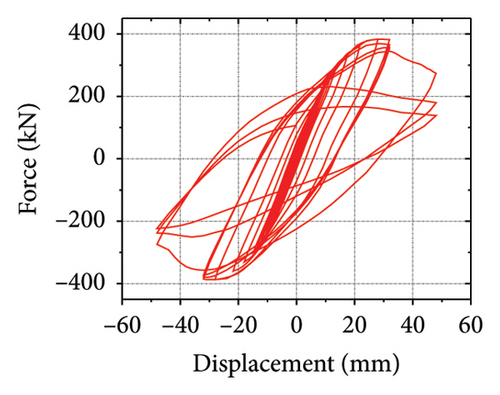
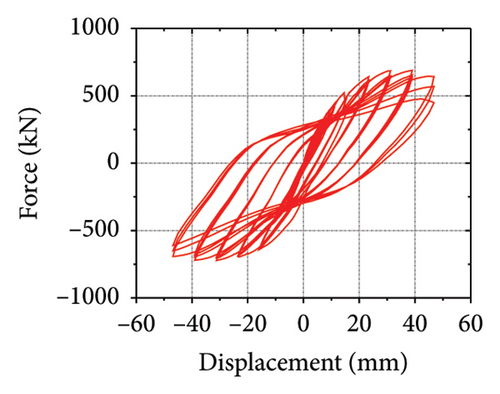
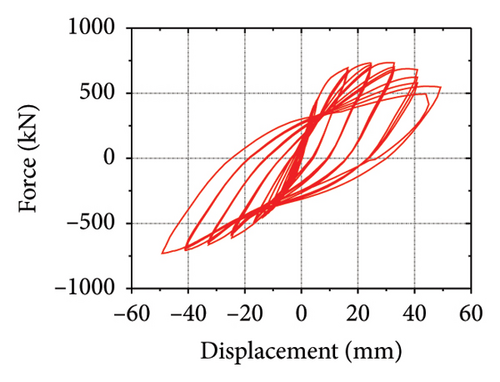
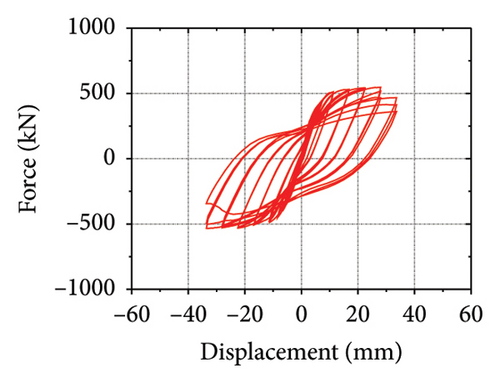
Corrugated plates developed from flat plates are widely used owing to their superior out-of-plane stiffness and lateral bearing capacity [28]. In 2019, our research group applied corrugated steel plates to a shear wall and designed six shear wall specimens [29], as shown in Figure 1. “SPSW” and “SPCSW” represent the steel plate shear wall and steel plate composite shear wall, respectively. “1,” “2,” and “3” represent the flat, vertical corrugated, and horizontal corrugated steel plates. The advantages of the corrugated steel plate shear walls and corrugated steel plate composite shear walls were explored using hysteretic loading. The results showed that the corrugated steel plate was equivalent to “ribbing” outside the flat steel plate, which increased the out-of-plane stiffness and improved its seismic performance. Furthermore, due to the “accordion effect,” the energy-dissipation capacity along the corrugated direction was prominent, while the vertical corrugated direction had higher initial stiffness and bearing capacity.
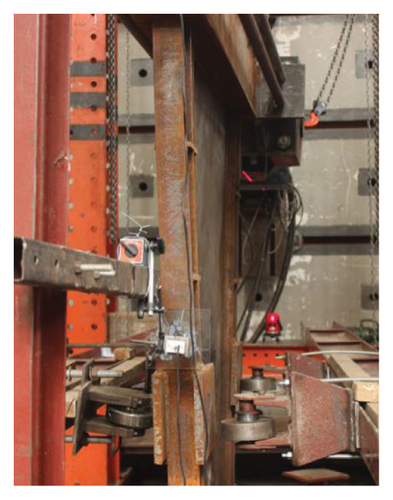
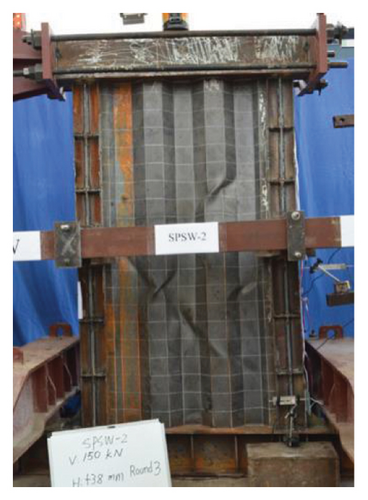
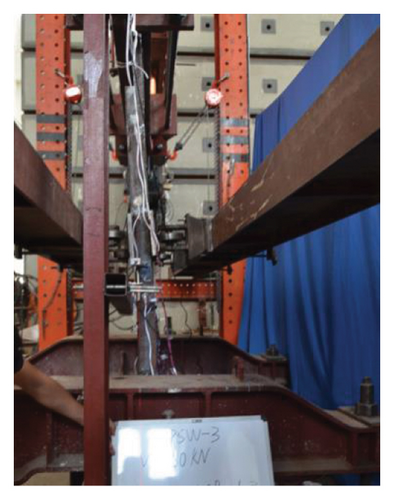
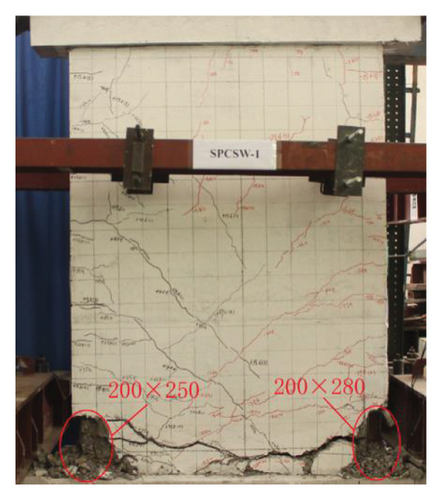
The hysteretic curves are shown in Figure 2. SPCSW-1–3 exhibited a lateral capacity of 688.8, 733.0, and 547.2 kN, respectively. Compared to the SPSW specimens, SPCSW-1–3 exhibited higher bearing capacities, increasing by 252.8%, 200.4%, and 141.8%, respectively. Clearly, the SPCSW specimens exhibited better seismic performance than the SPSW specimens. Compared to SPCSW, SPCSW-3 exhibited the lowest bearing capacity. Combined with the final failure state, it can be inferred that the concrete in SPCSW-3 could not ideally limit the deformation of the horizontal steel plate. Therefore, it was difficult for the horizontally corrugated steel plate to perform the full rule, which resulted in the worst seismic performance. Overall, the corrugated steel plate composite shear walls exhibited excellent seismic performance and could be used as the main components in replaceable structures.
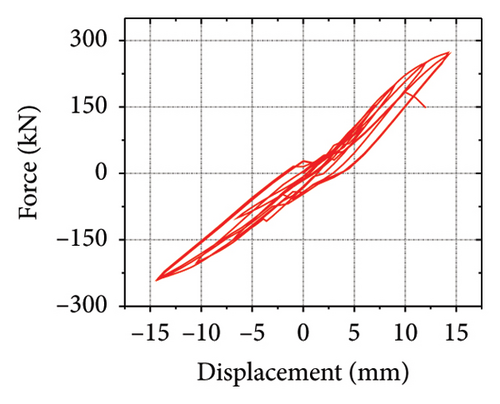
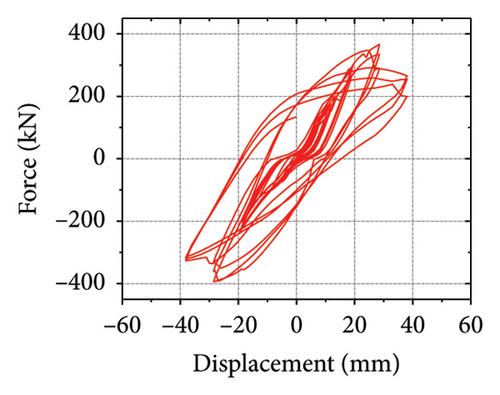
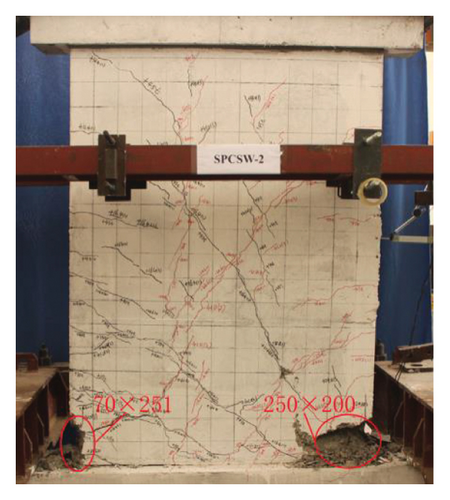
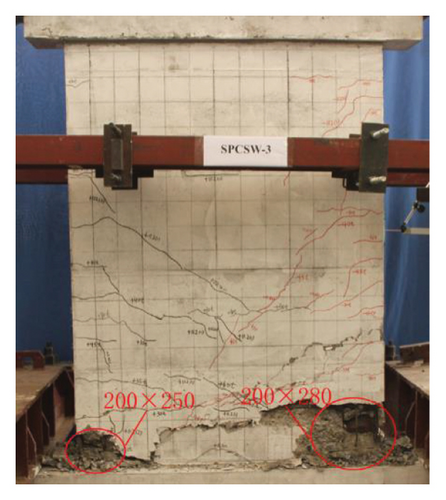
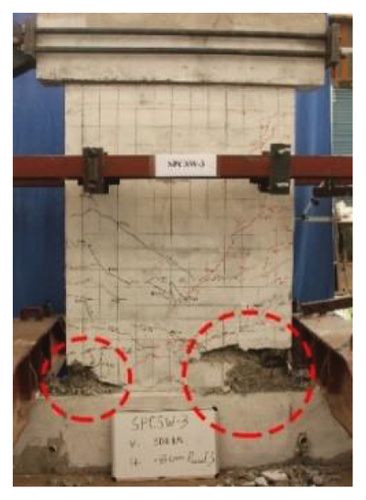
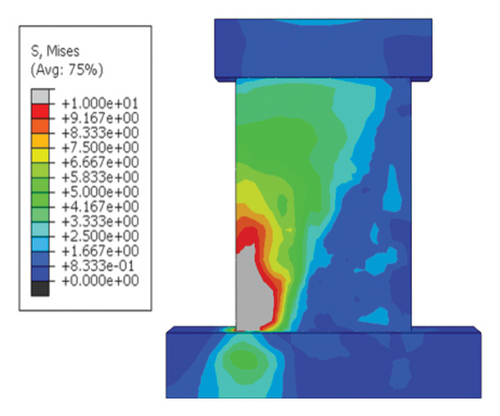
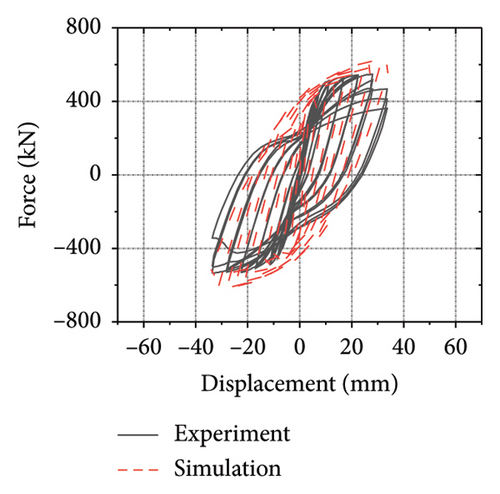
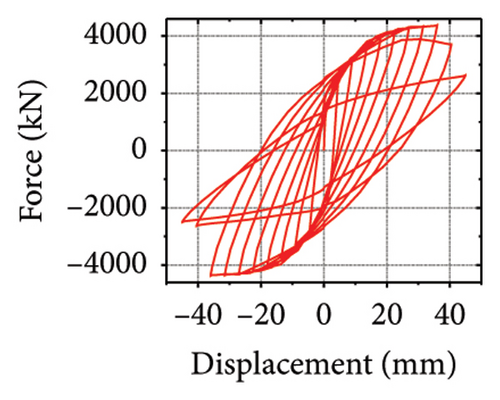
Following the abovementioned results, SPCSW-3 was modeled. Solid element C3D8R was used to simulate the concrete and steel plates, and truss element T3D2 was used to simulate the steel bars. Stud and bond slips were simplified in the model, and the “Embedded” method was used to embed the steel skeleton in the concrete. A more detailed modeling process can be found in [29]. Figure 3 shows the failure modes and hysteresis curves for the modelled and experimental specimens. The ultimate failure in the experiment was concrete spalling at the toe, and the steel skeleton could not continue to bear the load. Although the validation model struggles to reflect the crack failure of the concrete, the stress is still concentrated at the toe of the wall. The hysteresis curves are generally consistent with each other. The differences in the final bearing capacities and corresponding peak displacements were small. In general, the model effectively reproduced the entire experimental failure process.
2.2. Energy-Dissipation Component
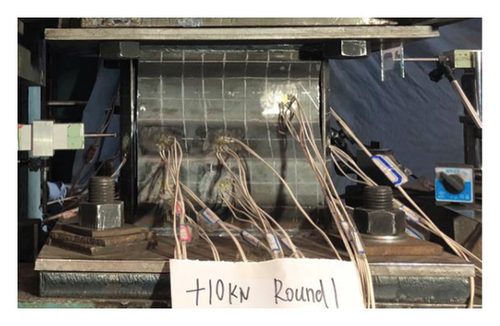
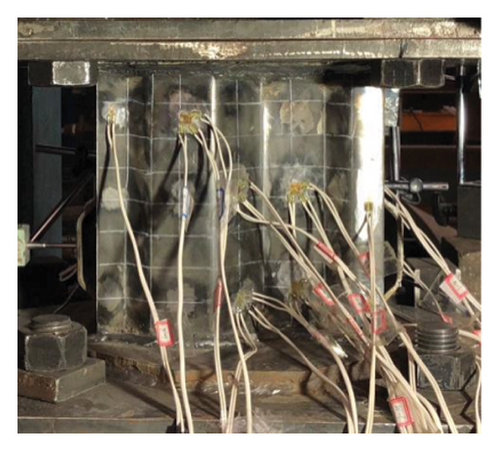
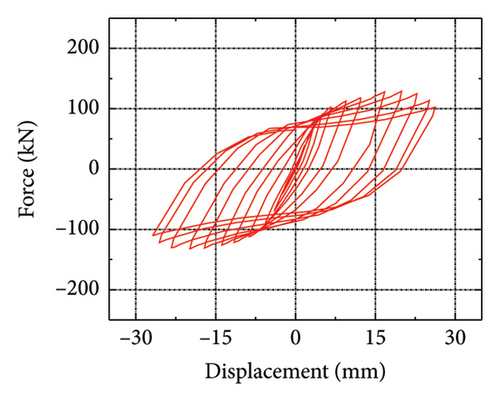
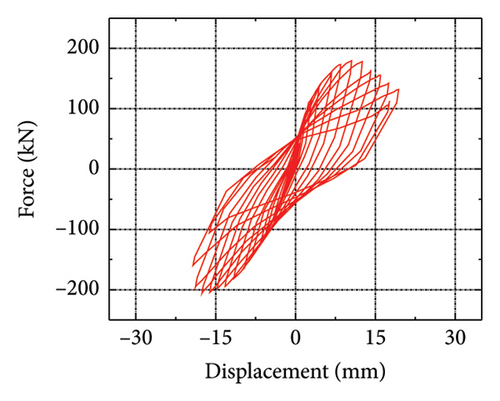
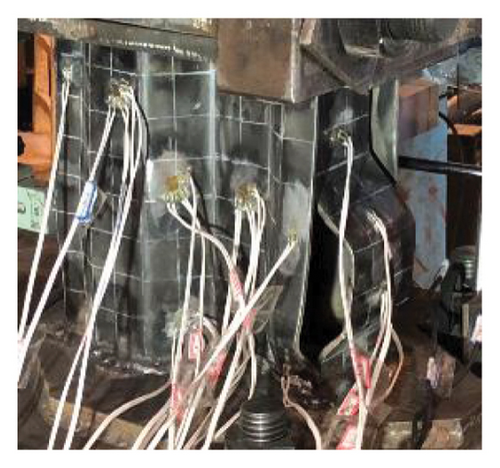
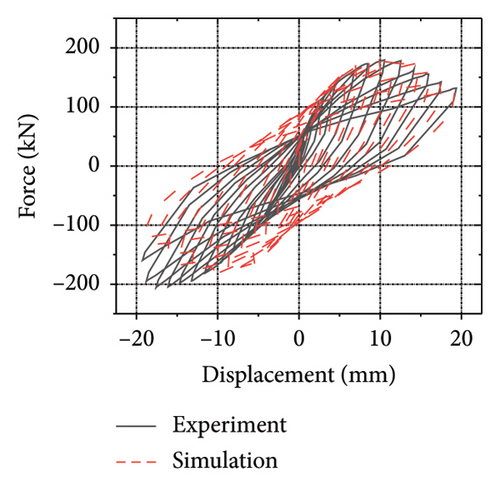
A previous study proposed two new metal dampers with a corrugated web [14, 30], as shown in Figure 4. Additionally, the following steel-type parameters were added: mild steels LYP160 and Q235. The four specimens were named CMSD-H, CSPD-H, CMSD-V, and CSPD-V. CMSD, and CSPD represent steel dampers with mild steels LYP160 and Q235, respectively. H and V represent the horizontal and vertical webs used for the energy-dissipation web, respectively. Figure 5 shows the hysteresis curves of the specimens. The peak loads of CMSD-H, CMSD-V, CSPD-H, and CSPD-V were 129.1, 179.4, 117.7, and 211.5 kN, respectively. Because of the accordion effect, the peak load of the horizontal corrugated web damper was lower than that of the vertical corrugated web damper. Compared with conventional steel dampers, mild steel dampers have a lower initial stiffness. The combination of steel structures and mild steel dampers can achieve the dual goal of damage concentration and energy dissipation improvement. In general, the damper exhibited excellent seismic performance and can be used as an energy-dissipation component in replaceable structures. Subsequently, a model was developed based on the CMSD-V specimen. The energy-dissipation web and the main board were connected via “Tie,” and the energy-dissipation web was simulated by shell element S3R, which was convenient for simulating the buckling deformation of the web. A more detailed modeling process can be found in [18]. A comparison between the simulation and experimental results is shown in Figure 6. Because the simulation was in an ideal state and weld failure was ignored, the hysteresis curve of the numerical model was greater than that of the experiment. The maximum simulated and experimental loads were 182.9 and 179.4 kN, respectively, with a deviation of only 1.9%.




2.3. Replaceable Corrugated Steel Plate Composite Shear Wall
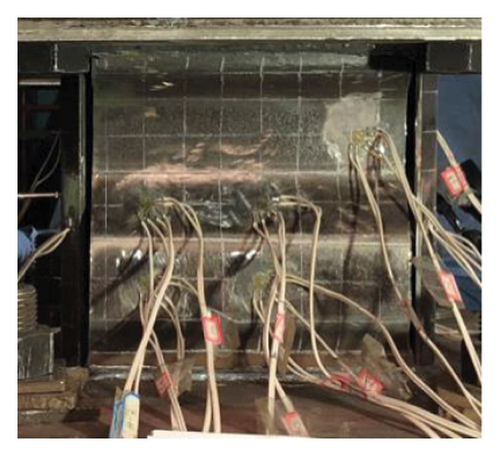
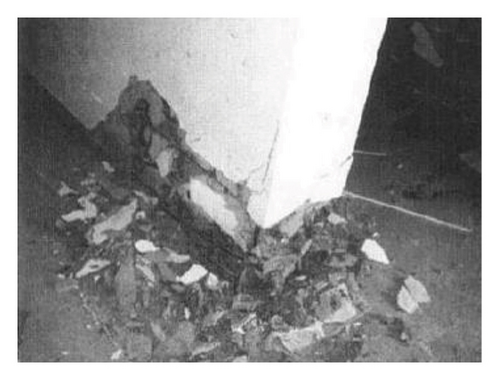
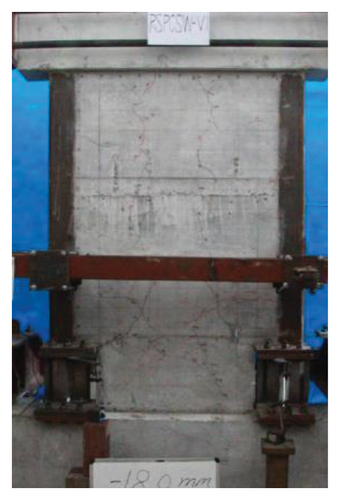
Connecting beams are common replaceable components in shear walls. By weakening the connecting beams, energy dissipation is concentrated to protect the main shear wall structure from damage. However, this replaceable form is only applicable to coupled shear walls and not to single shear walls. In fact, a single shear wall under seismic action exhibits toe failure, as shown in Figure 7. Based on this feature, our research group investigated the seismic performance of a toe-replaceable shear wall [32], as shown in Figure 8. The results indicated that the lateral bearing capacity, initial stiffness, and ductility of the shear wall could be restored by removing the plastic hinge area and setting a metal damper. Toe replacement in a shear wall is an effective means for functionally restoring a single shear wall. However, in that study, we only focused on the change in shear wall performance before and after toe replacement and did not investigate the structural performance interaction relationship in detail. Additionally, the engineering application was limited to a toe-replaceable structure. Therefore, the current study considered a horizontally corrugated steel plate composite shear wall as an example to investigate its hysteretic performance and interaction relationship.
3. Replacement Area and Wall Deformation Analysis
3.1. Replacement Area Analysis
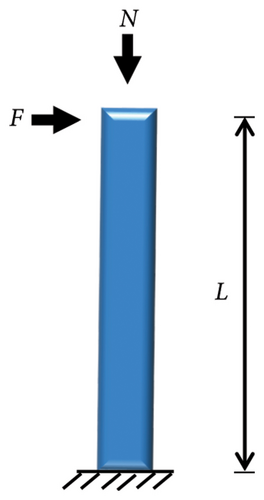
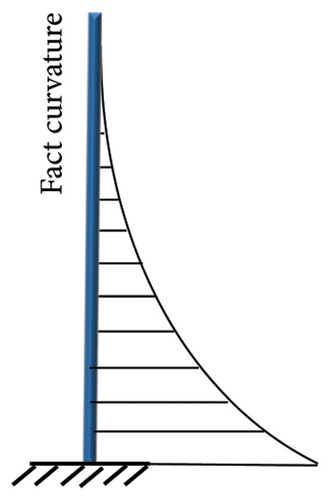
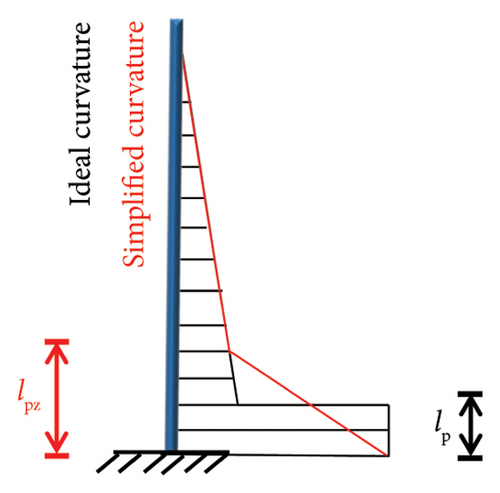
The size of the plastic hinge area of a shear wall determines its seismic performance before and after replacement. Various theoretical calculations have been employed to obtain the plastic-hinge length of shear walls. Among them, the simplified approach of idealizing the wall components as independent rods has been widely adopted [33], as shown in Figure 9. First, it was assumed that (i) the shear wall curvature was linearly distributed along the height before yielding; (ii) after yielding, the shear wall curvature was distributed along the height in a double-fold line; (iii) the plastic hinge length lpz was equal to the height of the difference between the limit and yield curvatures in the wall height direction; and (iv) the equivalent plastic hinge length lp was determined according to the principle that the ideal curvature was equal to the theoretical curvature height.
3.2. Wall Deformation Analysis
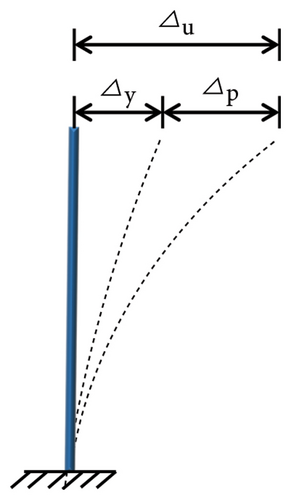
A composite shear wall with a replaceable toe was selected as the research object, as shown in Figure 10. The deformation process of the structure is highly complex and can be divided into shear and bending deformations, as shown in Figures 11(a), 11(b), 11(c). The essence of bending deformation is that under the action of the bending moment, one side of the wall is strained, and the other side is pressurized. Figure 12 shows the bending deformation force diagram. When the wall aspect ratio is large, the wall is prone to bending and deformation, whereas shear deformation occurs in walls with small aspect ratios. However, the damper should also play an energy-dissipating role. The setup principle was to ensure that the damage was concentrated on the damper; meanwhile, the damper should have a good energy-dissipation capacity.
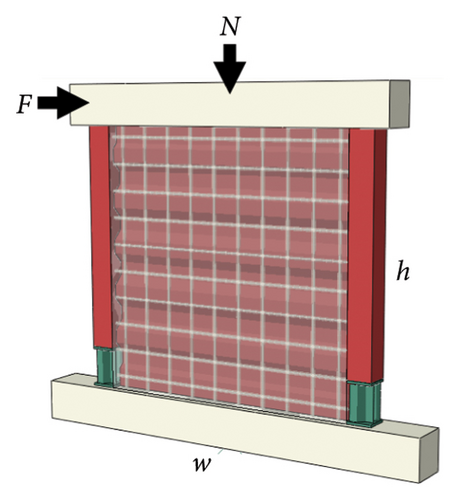
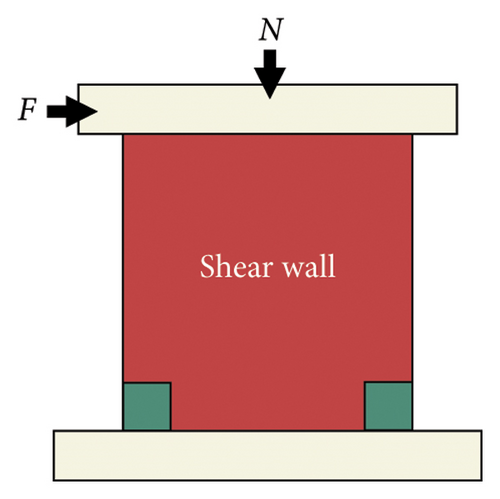
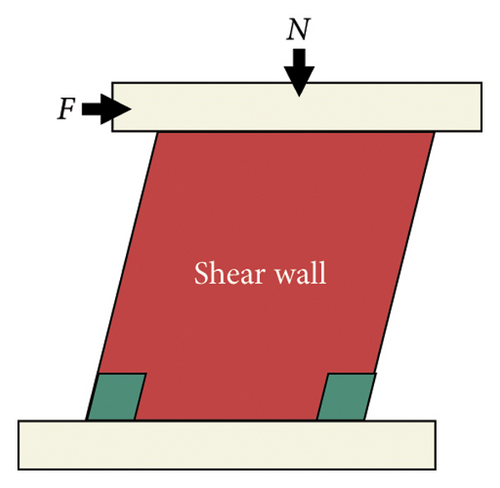
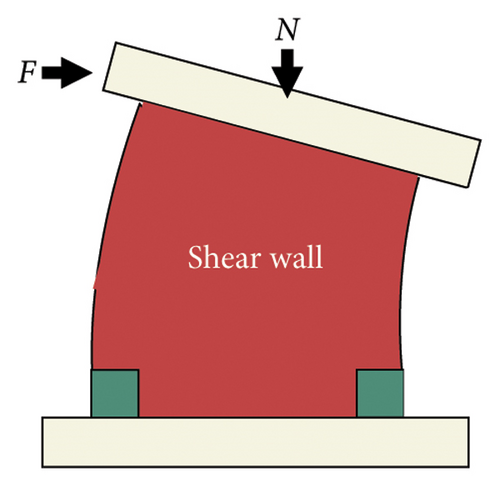
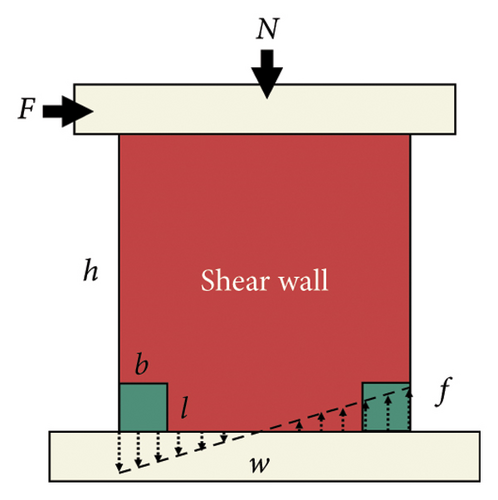
For shear deformation, the lateral deformation of the bottom is much larger than that of the other areas when the damping stiffness is low. When the damper stiffness is high, the deformation of the main structure is large, and the stress is concentrated on the main structure, which is detrimental to the seismic performance of the damper.
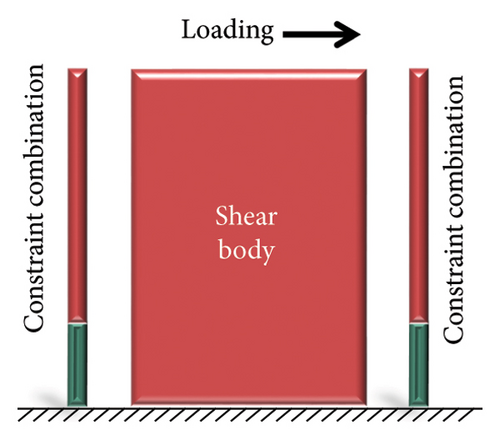
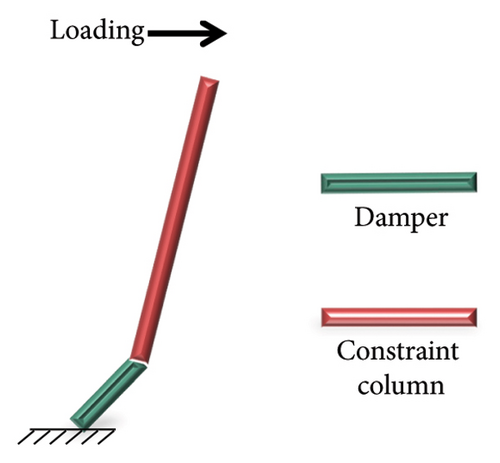
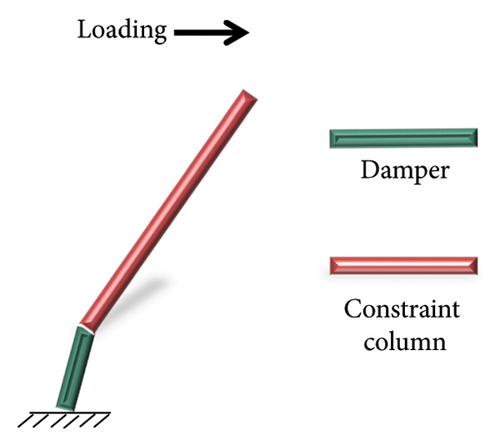
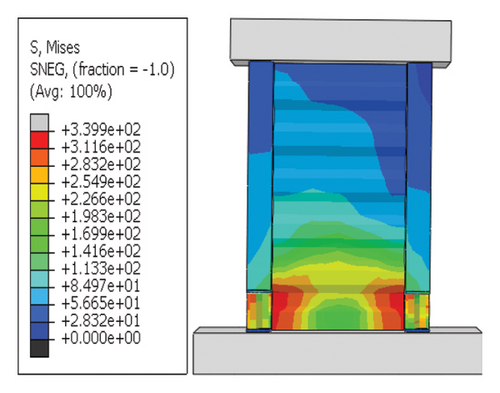
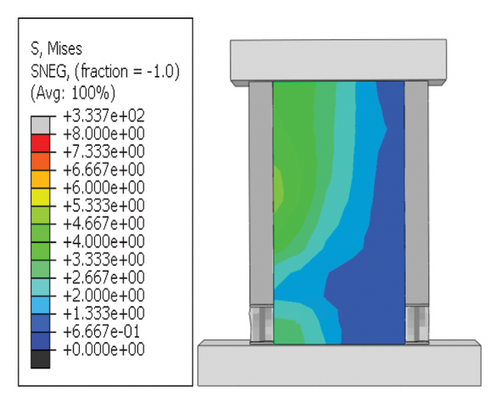
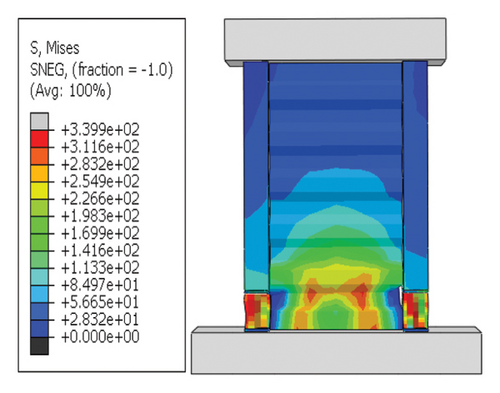
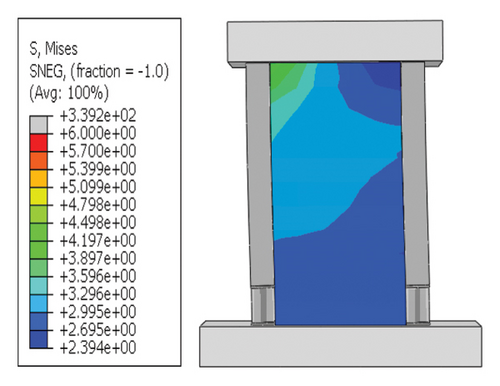
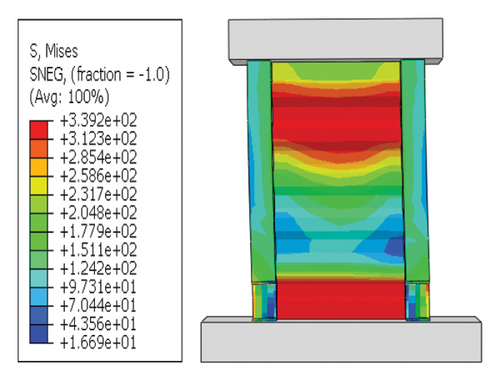
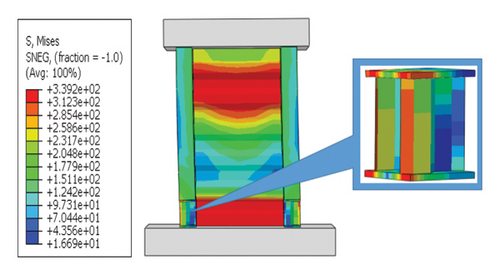
For shear deformation, the damper and constraint column together formed an edge constraint combination, as shown in Figure 13(a). The edge constraint combination consisted of a damper and a constraint column. When the damper stiffness is insufficient, the deformation and stress are primarily concentrated on the damper, which exerts a better energy-dissipation capacity, as shown in Figure 13(b). When the damper stiffness is high, the damper hardly deforms, making it difficult to achieve its energy-dissipation target. Therefore, this situation should be avoided in design, as shown in Figure 13(c).
4. Parameter Analysis
4.1. Coupling Effect of the Wall Aspect Ratio and Damper Web Thickness
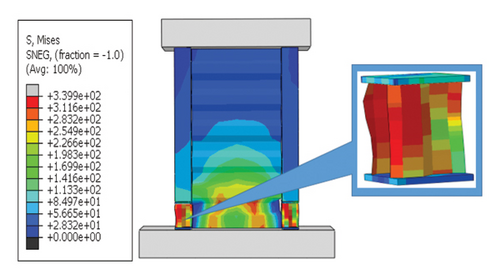
Based on the simulation results and calculation for the plastic hinge, the toe replacement size was determined to be 300 × 300 mm2. First, the coupling effects of the wall aspect ratio and damper web thickness were analyzed. The specimens were named following the convention “corrugated plate height-width-thickness—damper web thickness—constraint column thickness.” By summarizing the loading process of the specimens, it was found that there were two wall failure modes, as shown in Figure 14. Taking a specimen with an aspect ratio of 1:2 as an example, when the damper stiffness was low, the stress was better concentrated on the damper, and the final failure mode was dominated by the buckling failure of the damper. Conversely, when the damper stiffness was high, the stress did not easily concentrate on the damper.
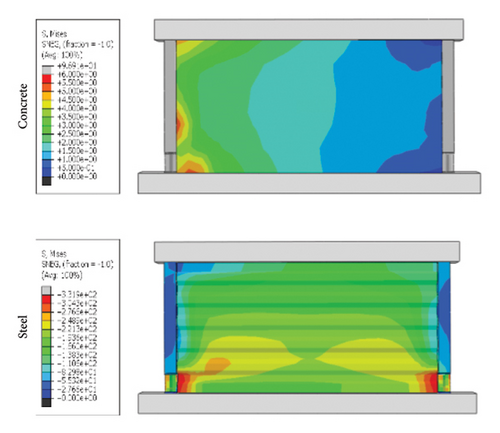
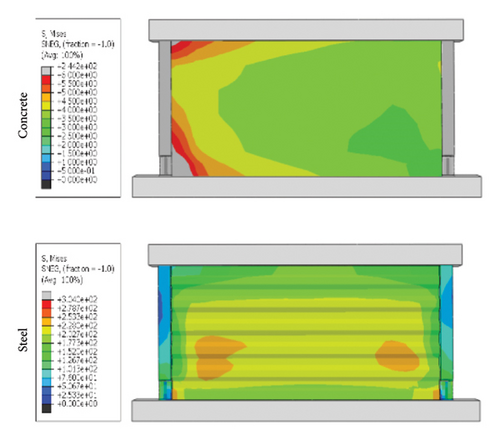
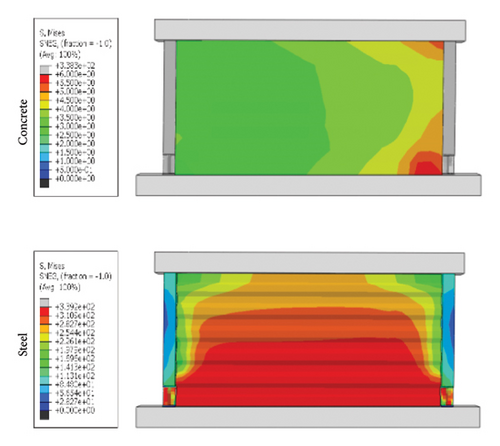
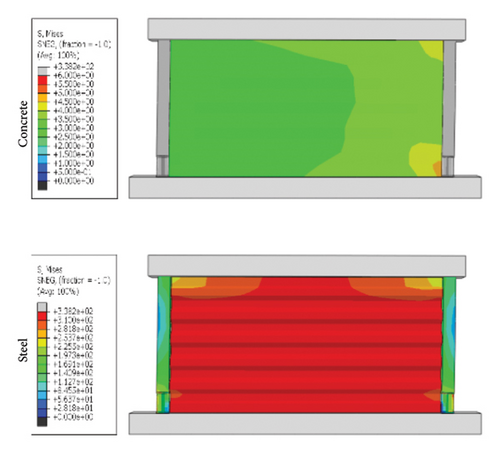
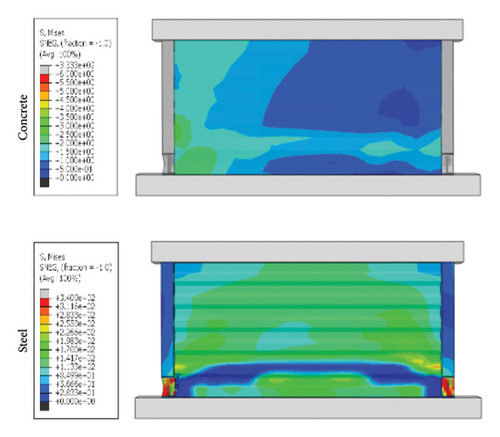
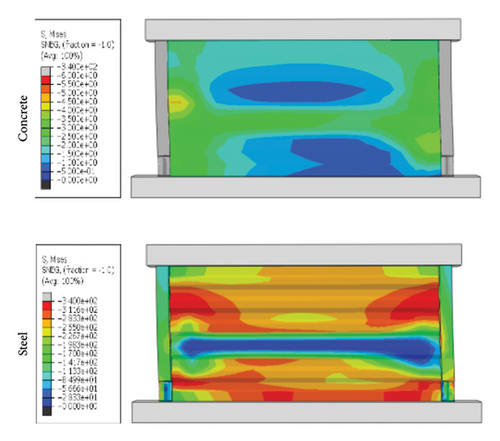
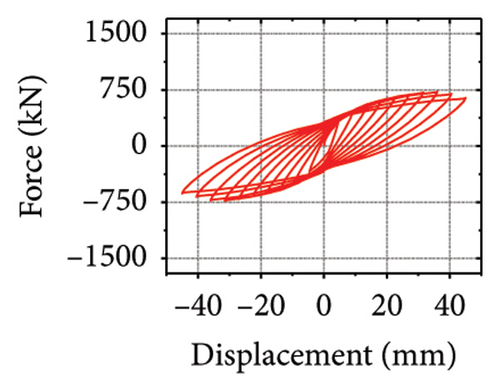
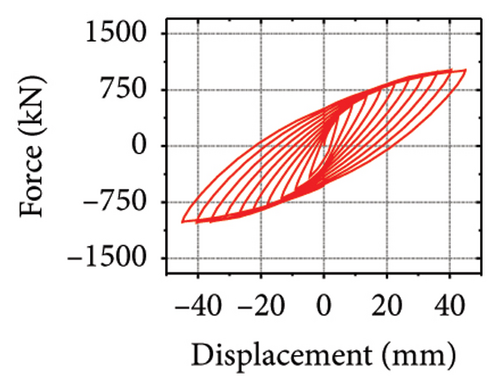
Figure 15 shows the hysteresis curves for all specimens. The aspect ratio was the main factor influencing the ultimate bearing capacity of the replaceable shear wall. However, for the same aspect ratio, the seismic performance of the wall was limited when the damper web thickness was insufficient, making it difficult to provide sufficient restraint to the wall. For example, the ultimate bearing capacities of specimens 3-1-3-dt6-15 and 3-1-3-dt24-15 were 724.0 and 1284.6 kN, respectively, indicating that the damper parameters in the wall toe replaceable structure should be reasonably set to give full play to the seismic performance of the wall. When the restraining ability of the constraint combination on the wall was insufficient, the seismic performance of the shear wall was limited.
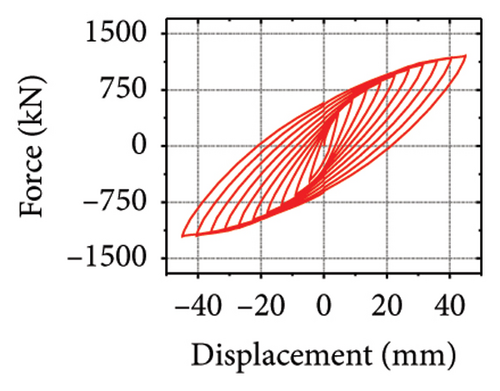
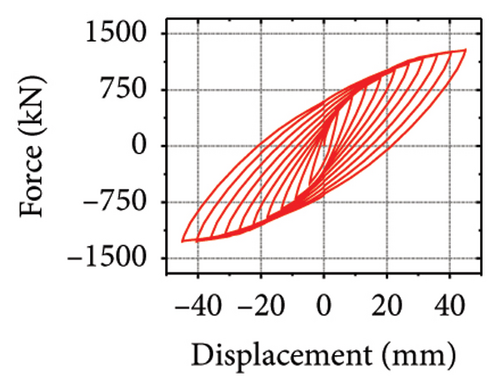
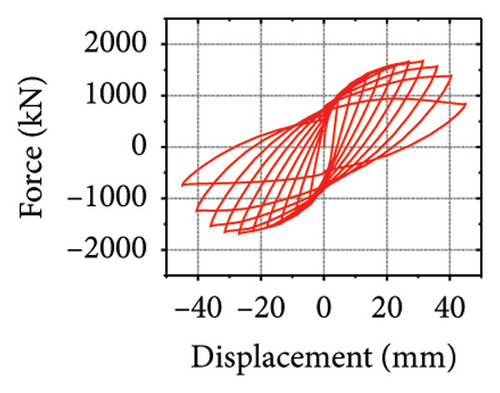
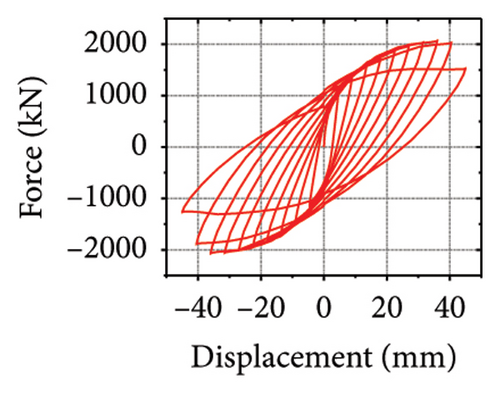
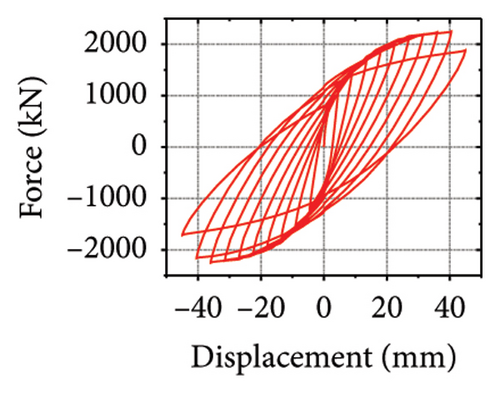
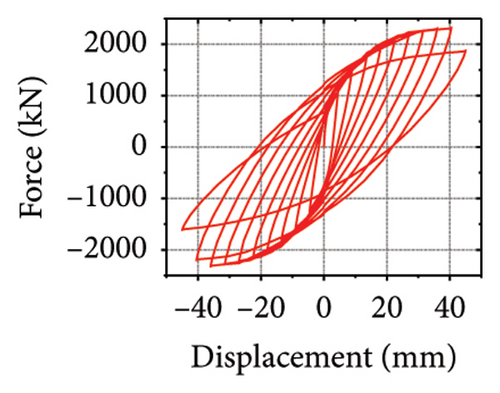

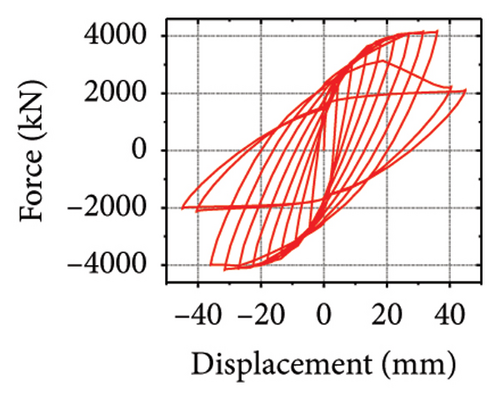
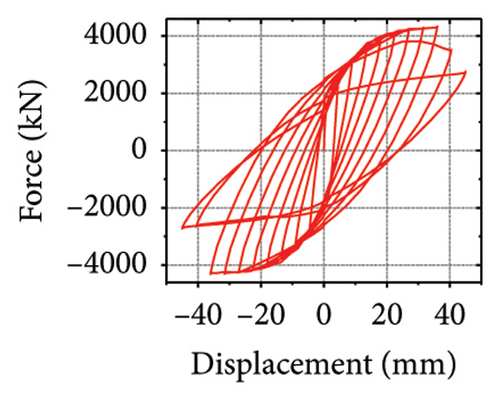
The energy-dissipation and stiffness ratios of each component are listed in Table 1. Different damper and constraint column combinations correspond to different restraint abilities, which reflect the energy-dissipation relationship between the constraint combination and the wall. When rh−cdw was greater than 2%, the total energy dissipation of the damper and restraint column was larger than that of the wall body. When rcdw was less than 2%, the total energy dissipation of the wall toe replaceable structure was higher; however, the energy dissipated by the damper was less than that of the corrugated plate. These results indicate that the energy-dissipation capacity of the damper was insufficient. Therefore, the stiffness ratios rh−cdw and rv−dw could be important indices for the energy-dissipation relationship of the replaceable shear wall.
| Specimen | Stiffness (kN/mm) | Stiffness ratio (%) | Ultimate force (kN) | Energy dissipation (kJ) | |||||||
|---|---|---|---|---|---|---|---|---|---|---|---|
| Kh−dam | Kv−dam | Kh−cd | Kwal | rh−cdw | rv−dw | P | Econ | Edam | Epla | Ecol | |
| 2-1-3-dt6-15 | 48.9 | 273.9 | 4.5 | 487.7 | 0.9 | 56.2 | 724.0 | 10.0 | 95.9 | 48.6 | 8.2 |
| 2-1-3-dt12-15 | 98.3 | 546.8 | 4.7 | 487.7 | 1.0 | 112.1 | 1019.9 | 14.2 | 118.1 | 68.9 | 21.2 |
| 2-1-3-dt18-15 | 146.1 | 811.9 | 4.7 | 487.7 | 1.0 | 166.5 | 1206.1 | 17.4 | 101.2 | 95.9 | 32.2 |
| 2-1-3-dt24-15 | 191.8 | 1068.8 | 4.8 | 487.7 | 1.0 | 219.1 | 1284.6 | 19.2 | 84.3 | 118.0 | 40.0 |
| 1-1-3-dt6-15 | 48.9 | 273.9 | 4.5 | 1038.2 | 0.4 | 26.4 | 1677.8 | 35.3 | 160.6 | 196.7 | 10.7 |
| 1-1-3-dt12-15 | 98.3 | 546.8 | 4.7 | 1038.2 | 0.4 | 52.7 | 2069.8 | 41.7 | 179.9 | 281.8 | 26.4 |
| 1-1-3-dt18-15 | 146.1 | 811.9 | 4.7 | 1038.2 | 0.5 | 78.2 | 2251.7 | 46.6 | 125.4 | 355.7 | 39.9 |
| 1-1-3-dt24-15 | 191.8 | 1068.8 | 4.8 | 1038.2 | 0.5 | 102.9 | 2323.3 | 49.4 | 95.6 | 393.8 | 46.8 |
| 1-2-3-dt6-15 | 48.9 | 273.9 | 4.5 | 2110.4 | 0.2 | 13.0 | 3802.5 | 118.6 | 188.4 | 578.1 | 11.8 |
| 1-2-3-dt12-15 | 98.3 | 546.8 | 4.7 | 2110.4 | 0.2 | 25.9 | 4164.1 | 129.9 | 232.1 | 688.2 | 24.5 |
| 1-2-3-dt18-15 | 146.1 | 811.9 | 4.7 | 2110.4 | 0.2 | 38.5 | 4317.9 | 125.2 | 172.3 | 817.2 | 36.5 |
| 1-2-3-dt24-15 | 191.8 | 1068.8 | 4.8 | 2110.4 | 0.2 | 50.6 | 4381.2 | 133.3 | 83.0 | 868.5 | 47.7 |
- Note: Kh−dam and Kv−dam are the horizontal and vertical stiffnesses, respectively. Kh−cd is the horizontal stiffness of the restraint combination. Kwal is the stiffness of the shear wall. rh−cdw is the horizontal stiffness ratio of the entire wall. rv−dw is the stiffness ratio of the damper to the wall. Econ, Edam, Epla, and Ecol are the energy-dissipation values of the concrete, damper, steel plate, and restraint column, respectively.
4.2. Coupling Effect of the Corrugated Plate Thickness and Damper Web Thickness
- (i)
Damper failure mechanism: The vertical stiffness and bearing capacity of the corrugated-web damper were insufficient. It was difficult to bear axial deformation at the toe, and the damage was concentrated on the damper. Therefore, the damper was the main factor limiting the seismic performance of the wall toe replaceable structure.
- (ii)
Wall body failure mechanism: When the damper had sufficient vertical stiffness and bearing capacity, it hardly deformed. It was difficult for the energy-dissipation capacity of the damper to play a full role, as shown in Figure 17. In addition, this failure mode indicated that the damper failed before the wall; thus, the energy-dissipation relationship between the damper and wall was not ideal.
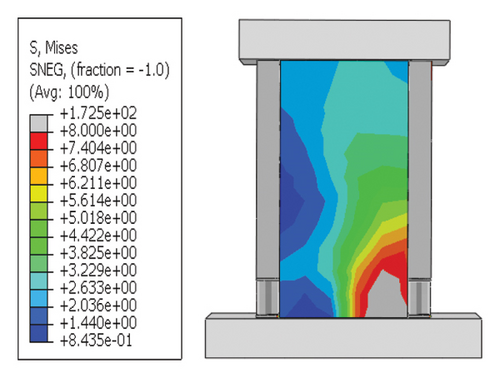
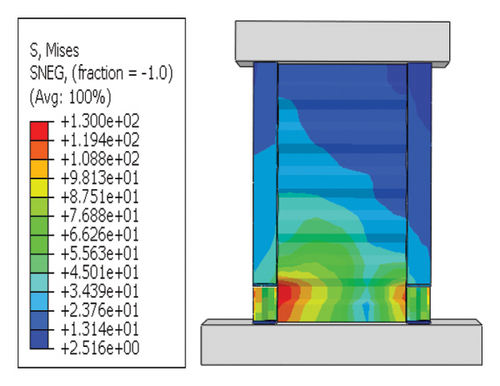
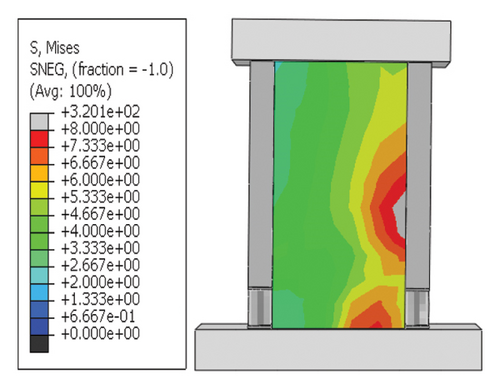
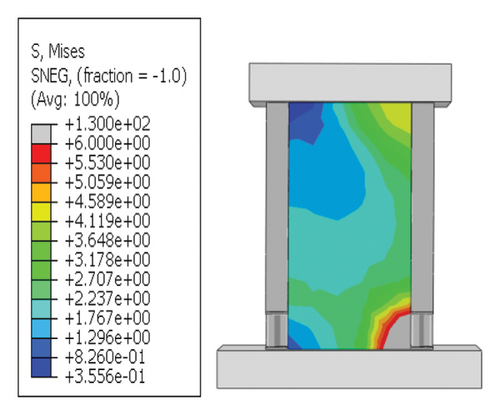
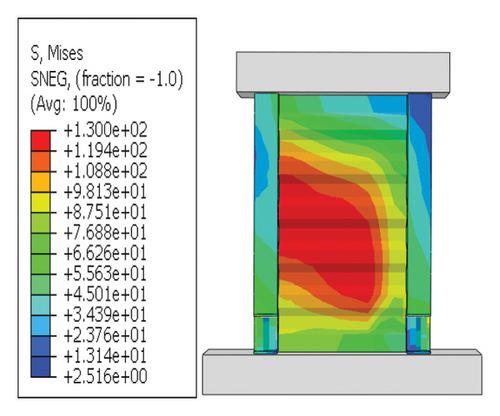
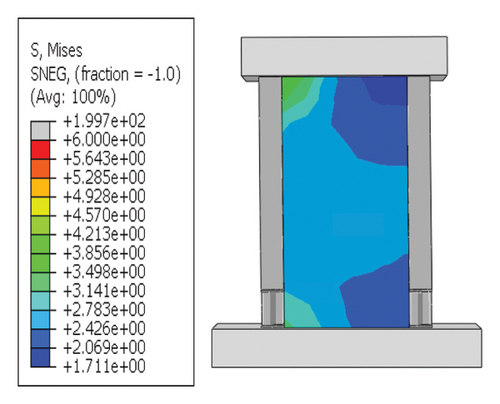
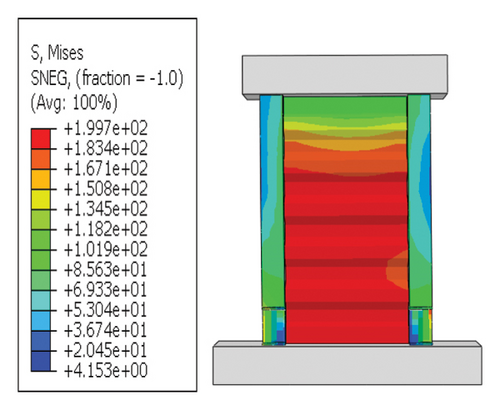
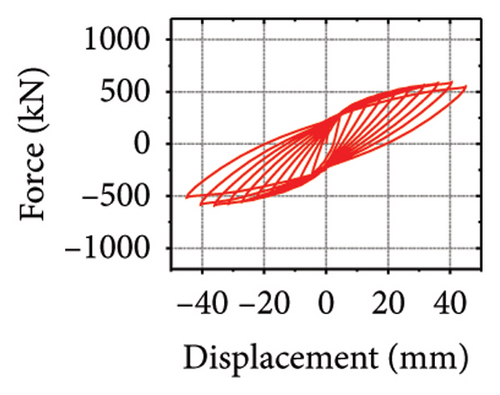
Next, the hysteretic curves of 12 specimens were investigated, as shown in Figure 18. (i) For specimens with a corrugated web thickness of 1 mm, when the damper web thickness increased from 6 to 24 mm, the peak load of the wall increased from 591.0 to 818.9 kN. (ii) For specimens with a damper web thickness of 6 mm, when the corrugated plate thickness increased from 1 to 5 mm, the peak load of the wall increased from 591.0 to 828.5 kN, indicating that the dampers limited the seismic performance of the wall. (iii) For specimens with a damper web thickness of 24 mm, when the corrugated plate thickness increased from 1 to 5 mm, the peak load of the wall increased from 818.9 to 1606.9 kN. Compared with specimen 2-1-DT6-15, the peak load increased by 171.9%. It could be concluded that the seismic performance of the damper was the main factor limiting the seismic performance efficiency of the replaceable shear wall, and that the corrugated plate thickness affected the ultimate seismic performance of the replaceable shear wall.
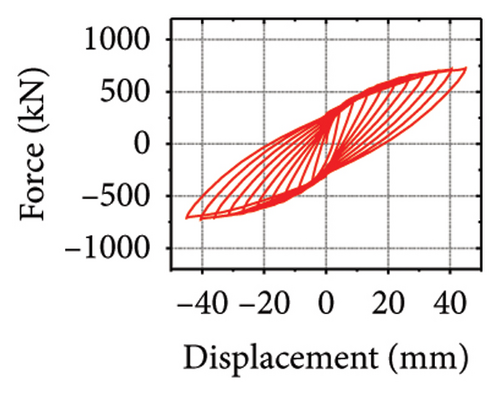
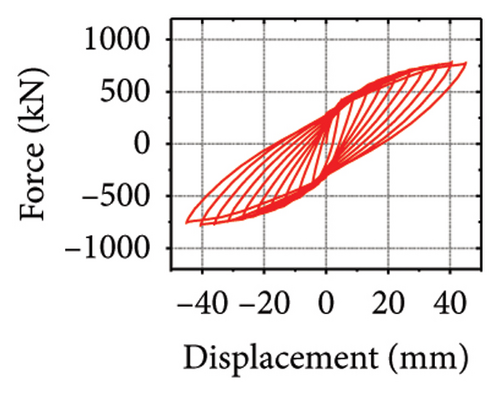
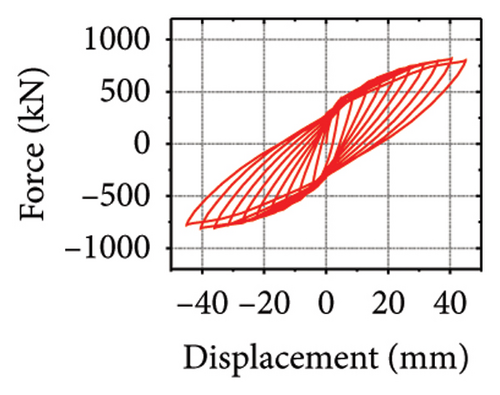
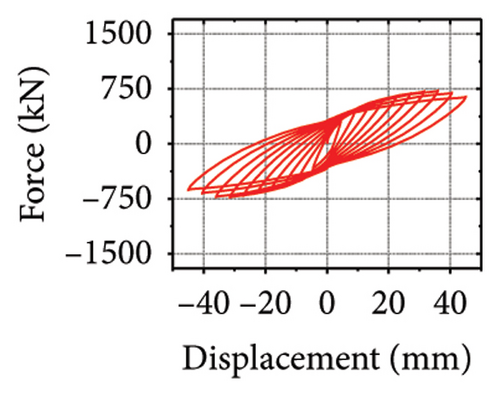
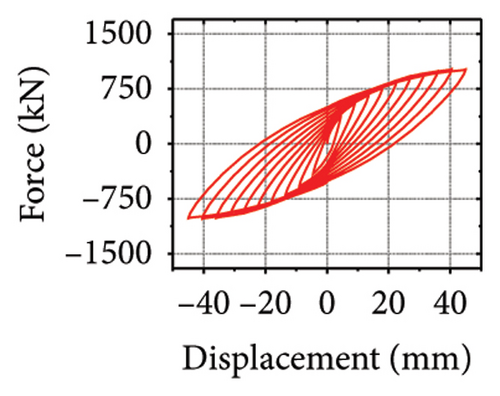
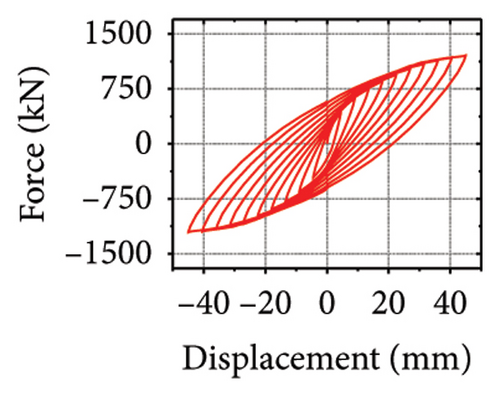
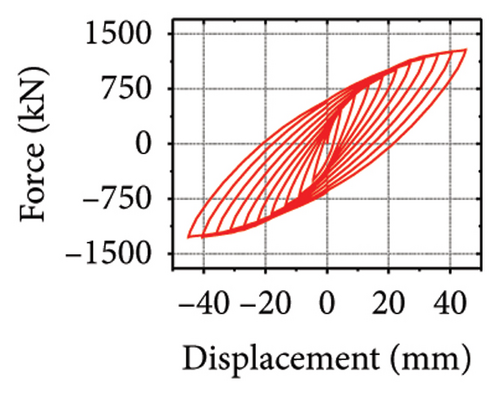
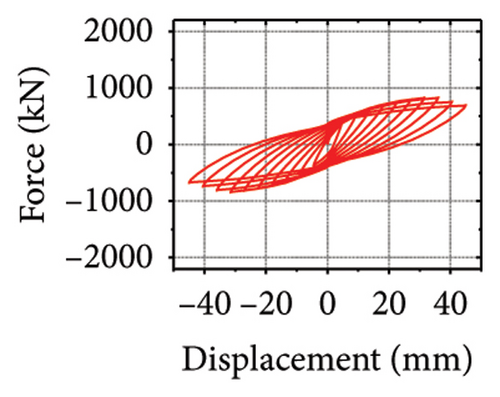
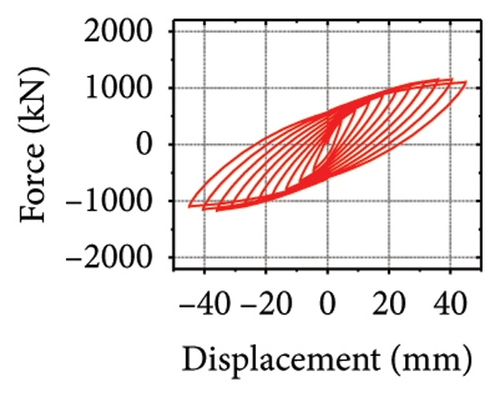
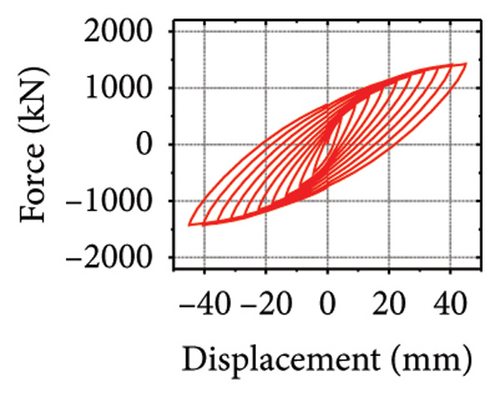
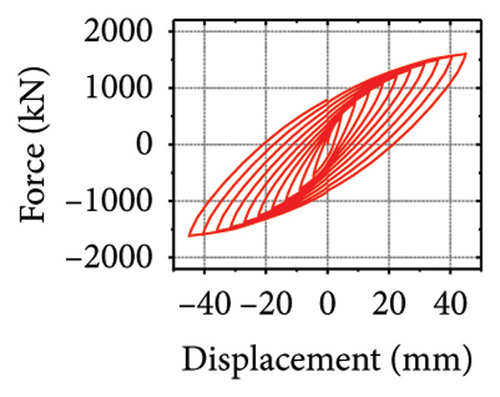
The specimen stiffness values and simulation results are summarized in Table 2. Taking the specimen with a corrugated plate thickness of 1 mm as an example, as the damper web thickness increased from 6 to 24 mm, the energy dissipation of the damper decreased from 59.7 to 39.7 kJ. However, the energy dissipation of the corrugated plate increased from 31.1 to 69.3 kJ. Moreover, the energy dissipation of the concrete increased from 13.8 to 21.7 kJ, indicating that the damper restrained the wall body. As the damper web thickness increased, the restraint was enhanced, which promoted the energy dissipation of the wall. However, the energy-dissipation efficiency of the damper decreased. Nevertheless, it is difficult to effectively protect the main structure from damage.
| Specimen | Stiffness (kN/mm) | Stiffness ratio (%) | Ultimate force (kN) | Energy dissipation (kJ) | |||||||
|---|---|---|---|---|---|---|---|---|---|---|---|
| Kh−dam | Kv−dam | Kh−cd | Kwal | rh−cdw | rv−dw | P | Econ | Edam | Epla | Ecol | |
| 2-1-1-dt6-15 | 48.9 | 273.9 | 4.5 | 438.0 | 1.0 | 62.5 | 591.0 | 13.8 | 59.7 | 31.1 | 9.0 |
| 2-1-1-dt12-15 | 98.3 | 546.8 | 4.7 | 438.0 | 1.1 | 124.9 | 725.7 | 18.7 | 53.7 | 52.1 | 16.5 |
| 2-1-1-dt18-15 | 146.1 | 811.9 | 4.7 | 438.0 | 1.1 | 185.4 | 781.7 | 20.7 | 44.9 | 63.3 | 20.9 |
| 2-1-1-dt24-15 | 191.8 | 1068.8 | 4.8 | 438.0 | 1.1 | 244.0 | 818.9 | 21.7 | 39.7 | 69.3 | 24.1 |
| 2-1-3-dt6-15 | 48.9 | 273.9 | 4.5 | 487.7 | 0.9 | 56.2 | 724.0 | 10.0 | 95.9 | 48.6 | 8.2 |
| 2-1-3-dt12-15 | 98.3 | 546.8 | 4.7 | 487.7 | 1.0 | 112.1 | 1019.9 | 14.2 | 118.1 | 68.9 | 21.2 |
| 2-1-3-dt18-15 | 146.1 | 811.9 | 4.7 | 487.7 | 1.0 | 166.5 | 1206.1 | 17.4 | 101.2 | 95.9 | 32.2 |
| 2-1-3-dt24-15 | 191.8 | 1068.8 | 4.8 | 487.7 | 1.0 | 219.2 | 1284.6 | 19.2 | 84.3 | 118.0 | 40.0 |
| 2-1-5-dt6-15 | 48.9 | 273.9 | 4.5 | 529.8 | 0.8 | 51.7 | 828.5 | 9.3 | 103.0 | 70.9 | 9.2 |
| 2-1-5-dt12-15 | 98.3 | 546.8 | 4.7 | 529.8 | 0.9 | 103.2 | 1155.2 | 12.4 | 146.8 | 83.8 | 23.9 |
| 2-1-5-dt18-15 | 146.1 | 811.9 | 4.7 | 529.8 | 0.9 | 153.2 | 1427.9 | 14.7 | 145.0 | 101.5 | 40.0 |
| 2-1-5-dt24-15 | 191.8 | 1068.8 | 4.8 | 529.8 | 0.9 | 201.7 | 1606.9 | 16.4 | 128.6 | 120.4 | 55.3 |
- Note: Kh−dam and Kv−dam are the horizontal and vertical stiffnesses, respectively. Kh−cd is the horizontal stiffness of the restraint combination. Kwal is the stiffness of the shear wall. rh−cdw is the horizontal stiffness ratio of the entire wall. rv−dw is the stiffness ratio of the damper to the wall. Econ, Edam, Epla, and Ecol are the energy-dissipation values of the concrete, damper, steel plate, and restraint column, respectively.
4.3. Coupling Effect of the Constraint Column Thickness and Damper Web Thickness
- (i)
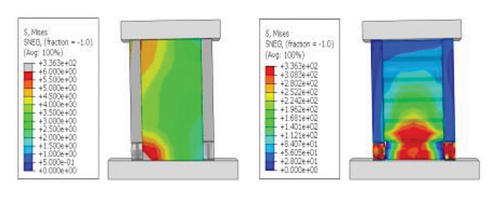
Damper failure mode: When the stiffness of the damper is insufficient, the deformation is mainly concentrated on the damper. However, the damper cannot provide sufficient restraint. The energy dissipation of the structure is not ideal; however, under this failure mode, damage is concentrated on the damper, as shown in Figure 19(a).
- (ii)
Comprehensive failure mode: As the damper web thickness increases, the energy dissipation of the damper further improves, and the wall body deformation is limited by the constraint combination. Under this energy-dissipation mechanism, the structure can simultaneously achieve the goals of damage concentration and energy dissipation improvement, as shown in Figure 19(b).
- (iii)
Constraint column failure mode: When the shear stiffness of the damper is significantly larger than that of the constraint column, the damper is hardly deformed, as shown in Figure 19(c). This failure mode does not affect the energy-dissipation capacity of the damper, and damage is not concentrated on the damper. This situation should be avoided in the design phase.
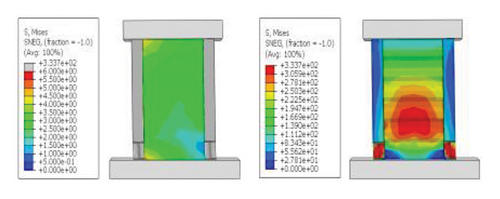
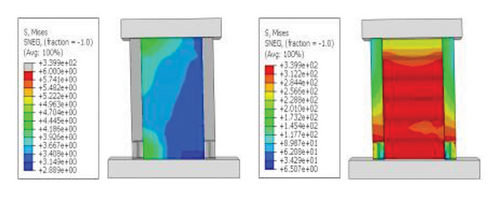
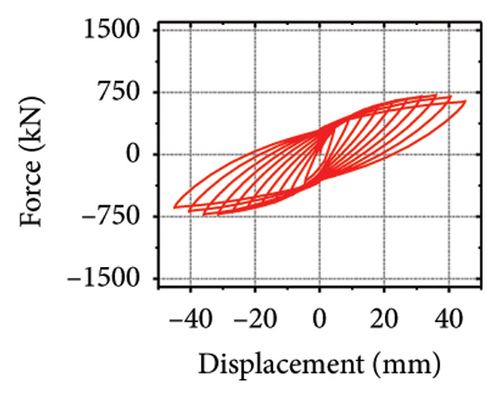
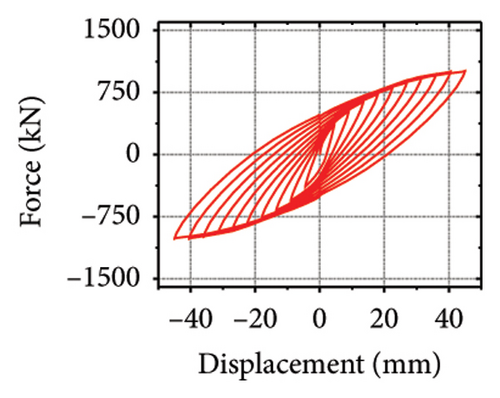
The hysteresis curves of the specimens are shown in Figure 20. For a damper web thickness of 6 mm, the peak load of the replaceable shear wall was not significantly improved by changing the cross-sectional area of the constrained column. For example, the peak loads of specimens 2-1-3-dt6-10 and 2-1-3-dt6-30 were 721.1 and 755.0 kN, respectively, indicating that the seismic performance of the damper was not ideal. Deformation was fully provided by the damper. For damper web thicknesses greater than 12 mm, the peak load changed to a certain extent as the constraint column section size increased, which reflects an improvement in the synergistic effect between the damper and the constraint column. For all specimens, part of the hysteretic curves exhibit a descending phase. The main reason for this could be that the damper experienced severe buckling failure, resulting in a gradual loss of lateral load resistance.
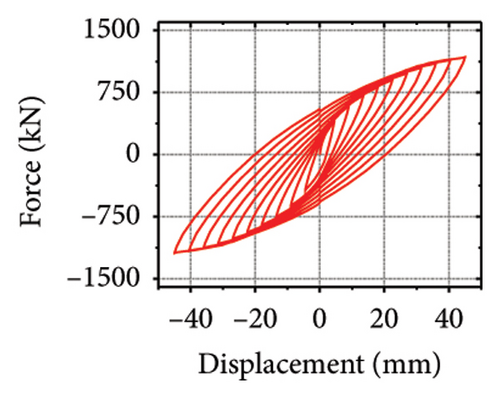
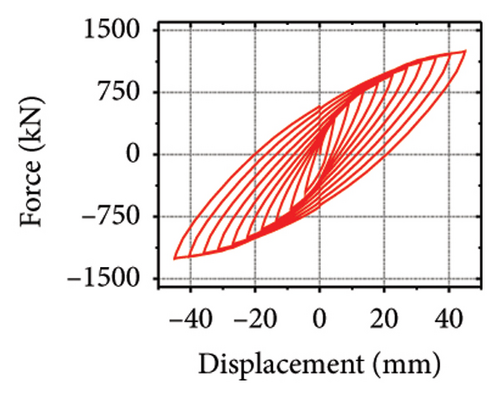
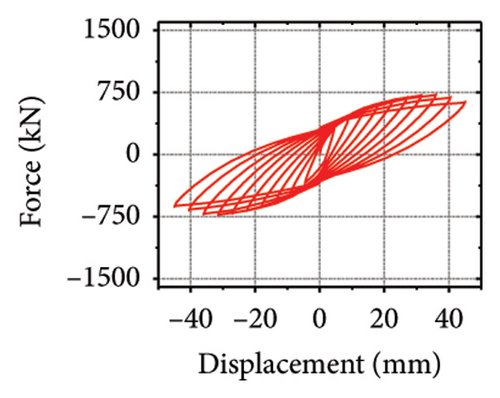
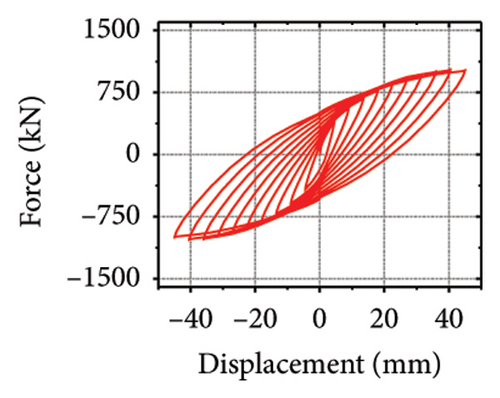
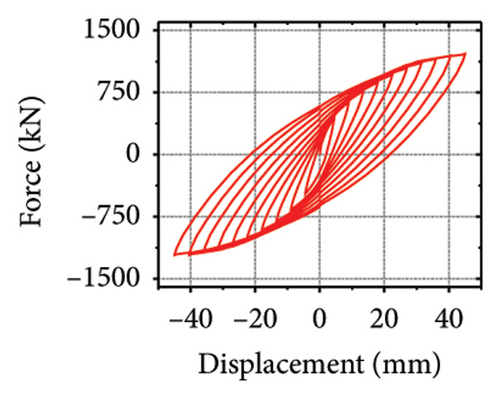
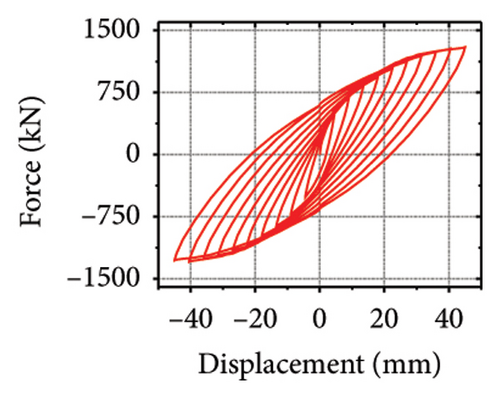
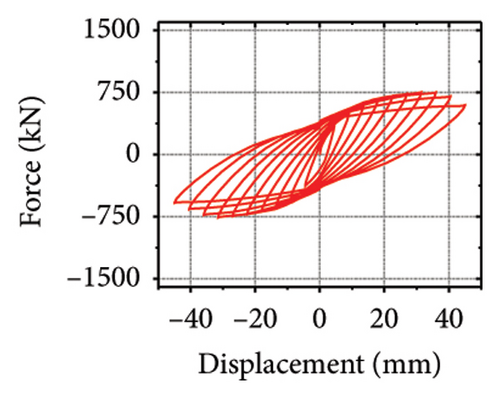
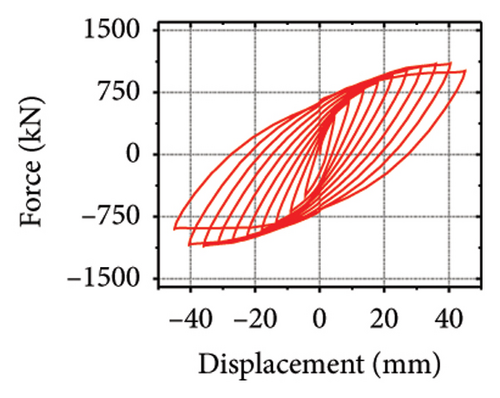
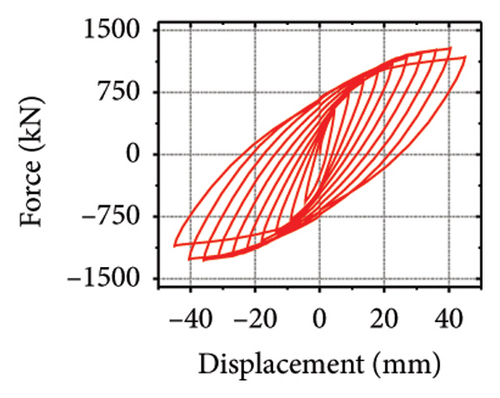
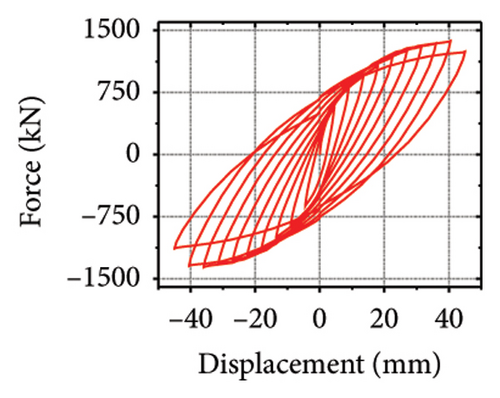
The stiffness ratios and calculated values for all specimens are listed in Table 3. Combined with the failure modes described above, the stiffness relationship between the damper and constraint column can be summarized. The structural features corresponding to different horizontal stiffness ratios are proposed next. Let us define rh−cd as the lateral stiffness ratio of the constrained column to that of the damper. When rh−cd is greater than 5%, the constraint column has sufficient constraint capacity and almost no energy dissipation. When rh−cd is in the range of 2%–5%, the damper and constraint column are both deformed, and the energy dissipation is mainly concentrated on the damper. When rh−cd is less than 2%, the damper stiffness is high, and the restraint capacity of the column is far from sufficient. The damper is barely deformed, and a pronounced bending deformation occurs in the constraint column.
| Specimen | Stiffness (kN/mm) | Stiffness ratio (%) | Ultimate force (kN) | Energy dissipation (kJ) | |||||||
|---|---|---|---|---|---|---|---|---|---|---|---|
| Kh−dam | Kv−col | Kh−cd | Kwal | rh−cd | rh−cdw | P | Econ | Edam | Epla | Ecol | |
| 2-1-3-dt6-10 | 48.9 | 3.5 | 3.3 | 487.7 | 7.2 | 0.7 | 721.1 | 10.2 | 89.1 | 47.0 | 11.6 |
| 2-1-3-dt12-10 | 98.3 | 3.5 | 3.4 | 487.7 | 3.6 | 0.7 | 1010.0 | 14.2 | 102.2 | 63.7 | 28.6 |
| 2-1-3-dt18-10 | 146.1 | 3.5 | 3.4 | 487.7 | 2.4 | 0.7 | 1178.4 | 16.7 | 84.9 | 83.6 | 44.1 |
| 2-1-3-dt24-10 | 191.8 | 3.5 | 3.4 | 487.7 | 1.8 | 0.7 | 1249.6 | 18.0 | 70.3 | 98.9 | 55.9 |
| 2-1-3-dt6-20 | 48.9 | 6.1 | 5.4 | 487.7 | 12.5 | 1.1 | 725.1 | 9.8 | 99.3 | 49.2 | 6.3 |
| 2-1-3-dt12-20 | 98.3 | 6.1 | 5.7 | 487.7 | 6.2 | 1.2 | 1025.6 | 14.2 | 126.6 | 71.2 | 17.6 |
| 2-1-3-dt18-20 | 146.1 | 6.1 | 5.9 | 487.7 | 4.2 | 1.2 | 1217.8 | 17.6 | 110.1 | 101.4 | 27.4 |
| 2-1-3-dt24-20 | 191.8 | 6.1 | 5.9 | 487.7 | 3.2 | 1.2 | 1298.6 | 19.6 | 92.0 | 126.6 | 34.3 |
| 2-1-3-dt6-30 | 48.9 | 8.0 | 6.9 | 487.7 | 16.4 | 1.4 | 755.0 | 10.0 | 140.5 | 52.7 | 3.7 |
| 2-1-3-dt12-30 | 98.3 | 8.0 | 7.4 | 487.7 | 8.1 | 1.5 | 1102.5 | 15.8 | 180.2 | 91.9 | 14.7 |
| 2-1-3-dt18-30 | 146.1 | 8.0 | 7.6 | 487.7 | 5.5 | 1.6 | 1287.4 | 20.1 | 142.0 | 140.3 | 25.3 |
| 2-1-3-dt24-30 | 191.8 | 8.0 | 7.7 | 487.7 | 4.2 | 1.6 | 1373.7 | 23.0 | 108.1 | 179.5 | 32.7 |
- Note: Kh−dam and Kv−col are the horizontal and vertical stiffnesses, respectively. Kh−cd is the horizontal stiffness of the restraint combination. Kwal is the stiffness of the shear wall. rh−cd is the stiffness ratio of the restraint column to that of the damper. rh−cdw is the horizontal stiffness ratio of the entire wall. Econ, Edam, Epla, and Ecol are the energy-dissipation values of the concrete, damper, steel plate, and restraint column, respectively.
5. Interaction Relationship Analysis
5.1. Coupling Effect of the Wall Aspect Ratio and Damper Web Thickness
The damper and shear wall combination formed a double energy-dissipation defense line in which the damper failed before the wall body. The damper and wall body worked together successfully during the elastic stage. After entering the plastic phase, the stress on the replaceable wall is concentrated on the damper, which dissipates energy via plastic deformation to protect the wall body. The functional recoverability of the shear wall with replaceable dampers was significantly improved compared to that of traditional shear wall structures. However, under seismic action, the damper and wall body exhibit two distinct force forms, and the damper mainly relies on tensile and compressive deformations for plastic energy dissipation. When the damper is damaged or fails, the constraint combination loses its ability to restrain. Subsequently, the bearing capacity of the wall body is significantly reduced, and the wall body dissipates energy through bending and shear deformation. It could be concluded that the wall did not fail immediately even if the plastic hinge was generated at the corner of the wall.
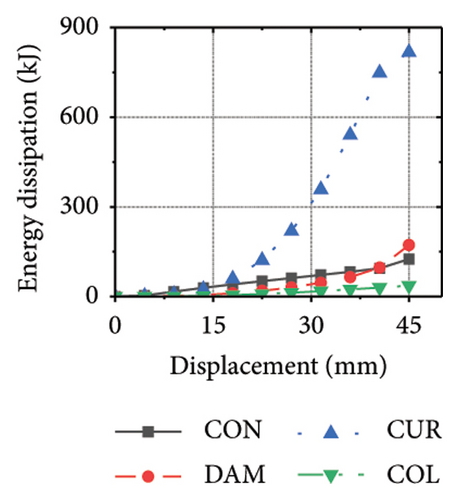
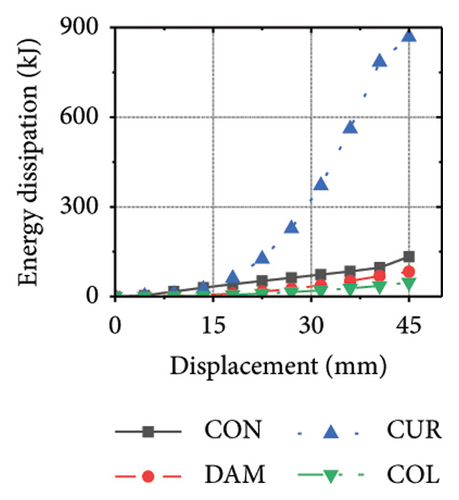
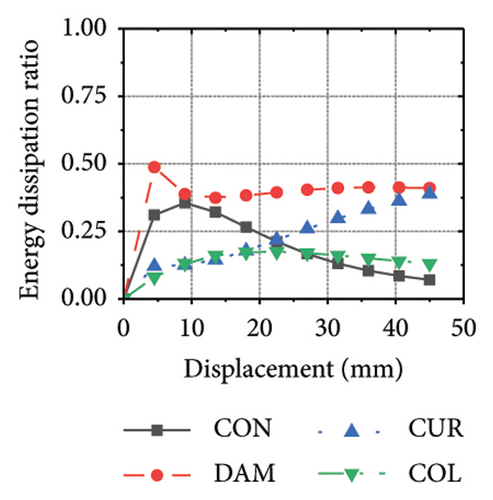
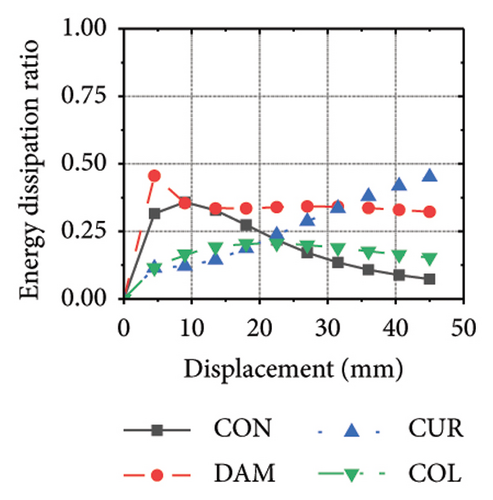
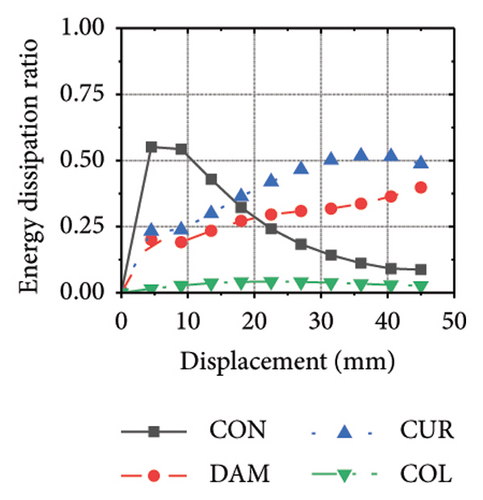
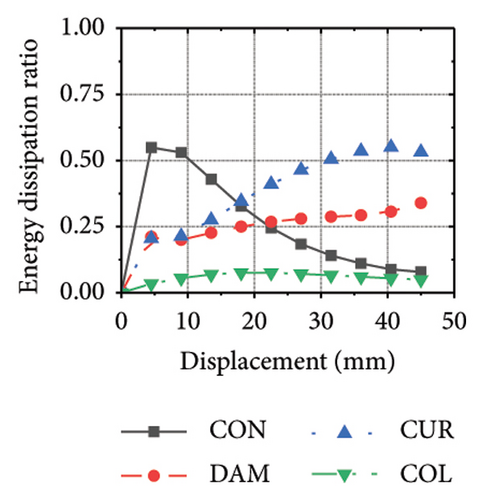
Figure 21 shows the energy-dissipation process of the specimens under different wall aspect ratios and damper web thicknesses. Based on these results, the following conclusions can be drawn. (i) In specimens with the same aspect ratio, the energy dissipation of concrete was almost unaffected by the seismic performance of the damper, whereas the energy dissipation of the corrugated plate changed as the restraint capacity of the damper changed. For example, for an aspect ratio of 1:2, as the damper web thickness increased from 6 to 24 mm, the energy dissipation of the corrugated plate increased from 578.1 to 868.5 kJ. (ii) When the damper web thickness was less than 12 mm, the energy dissipation continued to increase. When the dissipating-plate thickness was greater than 12 mm, the energy dissipation of the damper began to decrease. (iii) For a damper web thickness of 30 mm, the four main components exhibited obvious energy dissipation, where the constraint column exhibited lateral deformation owing to its insufficient restraint ability. (iv) Conversely, the wall aspect ratio had a significant impact on the energy-dissipation ratio between the damper and corrugated plate. When the aspect ratio was low, the energy dissipation of the damper was significantly lower than that of the corrugated plate, indicating that it was difficult for the damper to protect the wall from damage.
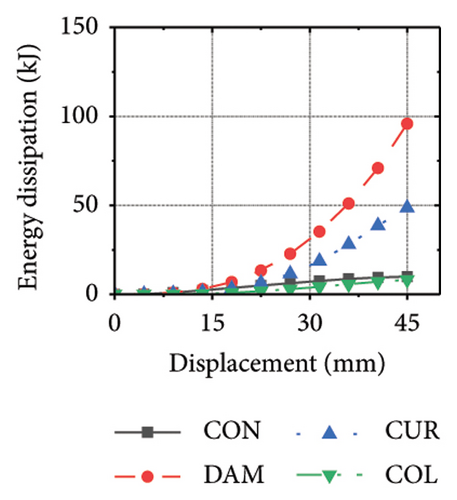
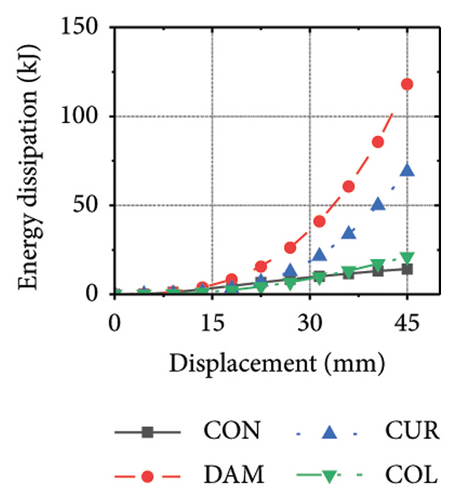
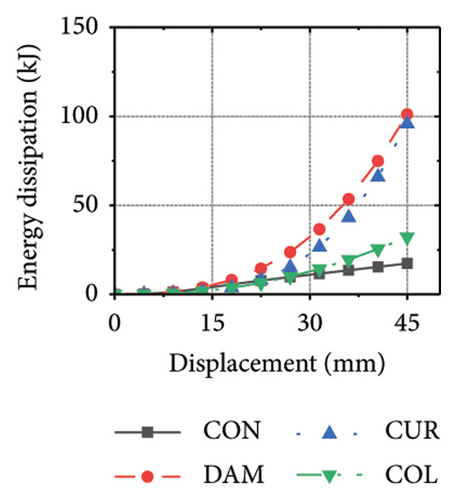
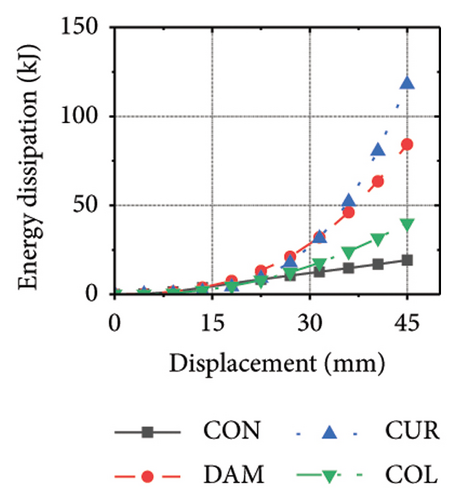
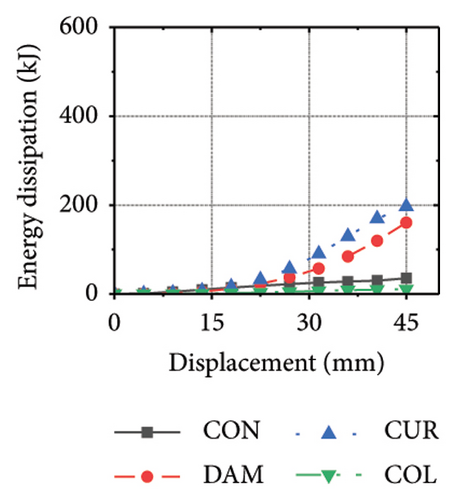
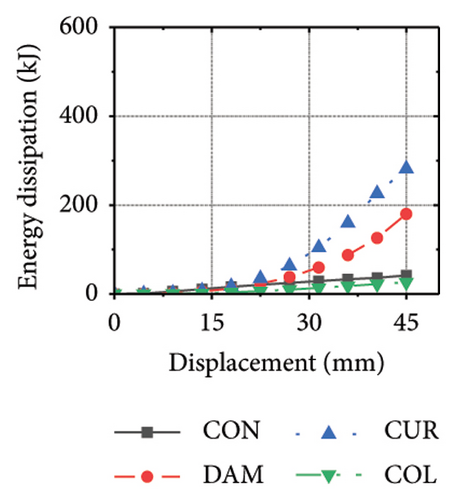
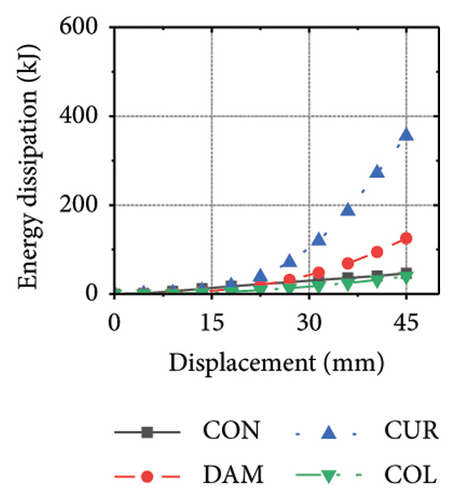
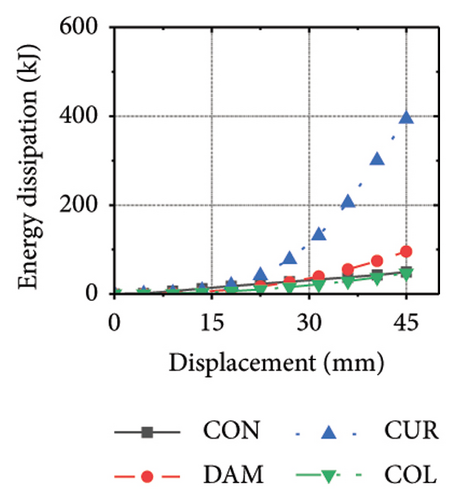
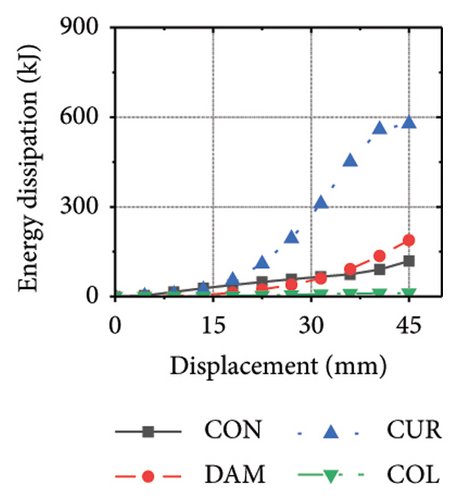
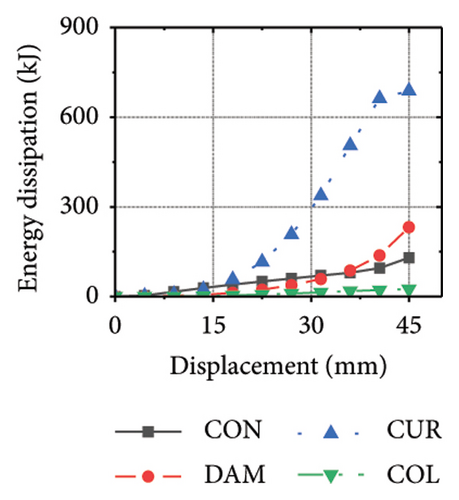
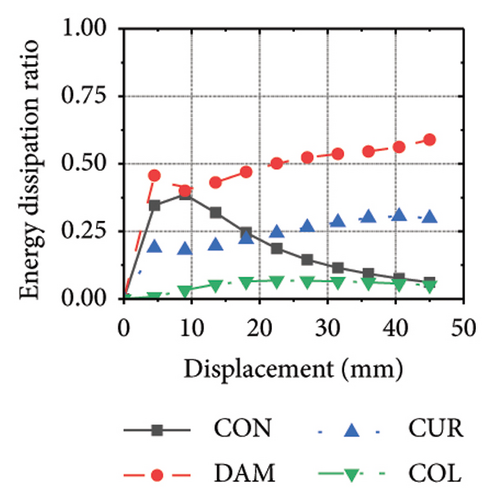
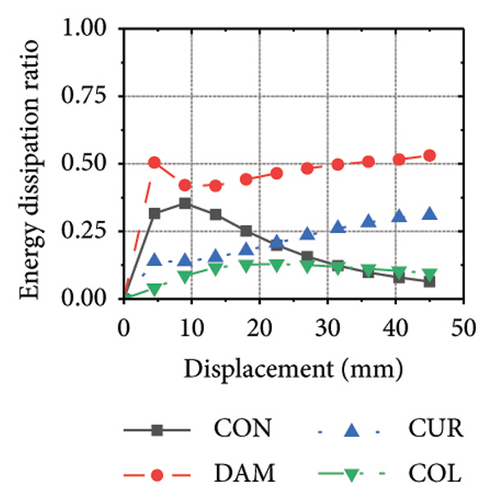
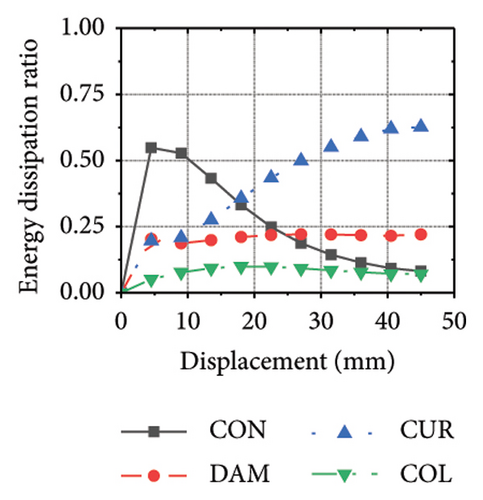
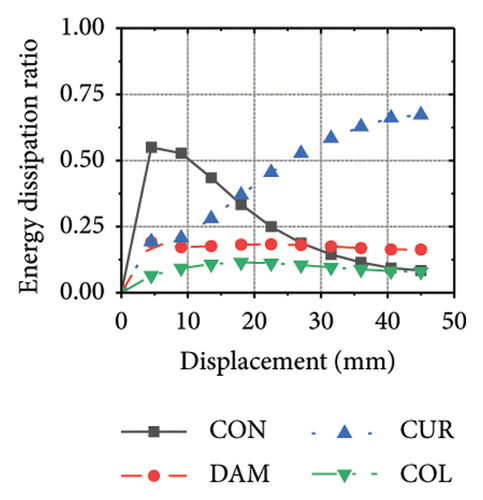
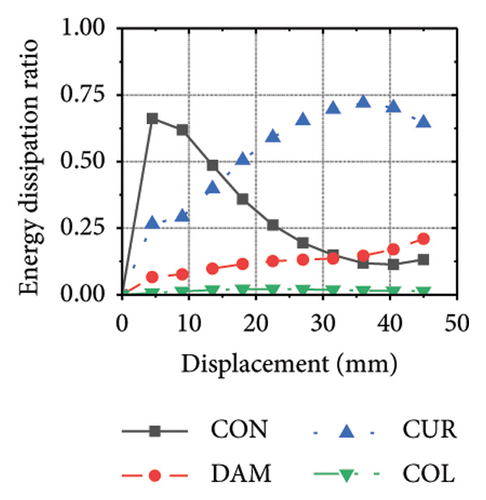
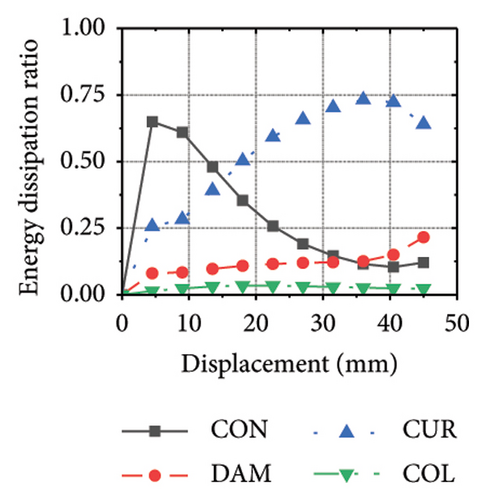
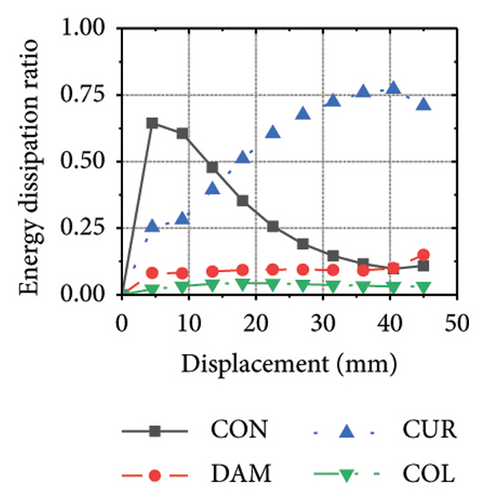
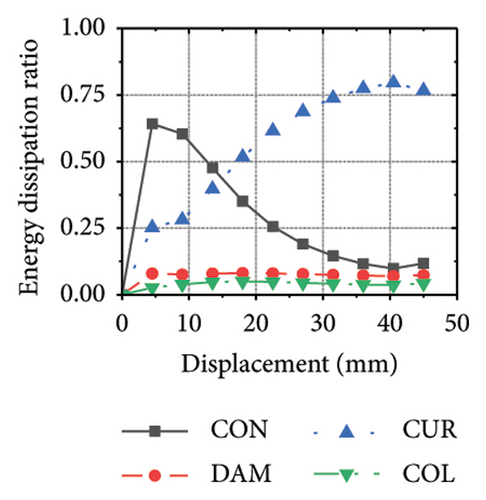
The energy-dissipation process of the specimens was converted into a proportional energy-dissipation process, as shown in Figure 22. As the damper was made of mild steel, it entered the plastic energy-dissipation phase at an early stage in specimens with high aspect ratios. During the early loading stages, the damper and concrete primarily contributed to the energy dissipation of the RSW. When the damper web thickness was small, a large deformation occurred during the energy dissipation of the corrugated plate, leading to a significant reduction in the energy dissipation of the damper. However, for specimens with low wall aspect ratios, the energy-dissipation ratio was unsatisfactory because the toe damper was difficult to deform. The main objective is to increase the energy-dissipation ratio of the damper throughout the loading process. The damper of specimen 1-2-dt24-15 had an energy-dissipation ratio of 8.1%, which was the lowest among all specimens. The embedded corrugated plate exhibited an energy-dissipation ratio of 79.6%. It could be inferred that the damper design parameter was not justified, which made it difficult to achieve the functional restorability of the wall.
5.2. Coupling Effect of the Corrugated Plate Thickness and Damper Web Thickness
This section focuses on the coupling effect of the corrugated plate and damper web thicknesses on the energy-dissipation process of the replaceable shear wall, as shown in Figure 23. For the specimen with a corrugated plate thickness of 1 mm, when the damper web thickness was 6 mm, the final energy-dissipation values of the corrugated plate and damper were 31.1 and 59.7 kJ, respectively. When the damper web thickness increased to 12 mm, the final energy dissipation of the corrugated plate and damper were 52.1 and 53.7 kJ, respectively. This indicates that the damper provides the necessary restraint for the deformation of the corrugated plate. The 6 mm-thick damper web was insufficient to fully restrain the 1 mm corrugated plate. During the loading process, the damper prematurely underwent a large deformation and lost its ability to restrain, making it difficult for the corrugated plate to fully exploit its energy-dissipation capacity. The main factor limiting the energy-dissipation capacity of this type of the replaceable shear wall is the seismic performance of the damper. As the damper web cross-sectional thickness continued to increase, the energy-dissipation values of the corrugated plate and damper for specimen 2-1-1-dt24-15 were 69.3 and 39.7 kJ, respectively. The energy dissipation of the corrugated plate and damper increased further; however, that of the damper would decrease, indicating that the seismic performance of the damper was not fully developed. It was also difficult to concentrate the stress on the damper; in other words, the energy-dissipation interaction relationship was not ideal.
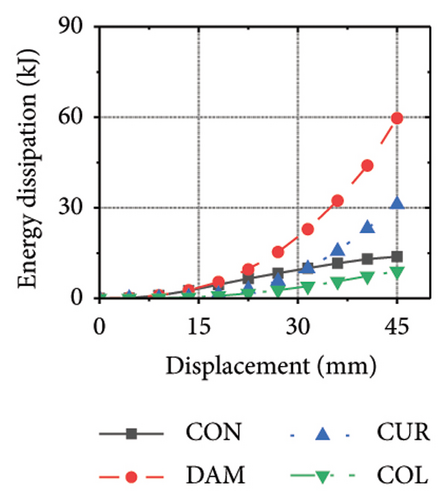

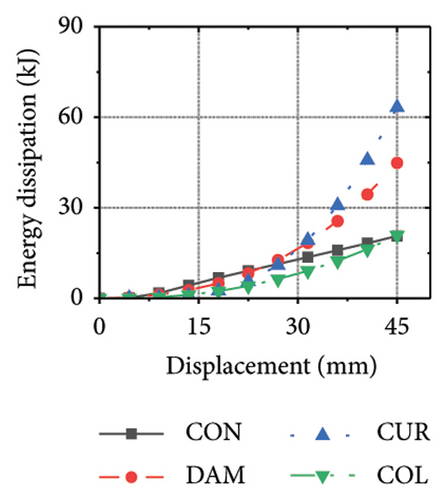
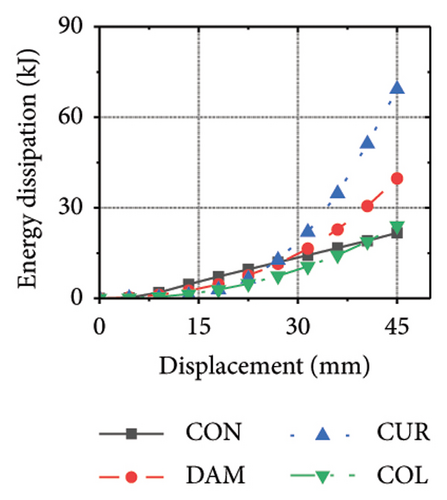
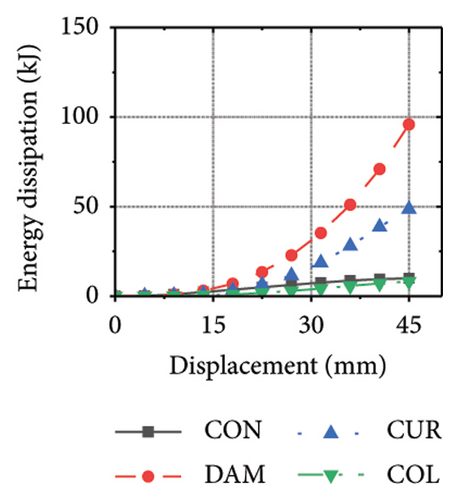
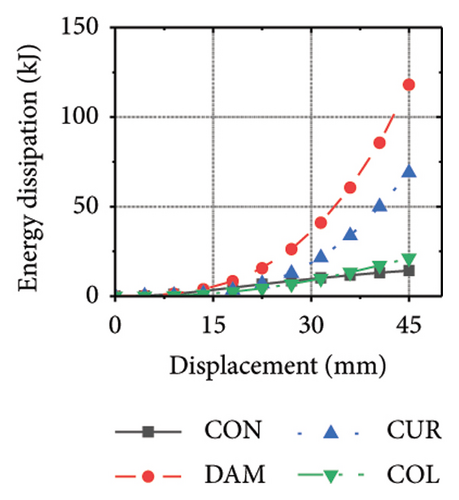
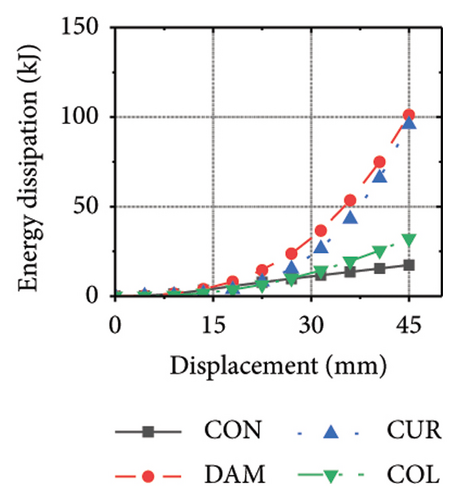
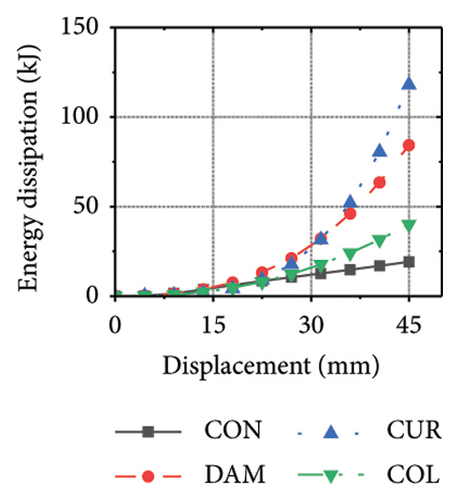
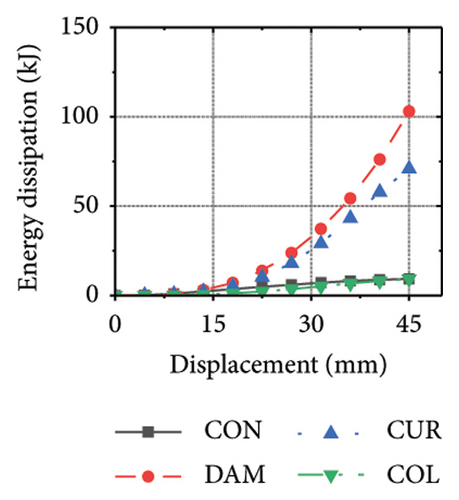
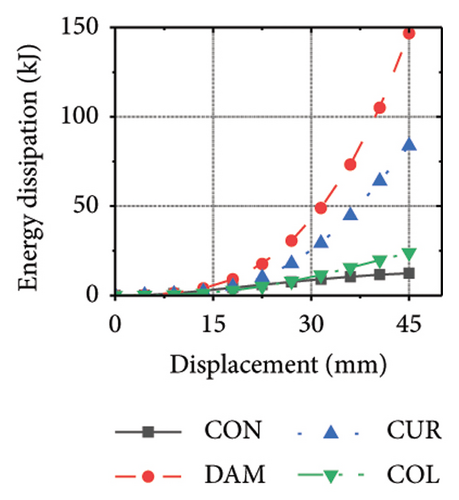

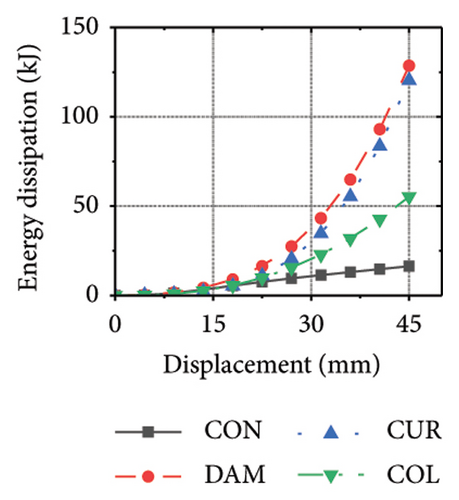
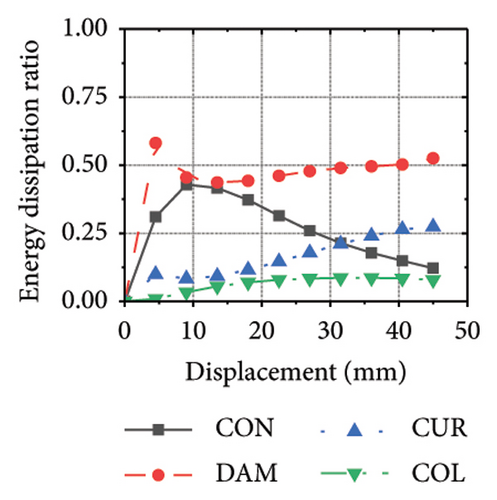
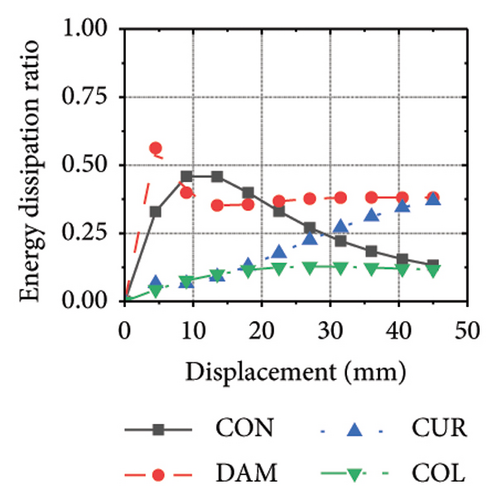
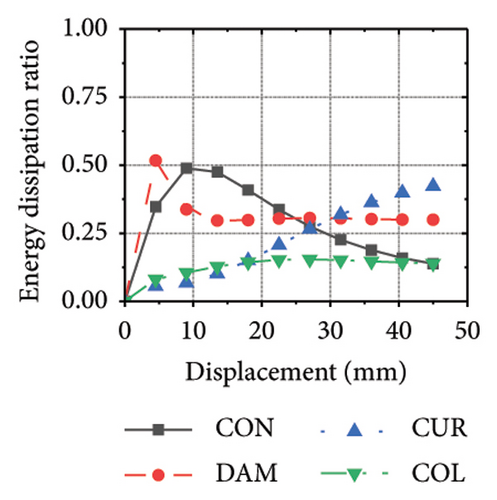
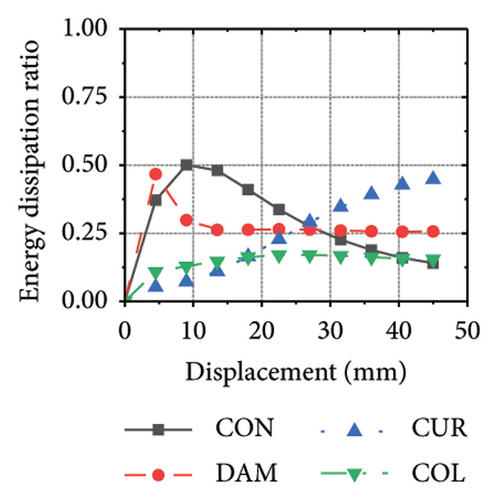
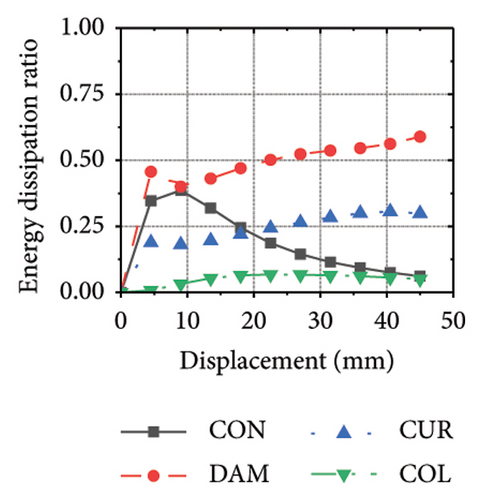
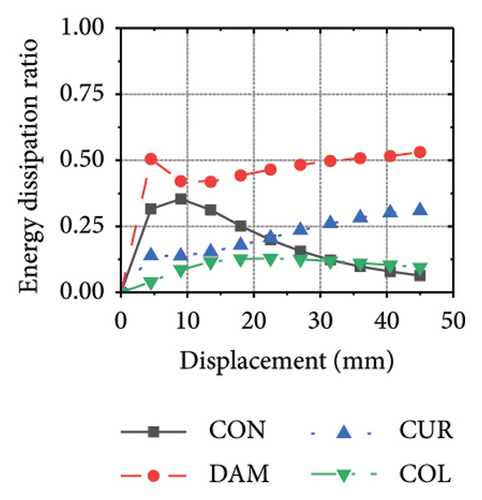
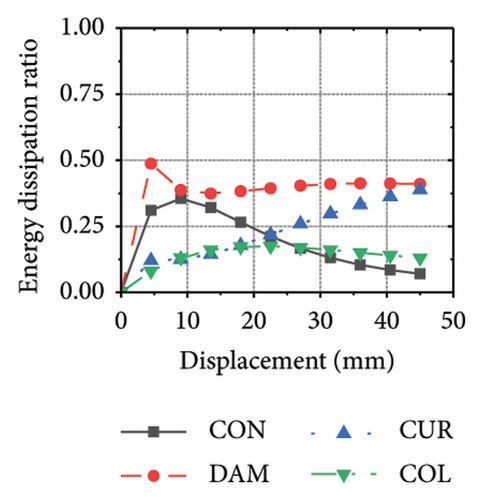
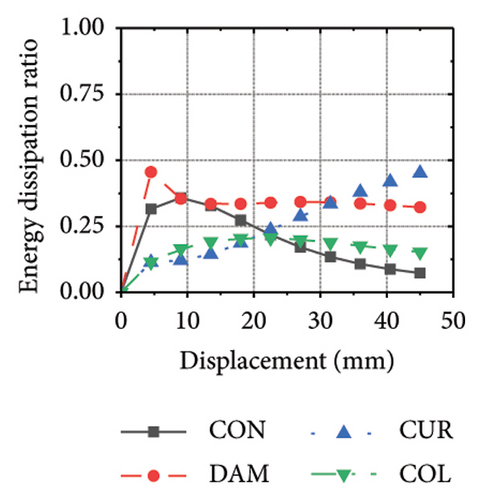
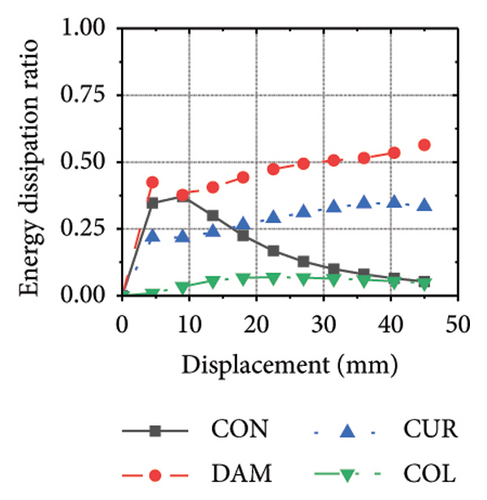
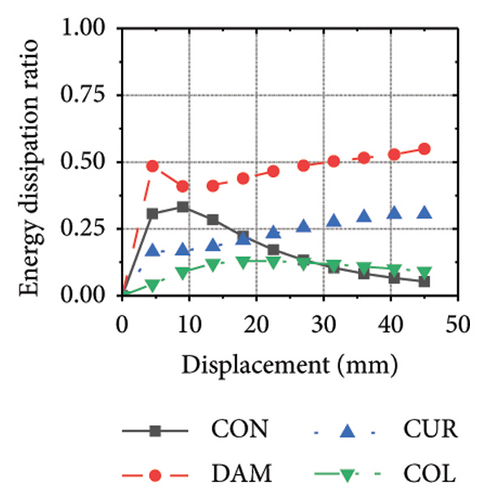
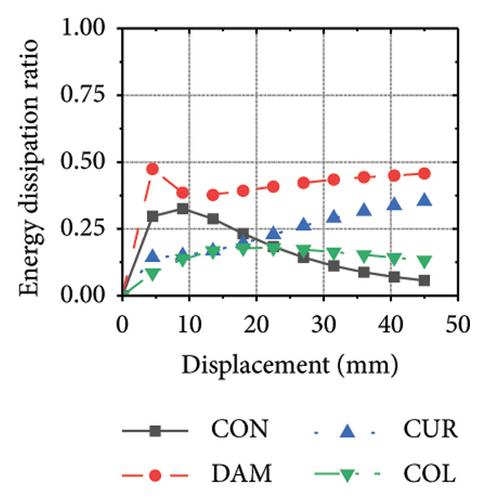
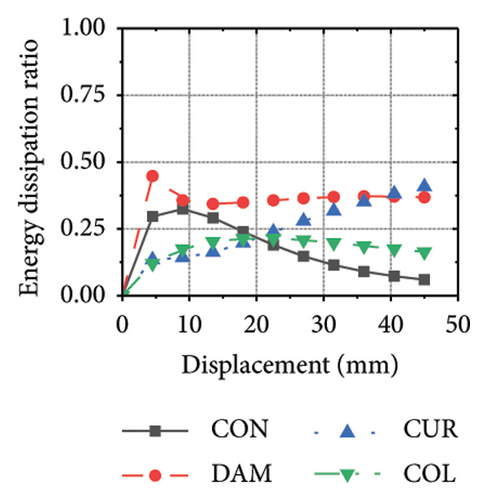
Figure 24 shows the coupling effect of the corrugated plate and damper web thicknesses on the energy-dissipation ratio. For corrugated plates of the same thickness, the energy-dissipation ratio increased with the damper web thickness during the loading process. By contrast, the energy-dissipation ratio of the damper decreased with an improvement in its seismic performance. For example, the final damper energy-dissipation ratio for specimen 2-1-1-dt6-15 was 52.6%, while that for specimen 2-1-1-dt24-15 was 25.7%. We found that damper web thickness changes are positively correlated with the energy-dissipation ratio of the corrugated plate and negatively correlated with that of the damper itself. To fully exploit the energy-dissipation capacity of the wall body, it is necessary to improve the restraint capacity of the damper. However, this makes it difficult for the damper to achieve the ideal energy dissipation.
5.3. Coupling Effect of the Constraint Column Thickness and Damper Web Thickness
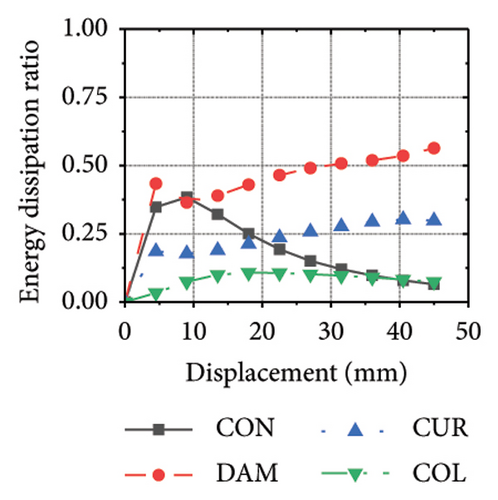
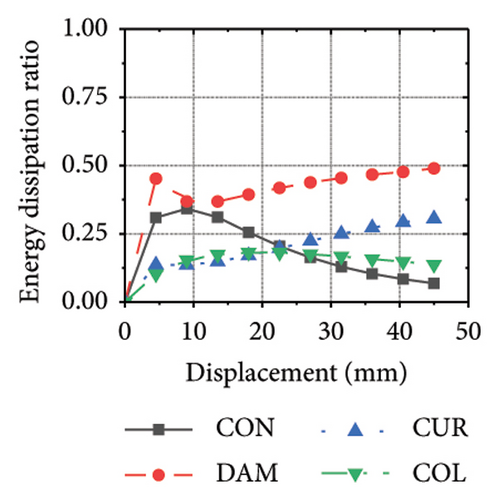
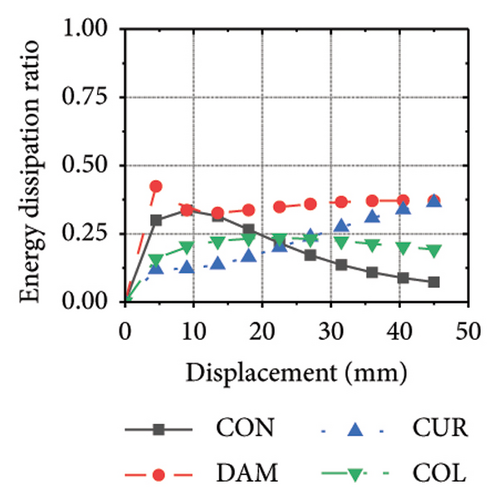
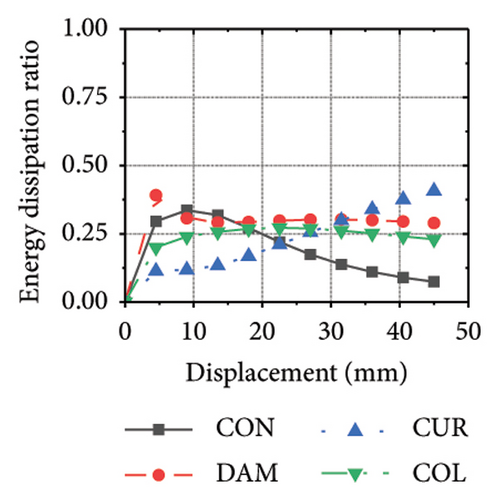
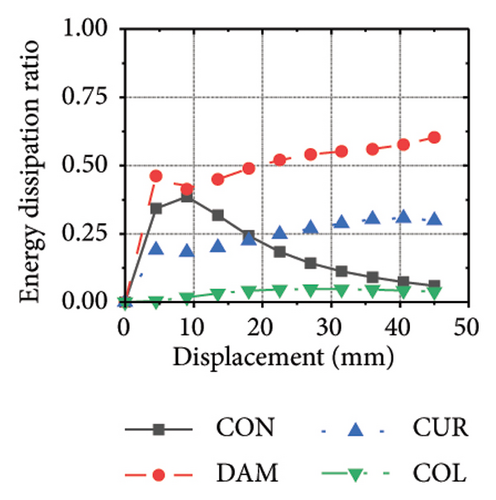
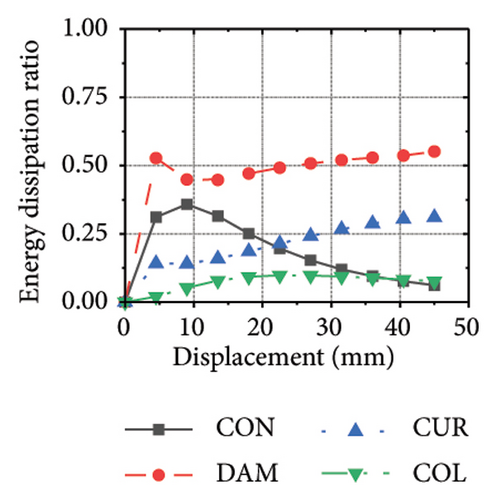
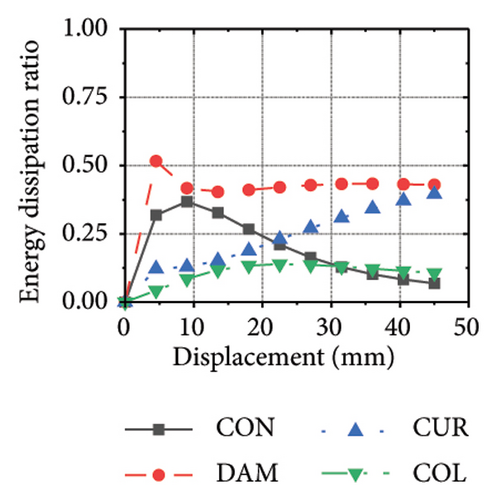
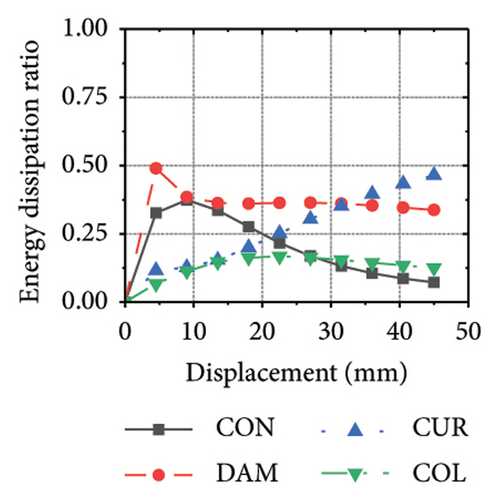
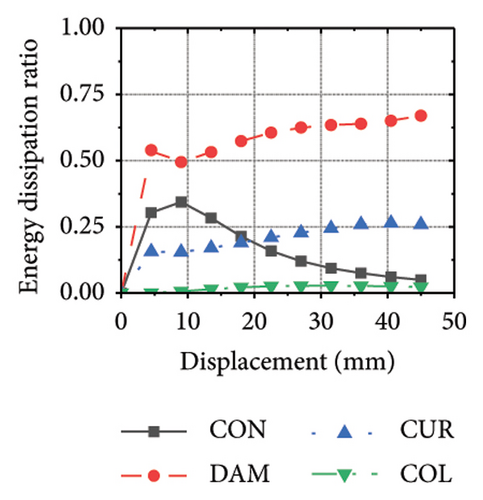
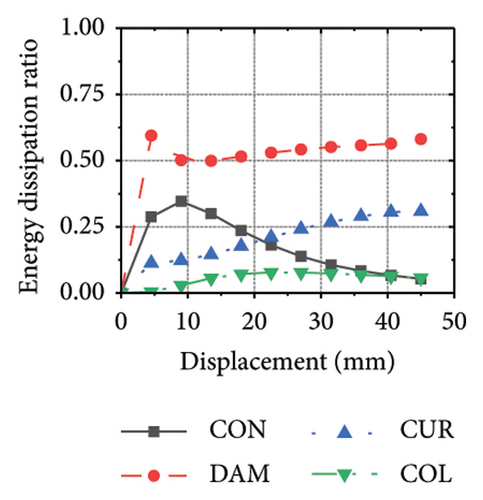
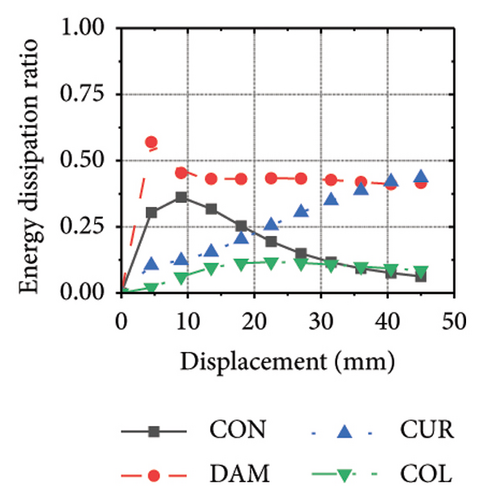
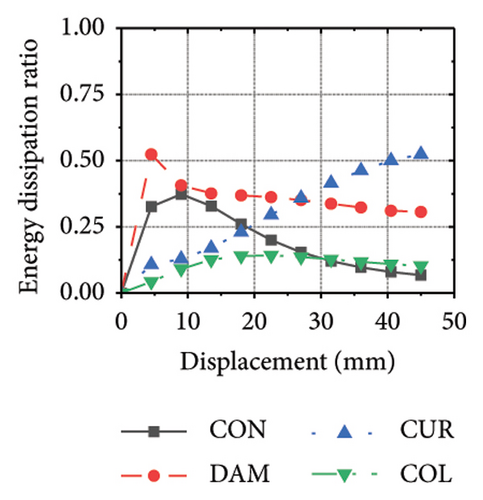
Figure 25 shows the energy-dissipation process curves for each specimen component for different constraint column and damper web thickness combinations. Because the main function of the constraint column in the replaceable shear wall is to facilitate the deformation and energy dissipation of the wall body and damper, it is not necessary to concentrate the damage on the constraint column, and it should have sufficient restraint capability. Based on the energy-dissipation results, the constraint column affected the energy dissipation of the corrugated plate and damper. For example, the energy-dissipation values of the corrugated plate for specimens 2-1-3-dt24-10 and 2-1-3-dt24-30 were 98.9 and 179.5 kJ, respectively, which is only a slight increase. The energy-dissipation values of the damper were 70.3 and 108.1 kJ, respectively, an increase of only 37.8 kJ. It should be noted that the energy dissipation of the corrugated plate increased because the seismic performance of the constraint column was insufficient to restrain the deformation of the damper and corrugated plate. In other words, the constraint column limited the energy dissipation of the replaceable shear wall; therefore, increasing the cross-sectional area of the constraint column could effectively improve the structural energy dissipation. Conversely, for specimens 2-1-3-dt6-10 and 2-1-3-dt6-30, the main factor limiting the energy dissipation of the wall was the damper; therefore, it was difficult to effectively improve the energy dissipation of the main wall by increasing the cross-sectional size of the restraint column (the energy-dissipation values were 47.0 and 52.7 kJ, respectively).
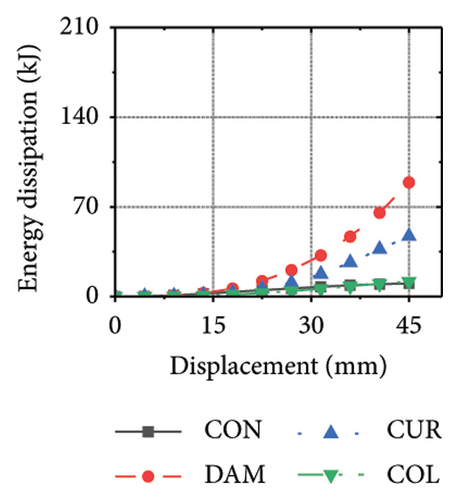
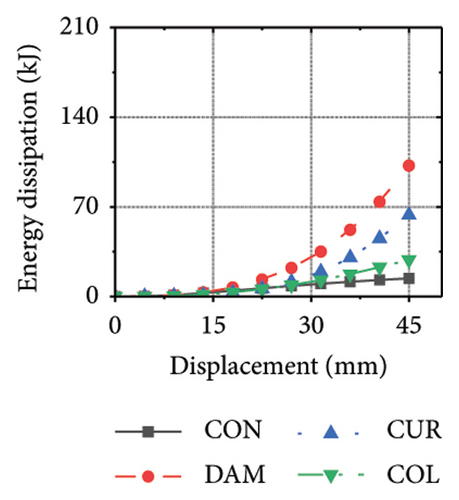
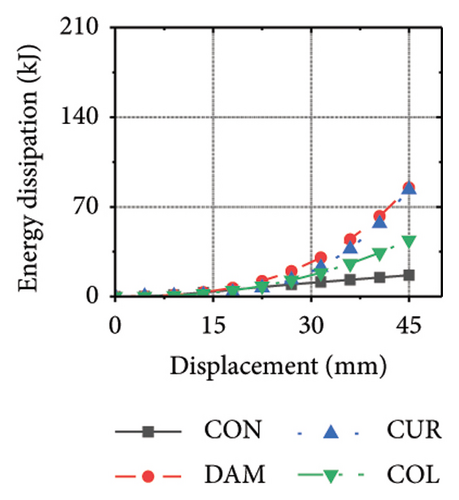
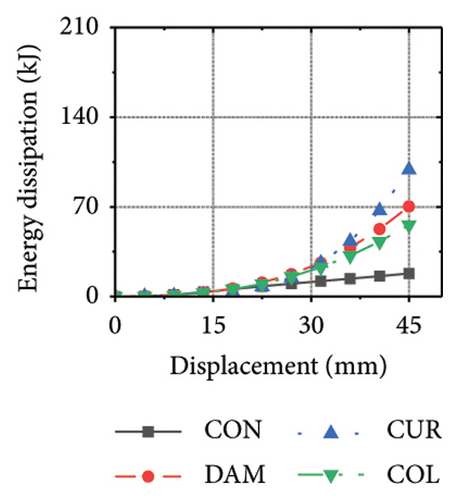
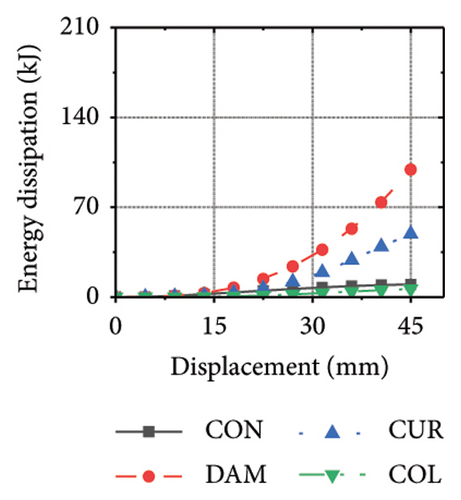
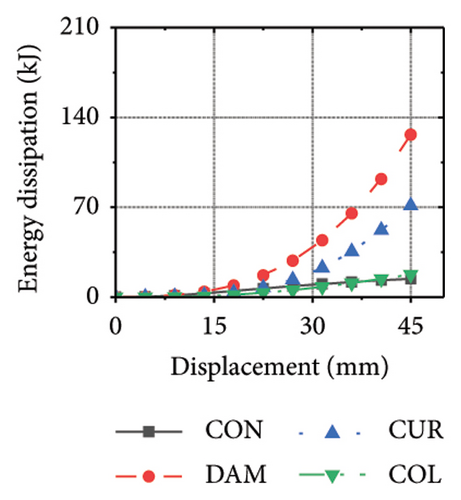
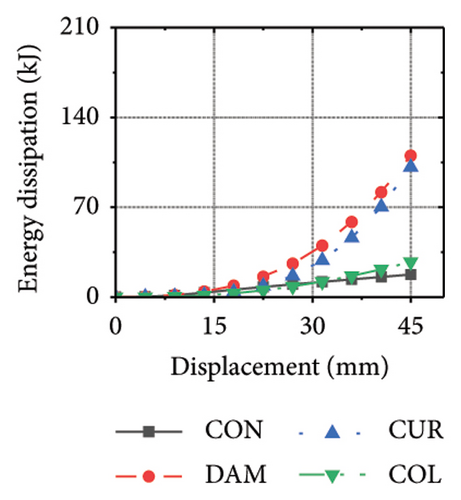
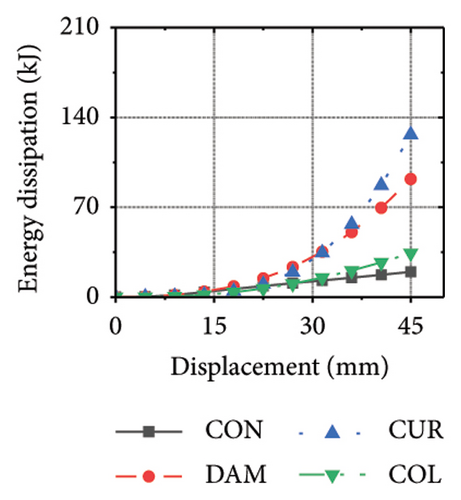
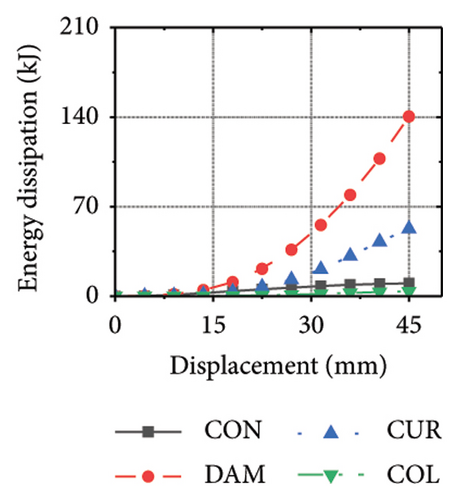
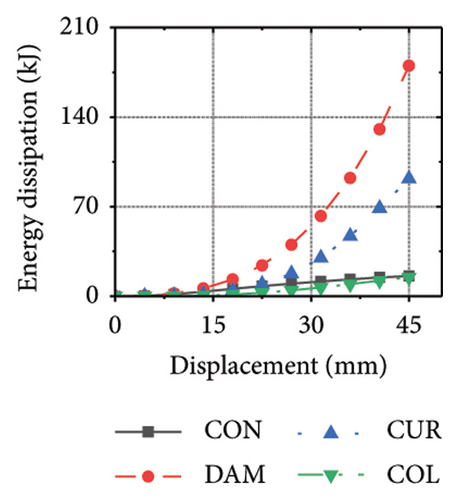
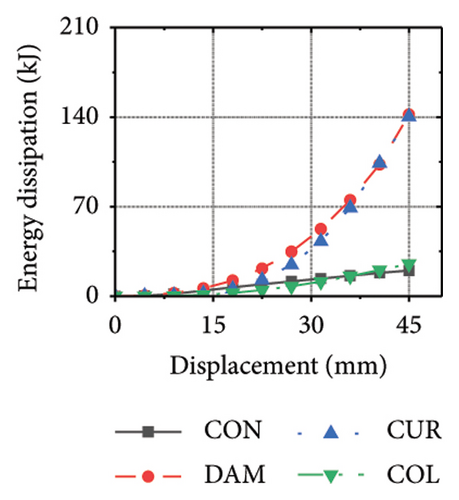
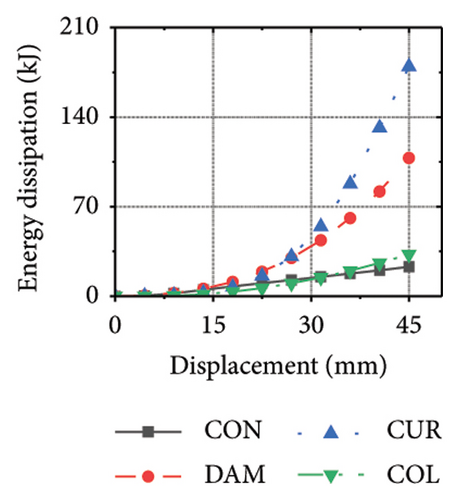
Figure 26 shows the energy-dissipation ratio of each specimen component for different constraint column and damper web thickness combinations. According to previous studies, when the constraint column is constant, the energy-dissipation ratio of the damper does not increase with an increase in damper web thickness. The main reason for this is that the damper stiffness increased while the constraint column remained constant, resulting in a shift in the deformation from the damper to the constraint column. In this situation, it is difficult for a damper to fully utilize its energy-dissipation capacity.
6. Energy Dissipation Evaluation and Lateral Bearing Capacity Calculation
6.1. Energy Dissipation Evaluation
- (i)
For rv−dw ≤ rw and rh−cd ≥ 5%, the energy dissipation of the damper was larger than that of the wall. The large cross-sectional size of the constraint column provided sufficient confinement to the damper, and the deformation was mainly concentrated on the damper. Therefore, the damper exhibited the highest energy dissipation, and the overall energy dissipation of the structure was weaker than that at the second level. The hysteresis curves are significantly reduced owing to the complete buckling failure of the damper.
- (ii)
For rv−dw ≤ rw and 5%>rh−cd ≥ 2%, the energy dissipation of the damper was larger than that of the wall. Additionally, the damage could be better concentrated on the damper, and the constraint column could be deformed to dissipate energy; therefore, the entire energy dissipation and damage concentration of the structure were optimal. The hysteresis curves did not decrease significantly because the wall body was not significantly damaged.
- (iii)
For rv−dw ≤ rw and rh−cd < 2%, the constraint column did not provide the necessary restraint on the damper and deformation occurred mainly on the constraint column. The damper failed to achieve its full energy-dissipation capacity, and the overall energy dissipation of the structure was insufficient. Therefore, the design goal of the damper (i.e., failure of the damper before the wall) under seismic action is difficult to achieve.
- (iv)
For rv−dw > rw and rh−cd ≥ 2%, the energy dissipation of the damper was less than that of the wall body. When the damper boundary was sufficiently restrained, the damage was concentrated on the damper, and the hysteresis curves decreased. However, the overall energy dissipation of the damper was insufficient, and it was difficult to sufficiently protect the main wall from the damage caused by the earthquake.
- (5)
For rv−dw > rw and rh−cd < 2%, the energy dissipation of the damper was smaller than that of the wall. It was difficult for the constraint column to provide the necessary restraint for the damper, and deformation occurred in the constraint column. The energy-dissipation efficiency of the damper was low, and the damage was concentrated on the main body of the wall. The energy-dissipation relationship was the worst. This situation should be avoided in the design stage.
| Level | (I) | (II) | (III) | (IV) | (V) |
|---|---|---|---|---|---|
| Range | rv−dw ≤ rw | rv−dw > rw | |||
| rh−cd ≥ 5% | 5%>rh−cd ≥ 2% | rh−cd < 2% | rh−cd ≥ 2% | rh−cd < 2% | |
| FM |  |
 |
 |
 |
 |
| HC |  |
 |
 |
 |
 |
| ED |  |
 |
 |
 |
 |
| EDR |  |
 |
 |
 |
 |
- Note: D = displacement, F = force.
- Abbreviations: ED = energy dissipation, EDR = energy-dissipation ratio, FM = failure mode; HC = hysteresis curve.
6.2. Lateral Bearing Capacity Calculation
As the damper should have an ideal energy-dissipation ratio, rv−dw should be inferior to rw. The specimens that met this requirements were summarized, and their bearing capacities were calculated, as listed in Table 5. In general, the error between the calculated and simulated values was small, indicating that equation (17) is effective and feasible.
| Specimen | Fs (kN) | rh−cd (%) | rv−dw (%) | Vc (kN) | Vb (kN) | Vcc (kN) | αem−col | Vd (kN) | αem−dam | Vp (kN) | Ft (kN) | E (%) |
|---|---|---|---|---|---|---|---|---|---|---|---|---|
| 2-1-1-dt6-15 | 591.0 | 10.0 | 62.5 | 111.5 | 42.8 | 436.2 | 0.00 | 182.9 | 1.00 | 106.9 | 444.1 | 24.9 |
| 2-1-2-dt6-15 | 665.9 | 10.0 | 59.0 | 111.5 | 42.8 | 436.2 | 0.00 | 182.9 | 1.00 | 213.8 | 551.0 | 17.3 |
| 2-1-3-dt6-15 | 724.0 | 10.0 | 56.2 | 111.5 | 42.8 | 436.2 | 0.00 | 182.9 | 1.00 | 320.7 | 657.9 | 9.1 |
| 2-1-3-dt12-15 | 1019.9 | 5.0 | 112.1 | 121.7 | 46.0 | 453.7 | 0.00 | 449.4 | 1.00 | 362.6 | 979.7 | 3.9 |
| 2-1-4-dt6-15 | 776.7 | 10.0 | 53.8 | 111.5 | 42.8 | 436.2 | 0.00 | 182.9 | 1.00 | 427.6 | 764.8 | 1.5 |
| 2-1-4-dt12-15 | 1096.3 | 5.0 | 107.3 | 111.5 | 42.8 | 436.2 | 0.00 | 449.4 | 1.00 | 427.6 | 1031.3 | 5.9 |
| 2-1-5-dt6-15 | 828.5 | 10.0 | 51.7 | 111.5 | 42.8 | 436.2 | 0.00 | 182.9 | 1.00 | 534.6 | 871.7 | 5.2 |
| 2-1-5-dt12-15 | 1155.2 | 5.0 | 103.2 | 111.5 | 42.8 | 436.2 | 0.00 | 449.4 | 1.00 | 534.6 | 1138.2 | 1.5 |
| 3-1-3-dt6-15 | 451.8 | 10.0 | 94.0 | 44.6 | 42.8 | 290.8 | 0.00 | 182.9 | 1.00 | 128.3 | 398.5 | 11.8 |
| 2-1-3-dt6-10 | 721.1 | 7.2 | 56.2 | 111.5 | 42.8 | 290.8 | 0.00 | 182.9 | 1.00 | 320.7 | 657.9 | 8.8 |
| 2-1-3-dt12-10 | 1010 | 3.6 | 112.1 | 121.7 | 46.0 | 302.4 | 0.47 | 449.4 | 0.53 | 362.6 | 911.1 | 9.8 |
| 2-1-3-dt6-20 | 725.1 | 12.5 | 56.2 | 111.5 | 42.8 | 581.6 | 0.00 | 182.9 | 1.00 | 320.7 | 657.9 | 9.3 |
| 2-1-3-dt12-20 | 1025.6 | 6.2 | 112.1 | 121.7 | 0.00 | 604.9 | 0.88 | 449.4 | 1.00 | 362.6 | 979.7 | 4.5 |
| 2-1-3-dt6-25 | 751.7 | 14.7 | 56.2 | 111.5 | 0.00 | 727.0 | 0.00 | 182.9 | 1.00 | 320.7 | 657.9 | 12.5 |
| 2-1-3-dt12-25 | 1099.9 | 7.3 | 112.1 | 121.7 | 0.00 | 756.1 | 0.74 | 449.4 | 1.00 | 362.6 | 979.7 | 10.9 |
| 2-1-3-dt6-30 | 755 | 16.4 | 56.2 | 111.5 | 0.00 | 872.4 | 0.00 | 182.9 | 1.00 | 320.7 | 657.9 | 12.9 |
| 2-1-3-dt12-30 | 1102.5 | 8.1 | 112.1 | 121.7 | 0.00 | 907.3 | 0.62 | 449.4 | 1.00 | 362.6 | 979.7 | 11.1 |
- Note: Fs is the bearing capacity used in the simulation. rh−cd and rv−dw are the stiffness ratios. Vc, Vb, and Vcc are the shear values of the concrete, steel bars, and restraint columns, respectively. Vd and Vp are the shear values of the damper and steel plate, respectively. Ft is the calculated bearing capacity. E is the error.
7. Conclusions
- (i)
The investigated corrugated steel plate composite shear walls exhibited excellent seismic performance and could be used as the main components in replaceable structures. Mild-steel dampers have an ideal energy-dissipation capacity and can be applied to replaceable structures. For wall toe replaceable shear walls, the interaction relationship between damper and wall body had a significant influence on the seismic performance of the replaceable shear wall.
- (ii)
Typically, the region in which the plastic hinge occurs is identified as the replacement region. Research on the plastic-hinge length calculation for shear walls is relatively mature, and the walls are often simplified using independent rod models. This method is convenient and accurate, and can be used to determine the size of the toe-replacement region.
- (iii)
By analyzing the shear wall deformation, a stiffness index that can be used to evaluate the energy-dissipation relationship between the damper and wall is proposed. The proposed index can be used to assess the interaction between the damper and wall body.
- (iv)
Sensitivity analysis results showed that under the same aspect ratio conditions, the seismic performance of the wall was limited when the damper web thickness was insufficient. In this situation, it is difficult to provide sufficient restraint to walls. This suggests that the damper parameters should be reasonably set to play a full role in the seismic performance of the wall.
- (v)
An energy-dissipation evaluation method is proposed. When rv−dw ≤ rw and rh−cd ≥ 5% were used, the energy dissipation was at Level I, indicating that the relationship between the damper and shear wall was optimal. At this level, the damper boundary was sufficiently restrained, and deformation could occur more effectively.
- (vi)
According to the analysis results, the interaction relationship influences the bearing capacity and must be considered. The revised lateral bearing capacity formula based on the energy-dissipation evaluation exhibited ideal accuracy and could provide a reference for practical engineering applications.
Conflicts of Interest
The authors declare no conflicts of interest.
Author Contributions
Qirui Luo: conceptualization, formal analysis, methodology, software, writing – original draft. Wei Wang: funding acquisition, resources, writing – review and editing. Shixing Zhao: data curation, resources. Min Zhang: conceptualization, supervision. Shuheng Yang: methodology.
Funding
This research was supported by Open Fund of the Sichuan Engineering Research Center for Mechanical Properties and Engineering Technology of Unsaturated Soils ∗ SC-FBHT2023-02 ∗ SC-FBHT2024-05 Research Project of the Sichuan Architectural Design and Research Institute ∗ KYYN202313 National Natural Science Foundation of China ∗ 51878548 ∗ 51578449 Science and Technology Department of Sichuan Province ∗ 2024JDRC0101.
Open Research
Data Availability Statement
The data that support the findings of this study are available from the corresponding author upon reasonable request.


