Modal and Wave Propagation Analysis of Vibration Tests on a Laboratory Building Model Before and After Damage
Abstract
Weakened structural stiffness is often a consequence of building damage, particularly after severe events such as earthquakes, where compromised structural performance can pose significant risks. To prevent immediate structural failure, an early warning system is essential, which requires inspection of local components. This research aims to achieve that by exploring the wave propagation analysis method, specifically seismic interferometry. Previous studies have applied this method to building structures, treating them as homogeneous layers of grouped floors. By analyzing the wave travel time along the height of these layers, the fundamental period of the building was estimated. However, this approach did not account for local damage or the variability of structural components, similar to the limitations of vibration-based damage detection methods, which mainly identify global changes. Thus, the goal of this paper is to improve structural health monitoring by examining the sensitivity of wave screening, bridging the gap between nondestructive testing and vibration-based damage detection. A half-scale, seven-story building model, characterized by vertical stiffness irregularity and transverse plan asymmetry, was tested in a laboratory setting. Two vertical sensor arrays were placed near corner columns of different sizes, representing both strong and weak structural areas. These arrays recorded floor accelerations in three directions. The study confirmed the effectiveness of wave propagation analysis for detecting damage along the sensor arrays before and after the earthquake. A transmissibility damage indicator was used to correlate changes in wave velocity, providing a quantitative assessment of damage levels along the wave propagation path.
1. Introduction
Earthquakes are considered as an inevitable natural disaster, which pose a significant threat to building safety and human life. Historical data reveal that the primary seismic risk arises from weakened structural components [1–3], which often leads to poor structural performance. This can make buildings more susceptible to aftershocks or even collapse. To mitigate this risk, early-stage damage assessment is crucial for implementing effective preventive measures that enhance structural serviceability and reduce potential damage. Generally, a function of buildings to resist external forces, such as earthquakes, largely depends on their structural stiffness. Damage to a structure typically results in reduced stiffness, which can be detected through changes in modal data, notably referring to frequencies, mode shapes, and modal damping [4]. As a result, many structural health monitoring (SHM) systems have been developed to measure structural dynamic characteristics for early-stage damage detection.
Operational modal analysis (OMA [5]) has emerged as a practical method for assessing full-scale civil structures. OMA allows vibration measurements to be performed while the structure remains in normal operational conditions, focusing solely on output recordings for dynamic analysis [6]. Although significant progress has been made in evaluating vibration signatures, these measurements are often insufficient to localize weakened structural components [7–9]. Furthermore, uncertainties in vibration measurements, caused by factors like temperature variations, moisture, and other environmental influences, can affect the accuracy of vibration recordings [10, 11]. To address these limitations, an alternative approach using wave propagation analysis is proposed to examine structural performance.
Wave propagation analysis is commonly used in geophysics for investigating ground motions [12] and characterizing soil properties [13]. The inherent property of wave propagation is superior for performing wave screening in large-scale structures. Recently, researchers have extended this approach to analyze the seismic responses of buildings, understanding that the vibrations experienced by a structure during an earthquake result from seismic waves propagating through it. For instance, Şafak employed a discrete-time wave propagation method to calculate the seismic response of multistory buildings founded on layered soil media, subjected to vertically propagating shear waves [14]. Snieder et al. applied the deconvolution technique in seismic interferometry to extract the impulse response of a building and estimate wave travel times by interpreting this response in the time domain [15]. Based on this, Todorovska and Trifunac measured wave travel times across different time windows—before, during, and after the peak amplitude response to detect damage [16]. However, these studies often assumed a homogeneous property for the layered medium, which represents a group of floors [17, 18]. This approach was used to explain the relationship between the total wave travel time in a building and its fundamental period. Nevertheless, the homogeneous assumption proves inadequate for complex building structures. Moreover, the estimated fundamental period cannot indicate the specific location of weakened structural stiffness caused by damage.
This paper incorporates wave propagation analysis, focusing on wave signals at local stories and corners, offering a promising approach to reveal the complexity of building structures. Our study provides a comprehensive evaluation of wave velocities, addressing the limitations of current modal analysis techniques. This research was conducted in the framework of a blind analysis contest organized by National Center for Research on Earthquake Engineering (NCREE) in Taiwan in 2019. The contest aimed to advance the development of computational prediction of seismic responses and efficient modeling techniques for reinforced concrete (RC) buildings, particularly those with earthquake effects and “soft” first-story conditions. The goal was to promote efficient seismic performance assessment methods for RC buildings. A half-scale laboratory building model, characterized by vertical stiffness irregularity and transverse plan asymmetry, was used as the test specimen. These features provide a suitable practical assessment for wave propagation analysis. The seismic impact on this building model was experimentally investigated using a shaking table. Before and after the synthetic seismic events, the model structure was damaged. To analyze its slight structural changes before and after the initial damage following the first seismic event, wave propagation analysis was applied to fulfill the localized examination similar to nondestructive testing, as the slight damage may not be obviously revealed by the structural vibration. However, the wave propagation used in this research was retrieved from the noise vibrations of the structure. The author believes that sensitivity of wave screening can bridge the gap between nondestructive testing and vibration-based damage detection.
The wave propagation analysis method used in this research is based on normalized-input-output-minimization (NIOM), proposed by Haddadi and Kawakami. NIOM involves the statistical correlation of vibration signals from various observations and aims to minimize the total energy of deconvolved wave signals to extract new wave signals [19, 20]. Wave propagation analysis was employed to assess both horizontal and vertical irregularities, as well as the loss of structural stiffness resulting from earthquakes. For qualitative analysis, the transmissibility function (TF) was introduced to characterize local structural components. TF is defined as the ratio of two output responses in a system, and peaks of its Fourier spectrum indicate critical frequencies of the system [21]. The critical frequencies shift as the system’s properties change. In our experiment, damage levels were assessed by comparing the TF before and after earthquakes.
In conclusion, this study confirmed the reliability of using wave propagation analysis to assess early damage progression. The high sensitivity of wave properties to local building damages demonstrates the effectiveness of this wave screening method. The damage indicators improve the assessment of seismic vulnerability and support rehabilitation efforts, potentially reducing repair costs associated with severe earthquake damage.
2. Methods
2.1. Background Theory of Seismic Interferometry
Generally, geophysicists use seismic interferometry to investigate ground surface motions or subsurface movements. This application allows for the extraction of surface waves that propagate between any pair of sensors in a seismic network. Seismic interferometry involves methods such as cross-correlation, deconvolution, and cross-coherency [22, 23] of the system’s responses. The wave propagation analysis method used in this research is NIOM, which is based on the deconvolution of signals. NIOM involves the statistical correlation of vibration signals from various observations and the minimization of the total energy of deconvolved wave signals.
2.2. NIOM
Reviewing [19], a time-invariant linear system, as illustrated in Figure 1, can be represented by the convolution integral of the input earthquake motion, f(t), at the ground surface and the output g(t) at depth.

2.3. Applications in Civil Engineering
The theory of seismic interferometry has been extended from soil media to building structures [24, 25]. In this approach, buildings are modeled as layered continua, similar to extended soil media. This assumption has been validated through field measurements by deploying vibration sensors at various levels within buildings. For instance, Snieder employed deconvolution of motion recordings from different levels to capture vertical impulse wave propagation within the structure. It has been demonstrated that deconvolution is the most effective seismic interferometry technique for extracting wave propagation information from earthquake records, surpassing both cross-correlation and cross-coherence methods [26]. Additionally, the deconvolution method has been applied to ambient vibration data [27]. Analyzing wave propagation in large-scale structures enhances wave screening within the framework of SHM [28].
So far, relevant wave parameters have been studied by analyzing dispersion properties, which relate wave velocities to frequencies [29]. Wave velocity can be estimated by measuring the time lag between two wave peaks in the deconvolved wave signals and dividing the wave propagation distance by this time lag. To estimate building vibration responses, Todorovska developed a simplified model based on experimentally measured wave velocities. This model was constructed using the wave equation derived from the motion equation of a beam element. The wave properties in this model theoretically correspond to the physical properties of shear beams or Timoshenko beams [17, 18]. However, these models designed for layered systems fail to capture the complexities of actual buildings. The author argues that this limitation leads to inadequate sensor layouts for in situ measurements that cannot reliably detect local damage or account for various structural components in real buildings. These simplified models provide an overview rather than a localized view of wave propagation in building structures. To address this, the author suggests using seismic interferometry of noise vibrations recorded at different positions within a building. This method examines wave properties in local areas to demonstrate the sensitivity of wave propagation in complex structures, a concept not yet proven in previous studies. By focusing on localized wave propagation, this research offers a more precise assessment of structural integrity.
3. Damage Indicators
3.1. Wave Velocity vs. Flexural Stiffness
Based on the conclusions in the previous section “Applications in Civil Engineering,” this research rejects the traditional method of using a simplified beam model to provide an overview of wave propagation in building structures. However, such a beam element can still illustrate the relationship between wave properties and structural stiffness. To offer a localized view within a building structure, the Bernoulli–Euler beam model is used to simplify the integral structural stiffness of a column corner area, where the column extends vertically through all building levels. By treating the local area in a building as a vertical beam, it becomes easier to analyze wave propagation along the building height at different locations. This simplification allows us to focus on key parameters like local stiffness, which is crucial for assessing wave propagation in areas with varying column sizes. In our experiment, different column sizes lead to varying flexural stiffnesses at each level, causing plan stiffness irregularities. The building’s height, analogous to the beam’s length and interpreted as the wave propagation path, helps us apply beam theory to explain wave propagation phenomena in various corners of the building.
According to the wave equation derived from Bernoulli–Euler beam theory, a relationship between wave velocity and flexural properties can be established as follows.
Here, m is the mass per length, which is equal to the product of density and cross section area; v(x) is the vertical displacement; the variable x denotes the local position along the length of the beam; and EI is the flexural stiffness, which is constant along the beam’s length.
The results of the spectral analysis reveal a fundamental characteristic of elastic systems: as the system’s stiffness increases, so does the wave velocity. Consequently, wave velocity can serve as an indicator for detecting variations in structural stiffness.
3.2. TF and Damage Index (DI)
According to the conclusion that wave velocity can serve as an indicator for detecting variations in structural stiffness, a transmissibility damage indicator is used to correlate changes in wave velocity. This provides a quantitative assessment of damage levels along the wave propagation path (along the building height).
Equation (11) represents a scalar product that characterizes the structural properties, including mass, stiffness, and damping ratio, in the frequency domain. The peaks of a TF indicate critical frequencies, which can be used for system identification [30] and damage identification [31].
Equation (12) indicates that the total difference is divided by the sum of the normalized TF amplitudes in the intact state. As a result, a DI value of zero signifies no damage, while higher DI values correspond to greater levels of damage.
4. Laboratory Experiment
A half-scale laboratory building model, characterized by vertical stiffness irregularity and transverse plan asymmetry, was examined to demonstrate a soft story feature. Using a triaxial shaking table, the seismic impact was tested with five different earthquake events. White noise was applied before and after each event to record vibrations. The study highlighted the high sensitivity of wave propagation to early-stage damage, discussing initial damage phenomena post-first seismic event and extending the damage assessment to a localized view.
4.1. 1/2-Scale 7-Story Building Model
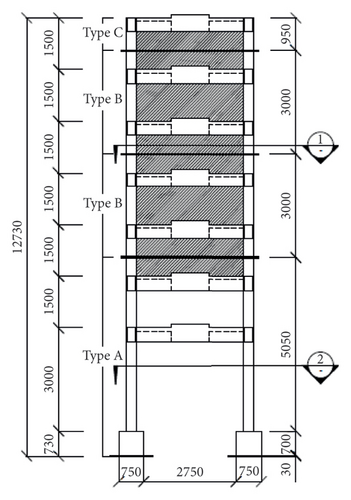
Figure 2 shows the half-scale, seven-story building model used for the blind analysis contest.

This RC structure was constructed using a modular approach [32]. A notable feature of this building model is its irregularity, which results from the varying sizes of the columns and the laterally stiffened RC walls (the shaded area in Figure 3(b)). The building has a total height of 12 m above ground level (Figure 3). Particularly, the first floor is twice the height of the other floors, creating a soft story [33] that can lead to inefficiencies in structural performance and increased risk of structural failure during earthquakes.

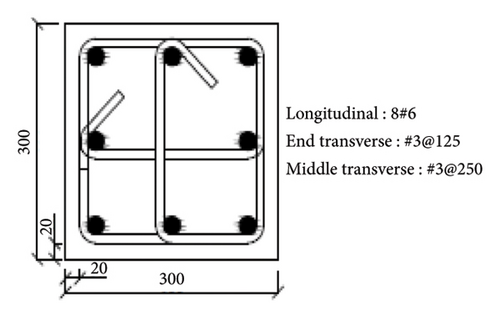
In the construction plan, six columns (labeled C1 to C6 in Figure 4) are designed to support the entire structure. The smaller columns, C1, C2, and C3, have cross sections of 30 × 30 cm (Figure 5(a)), while the larger columns, C4, C5, and C6, have cross sections of 75 × 30 cm (Figure 5(b)). Static cyclic tests were conducted on columns of both sizes, as detailed in [34]. The shear capacity of the columns is influenced by their dimensions, with the shear capacity in the Y direction being greater than in the X direction.
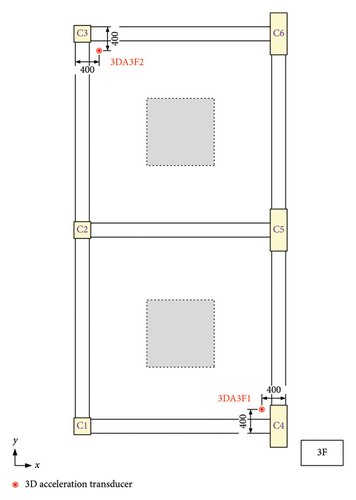

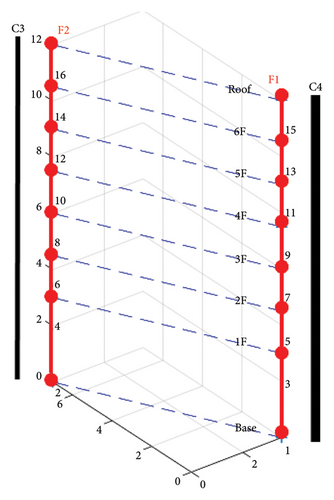
In our experiment, two acceleration transducers were installed near the corner columns on each floor (as indicated by the red dots in Figure 4), creating two vertical sensor arrays throughout the building. These arrays, named F1 and F2, are shown in Figure 6. Array F1 was positioned near the C4 column, while array F2 was positioned near the C3 column. Each transducer recorded vibration data across three channels corresponding to the X-, Y-, and Z-axes, aligning with two horizontal directions of the building and the vertical direction.
4.2. Modal Analysis
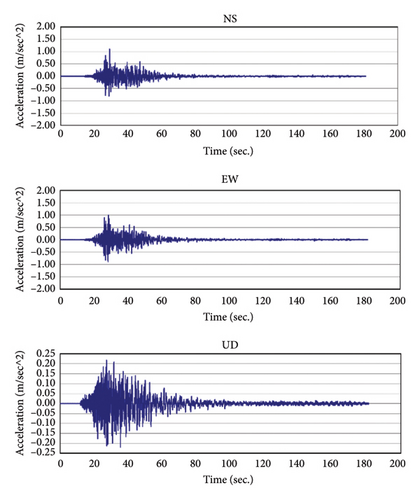
This section evaluates the building’s vibrations before and after the first earthquake, using the scaled far-field ground motion CHY015 from the Chi-Chi earthquake as the input source (see Figure 7).
4.2.1. Modal Results Before Earthquake
This excitation caused slight damage to the building structure while it remained in a linear elastic state. The building’s vibrations before and after the first earthquake were analyzed using modal analysis with the MACEC toolbox in MATLAB [35]. The comparison between the undamaged and damaged states of the structure is illustrated through the first four modes, as shown in Figures 8 and 9.
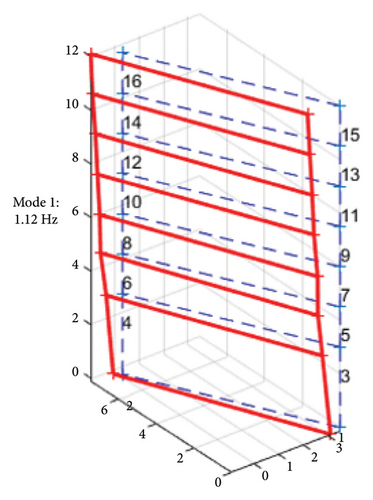
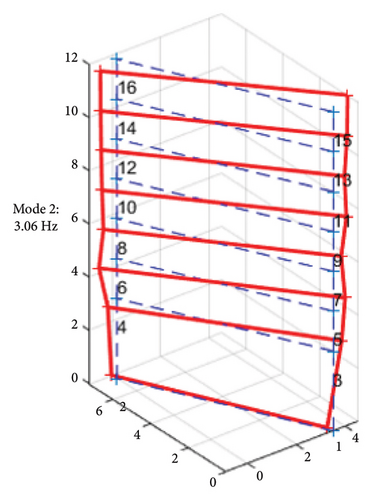
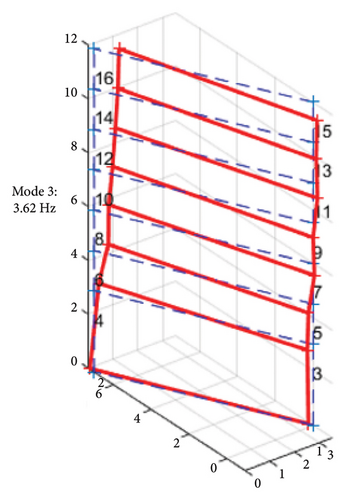
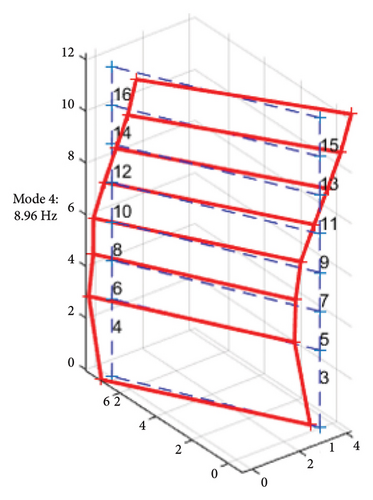
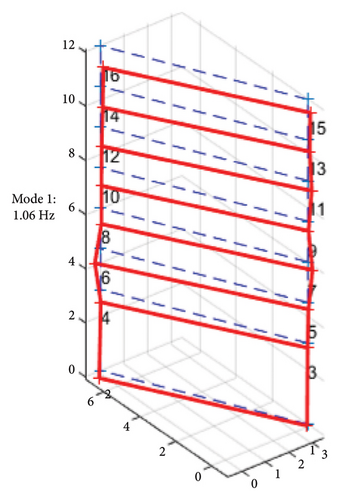
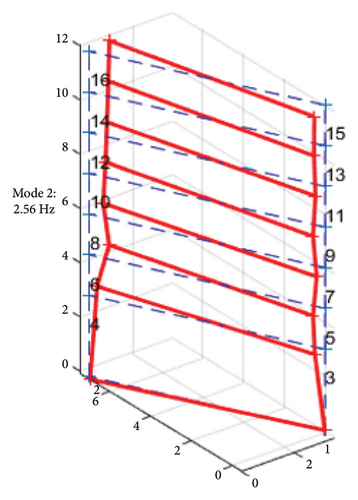
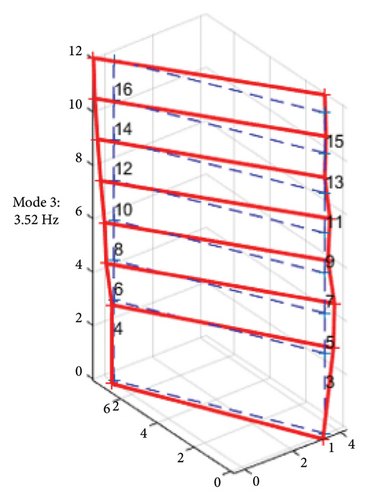
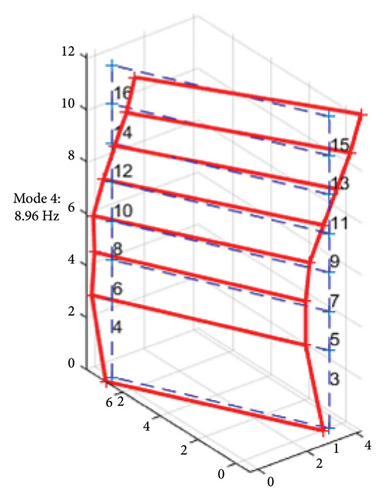
Before the earthquake, the first mode shape in Figure 8(a) reveals a pure bending motion in the transverse direction, which is attributed to the lower flexural stiffness in that direction. The higher mode shapes in Figures 8(b) and 8(c) predominantly exhibit torsional motion, resulting from the structural irregularity. In the 4th mode, the torsional behavior becomes even more pronounced due to the lateral stiffness imbalance, as shown in Figure 8(d). Overall, a noticeable twist can be observed at the second floor along the vertical axis, caused by the lateral RC walls located above the second floor.
In terms of modal characteristics, the primary vibration of the building, which is the bending motion in the transverse direction, exhibited properties of a flexural wave. This phenomenon aligns with the wave properties derived from the Bernoulli–Euler beam theory, which is suggested by author for studying wave propagation in localized areas along the building’s height.
4.2.2. Modal Results After Earthquake
After the earthquake, the frequencies of the first three modes decreased, while the 4th mode frequency remained unchanged. However, the higher mode shapes shown in Figures 8(b) and 8(c) show no change in their torsion motion. Particularly, the first mode shape, as shown in Figure 9(a), reveals a bending motion that shifted at a 45-degree angle between the longitudinal and transverse directions. The plan views of such motion are illustrated in Figures 10(a) and 10(b). The change implies that the structure was weakened in the longitudinal direction due to damage. The suspected damaged area, marked by the gray shadow in Figure 10(c), corresponds to the observed shift in the mode shape angle.
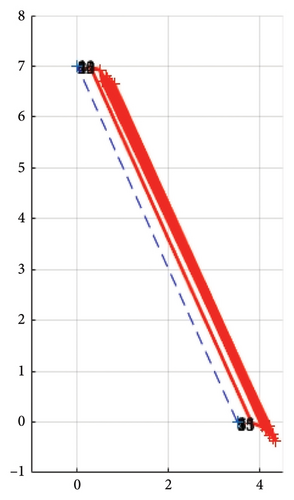
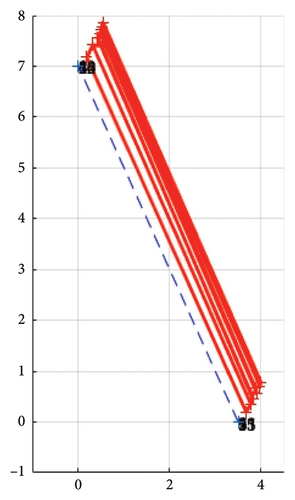
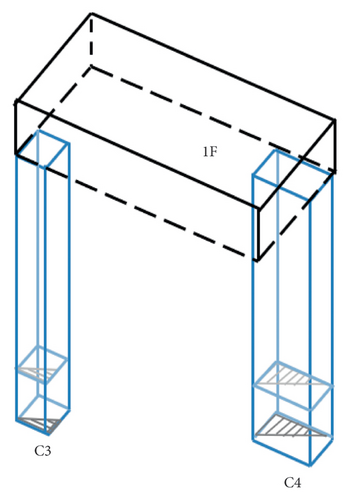
4.2.3. Discussion
The following illustrations in Figures 11 and 12 indicate the damage on the 1st story. Areas A1 and A2 are on column C3, and A3 and A4 are on column C4. A1 and A3 are along the longitudinal direction, facing outward from the building. A2 and A4 are along the transverse direction, facing inward from the building. The crack propagation caused by the first earthquake matches the suspected damage area indicated in Figure 10(c).
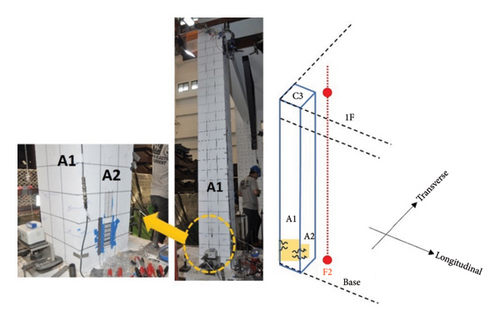
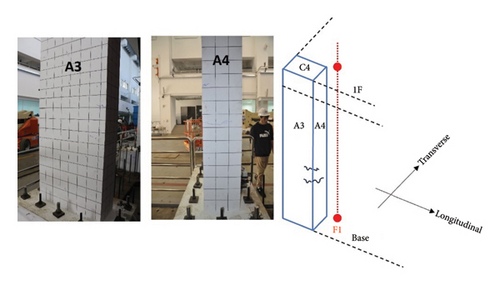
From the photos, it is evident that the damage to column C4 is less severe compared to that of column C3. Additionally, the cracks are longer in the transverse direction than in the longitudinal direction. This discrepancy is due to the weak stiffness in the transverse direction.
In short, a decrease in modal frequencies can indicate integral structural changes due to damage from the earthquake. Additionally, analyzing discrepancies between modal shapes can provide clues about the positions of cracks. However, accurately localizing the damage and quantifying its severity using modal analysis alone is challenging.
4.3. Wave Propagation Analysis
Two vertical sensor arrays, F1 and F2, were positioned to capture reconstructed wavefields. Sensors were placed on the following floors: Base, 1F, 2F, 3F, 4F, 5F, 6F, and Roof, from bottom to top, to clarify the wave propagation path between floors. Vibration responses of each floor, subjected to white noise excitation before and after the earthquake, were filtered using a bandpass within the 0.5 to 30 Hz frequency range. The recording sampling rate was 512 Hz. Figure 13 illustrates the vibration responses recorded in the X direction at the F1 position on the Roof (F1X-Roof) and at the Base (F1X-Base) before the earthquakes.

4.3.1. Reconstructive Wavefield
When “Base” is chosen as the current level, the corresponding transfer function is used to retrieve the new output model for “Base” in a cutoff window, according to equation (2). The new output models for all 32 cutoff windows at “Base” at F1 are then transformed into the time domain and presented in Figure 14.
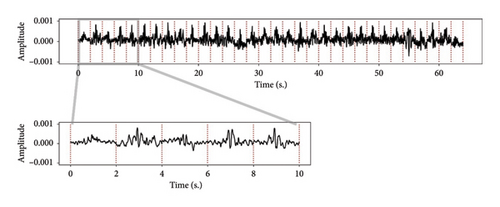
The final step involves stacking and normalizing the processed signals to obtain a representative wave signal with a two-second length. This process is repeated for each floor (1F, 2F, 3F, 4F, 5F, and 6F). These signals are then plotted following the reference level “Roof,” as shown in Figure 15. The results are displayed in a zoomed-in window with a one-second length to clearly show wave peaks in both the causal and acausal time domains. This reconstruction reveals a wavefield where wave propagation can be observed traveling from the “Roof” to the “Base.”
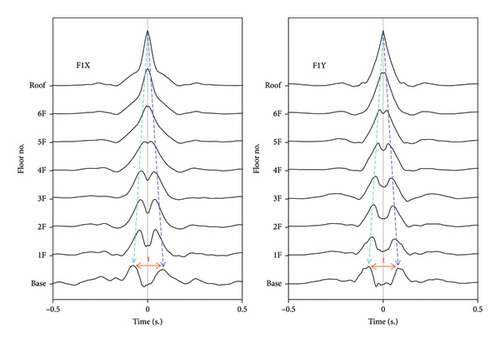
Figure 15 illustrates the shear wave propagation at F1 before the first earthquake. Shear waves, propagating in the building’s transverse (X) and longitudinal (Y) directions, were analyzed separately. Tracking the wave peak from “Roof” to “5F” reveals that while the peak in the X direction has not yet split into two distinct peaks, this splitting has already occurred in the Y direction. This suggests that the wavelength in the X direction is longer than in the Y direction. Since lower frequencies correspond to longer wavelengths, this observation aligns with the first bending mode shape, indicating uneven structural stiffness between the X and Y directions.
4.3.2. Wave Travel Time and Wave Velocity
In the building model, the upper stories are reinforced with additional lateral RC walls, enhancing shear capacity in the X direction. To investigate the relationship between local story stiffness and shear wave velocities, two sections of the building are analyzed separately: the upper stories from “Roof” to “2F” (RF-2F), which include the additional RC walls, and the lower stories from “2F” to “Base” (2F-Base), which lack these walls.
The average wave velocity is calculated by dividing the wave travel distance by the wave travel time D/Δt. The values of D and Δt are summarized in Table 1. In Figure 15, the bright blue dashed line indicates the wave travel time in the acausal time domain, while the dark blue dashed line indicates the wave travel time in the causal time domain. The wave travel time Δt used for estimating the average wave velocity is determined by half of the time interval, thus 1/2t, observed between two wave peaks at a current level.
| Reference–current levels | Wave propagation distance Total story height (m) D = ∑i=storyhi |
Wave travel time (s) Δt | |||
|---|---|---|---|---|---|
| F1-X | F1-Y | F2-X | F2-Y | ||
| RF-2F | 7.5 | 0.037 | 0.053 | 0.041 | 0.054 |
| RF-Base | 12 | 0.079 | 0.078 | 0.080 | 0.079 |
| 2F-Base | 4.5 | 0.042 | 0.025 | 0.039 | 0.025 |
The wave propagation distance, which is the total story height between the reference level and the current level D = ∑i=storyhi, is 7.5 m for the upper stories (RF-2F) and 4.5 m for the lower stories (2F-Base) as shown in Table 1. For the section “2F-Base,” the average wave velocity is straightforwardly calculated by dividing D by the difference of Δt between “RF-2F” and “RF-Base.” Consequently, the estimated average wave velocities are summarized in Table 2.
| Reference–current levels | Wave velocities (m/s) D/Δt | |||
|---|---|---|---|---|
| F1-X | F1-Y | F2-X | F2-Y | |
| RF-2F | 201.91 | 142.08 | 182.68 | 139.50 |
| RF-Base | 151.56 | 153.45 | 149.71 | 151.56 |
| 2F-Base | 107.06 | 177.06 | 115.09 | 177.06 |
In the “RF-2F” section, local wave velocities vary at individual sensor array positions due to unequal plan stiffness. Generally, velocities are higher at F1, where the stronger column is located, compared to F2, where the weaker column is situated. This observation is consistent with equation (10) in Section 3.1: columns with higher flexural stiffness exhibit higher wave velocities. Additionally, in the upper stories with the additional RC walls, velocities in the X direction are higher than those in the Y direction, reflecting the enhanced shear capacity in the X direction. Conversely, in the “2F-Base” section, which lacks additional RC walls, velocities in the Y direction are higher than in the X direction. Also, it is observed that average wave velocities in the X direction decrease when traveling in “2F-Base” compared to traveling in “RF-2F.” This reduction is attributed to the “soft story” effect. However, it is interesting to see that average wave velocities in the Y direction increase when traveling in “2F-Base” compared to traveling in “RF-2F.” Overall, the variations in wave velocities reveal the nonuniform structural stiffness of the building model.
A statistical demonstration of the distance corresponding to the wave travel time can be presented by fitting the distances between various floor pairs—RF-6F, RF-5F, RF-4F, RF-3F, RF-2F, RF-1F, and RF-Base—against their corresponding wave travel times. The slopes shown in Figure 16 represent the average wave velocities traveling vertically along the building height at F1 and F2 in two directions. It is notable that by this way to obtain the average velocities along the building height, the velocities in the same direction but measured at two different positions, F1 and F2, are nearly identical. This observation reflects a global phenomenon in wave propagation. However, when comparing the two horizontal directions, it is clear that wave velocities in the Y direction are higher than in the X direction, both before and after the first earthquake. The earthquake caused only minor damage, keeping the structure in an elastic linear state. Consequently, there was only a minor decrease in the average wave velocity.
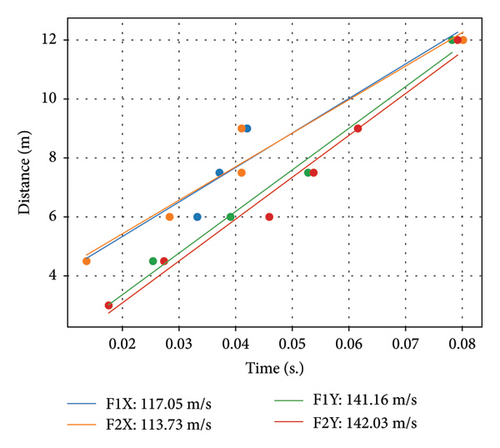
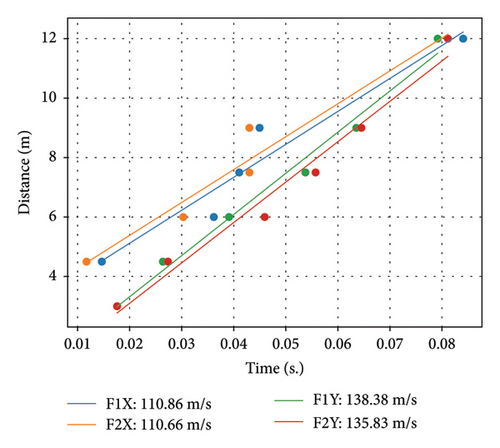
Comparing Figures 16(a) and 16(b), the variation of wave velocities is compared as tabled in Table 3.
| Before the 1st earthquake | After the 1st earthquake | Difference (%) | |
|---|---|---|---|
| F1-X | 117.05 | 110.86 | 5.28 |
| F2-X | 113.73 | 110.66 | 2.70 |
| F1-Y | 141.16 | 138.38 | 1.97 |
| F2-Y | 142.03 | 135.83 | 4.37 |
Table 3 shows the difference of average wave velocities propagating the whole building before and after the first earthquake. This result infers the damage level at the local area where sensor arrays are. From the bending behavior of this building model and the stiffness property deduced from the beam theory, the differences of those wave velocities are used to compare the integral stiffness at the local area.
For instance, the decrease in wave velocities at F1 in the X direction was more significant than in the Y direction. This is self-evident by the inequal flexural stiffness in two horizontal directions. The lower stiffness in the X direction experienced greater damage effects. On the other hand, the decrease in wave velocities at F2 in the Y direction was more significant than in the X direction. It implies that the shear capacity enhanced by the additional RC walls strengthened the X direction.
4.4. Discussion
4.4.1. TFs Along the Wave Propagation Path
By simplifying the structural properties of a local vertical column area as a vertical Bernoulli–Euler beam, the floors in the building model were treated as DOFs in the beam structure. In our experiment, TFs were calculated between two DOFs according to equation (11), using outputs from two receivers along a sensor array. Figure 17 displays the frequency spectra of the TF before and after the first earthquake. The amplitude shown in Figure 17 was derived using (|Tcur, ref(ω)|/mean(|Tcur, ref(ω)|)) based on equation (12), comparing the reference level “Roof” with the current level “Base.”

This shift serves as a damage indicator, providing information about the extent of the damage: a higher total difference signifies greater damage. The damage level was assessed by comparing the TFs recorded before and after the first earthquake. Figure 18 shows the damage levels related to local TFs, with references fixed at “Roof.”
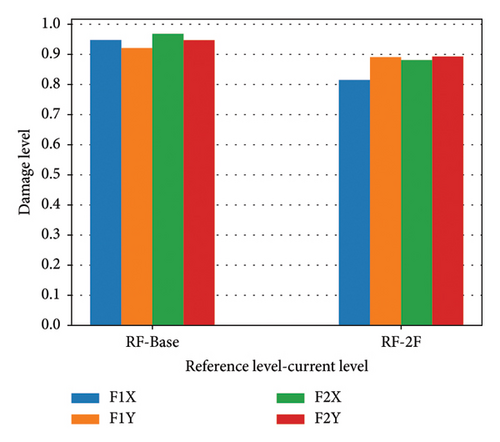
In the section “RF-Base” the highest damage level is F2X and the lowest damage level is F1Y. On the other hand, in the section “RF-2F,” the highest damage level is F2Y and the lowest damage level is F1X. These results correspond to the overall stiffness distribution (Y > X) and the higher stories with high shear capacity in the X direction.
4.4.2. Sensor Layout vs. Structural Complexity
Although the NIOM method has proven effective for investigating building damage [36], its sensitivity in reconstructing wave propagation at local positions in two horizontal directions has not been validated. Additionally, many researchers have used shear wave theory to clarify the relationship between a building’s fundamental period and the total wave travel time within the structure. However, a study that applied shear wave theory to calculate the fundamental period of a numerical 2-D ten-story frame building model found that the fundamental periods were identical across different lateral stiffness distributions [37]. This evidence indicates that shear wave theory and the assumption of a homogeneous one-layer continuum are inadequate, as they fail to account for the complexity of real buildings. Our detailed analysis of wave velocities challenges the assumption of uniform building properties, revealing variations in velocities at different locations within cutoff stories. Furthermore, the complexity between floors was further confirmed by examining local wave velocities. This finding underscores the importance of proper sensor placement at multiple horizontal locations and vertical levels. However, the impact of sensor spacing relative to the wavelength of the propagating waves is beyond the scope of this paper.
5. Conclusions
This paper presents a study on the experimental damage assessment of a half-scale laboratory building model using wave propagation analysis. It challenges the traditional approach of treating building structures as homogeneous media. The study confirms the effectiveness of wave propagation analysis in revealing structural complexities, showing that average wave velocity indicates overall structural stiffness, while local wave velocity variations reflect specific reinforced sections. By analyzing local sections, the study compares stiffness variations within a cutoff story using both wave velocity and DI. Key findings include the following. (1) Variations in wave velocity were closely aligned with the distribution of structural stiffness, revealing the impact of flexural stiffness from columns and shear capacity from additional shear walls. (2) Degradation in stiffness caused by earthquake-induced damage was indicated by a decrease in wave velocity and an increase in the damage level. The discussion emphasizes the importance of strategic sensor placement for effective damage detection through vibration measurements. While the wave propagation wavelength along the building height was larger than the height of two levels, potentially ignoring joints between columns and floors, this presents an interesting topic for future research on the sensitivity of wave velocity to damage scale relative to wavelength.
Conflicts of Interest
The author declares no conflicts of interest.
Funding
This work was supported by the DAAD (German Academic Exchange Service) and the Government Scholarship for Study Abroad (GSSA) provided by the Ministry of Education (MOE) in Taiwan.
Acknowledgments
This paper is part of the author’s doctoral research [38], supported by funding from the DAAD (German Academic Exchange Service) and the Government Scholarship for Study Abroad (GSSA) provided by the Ministry of Education (MOE) in Taiwan. The author gratefully acknowledges Dr. Fu-Pei Hsiao of National Center for Research on Earthquake Engineering (NCREE) in Tainan, Taiwan, for providing the experimental data. Special thanks are extended to Professor Yuri Petryna at Technische Universität Berlin for his constructive discussions on this work.
Open Research
Data Availability Statement
The vibration records used in this study were provided by National Center for Research on Earthquake Engineering (NCREE) in Tainan, Taiwan. Information about the building model used in this study can be referenced from the “Blind Analysis Contest” organized by NCREE, Taiwan, available at https://www.ncree.org/conference/index.aspx?n=C20180501A0. For further details on the analysis contest and the shaking table tests, refer to the detailed document https://www.ncree.org/conference/UserData/0/C20180501A/Download/BlindAnalysisContest_DetailedInformation_0403.pdf and the associated research paper (DOI: 10.1177/8755293020911134).


