Application of Acoustic Emission and Baseline-Based Approach for Early Fatigue-Damage Detection
Abstract
Monitoring fatigue damage in mechanical connections is essential for maintaining the safety and structural integrity of offshore wind turbines (OWTs), particularly during the early stage of crack initiation. Recently, the C1 wedge connection (C1-WC) has emerged as a promising innovation for use in OWTs. Acoustic emission (AE) monitoring is a widely used real-time technique for detecting fatigue cracks. The space limitations of the lower segment holes in the C1-WC presents challenges for detecting surface cracks with conventional AE sensors. Thin Piezoelectric Wafer Active Sensors (PWAS), while small and lightweight, face limitations due to their poor signal-to-noise ratio. In this study, we propose a baseline-based approach to enhance the effectiveness of PWAS for accurate AE monitoring in confined spaces. A benchmark model correlating the damage state of specimens is created by breaking pencil leads. Multivariate feature vectors are extracted and then mapped to the Mahalanobis distance for damage identification. The proposed method is validated through testing on compact specimens and C1-WC specimens. To enhance the AE detection results, supplementary monitoring techniques, including digital image correlation, crack propagation gauges, and distributed optical fiber sensors, are employed. The experimental setup, signal acquisition, and detection efficiency of these techniques are briefly outlined. This study demonstrates that the proposed approach is highly effective in detecting early damage in C1-WC specimens using AE monitoring with PWAS.
1. Introduction
Over the past few decades, offshore wind turbines (OWTs) have experienced significant growth due to their ability to harness stronger and more consistent offshore winds for renewable energy generation [1, 2]. Among the various types of foundations used for OWTs, the monopile foundation (MP) is the most common, accounting for around 80% of existing projects [3]. Ensuring the structural integrity of OWTs relies heavily on the connection between the MP and transition piece (TP) [4]. Dynamic loads from winds and waves are the primary loads acting on OWTs, which can lead to iterative deterioration and crack initiation, ultimately resulting in fracture. Fatigue damage to the MP-TP connection could cause catastrophic failure of OWTs. Therefore, early detection of such damage is essential to provide warning signs and prevent complete structural collapse.
The acoustic emission (AE) technique is a nondestructive testing (NDT) method that has been successfully employed to detect fatigue damage in various structures [5]. Compared to other NDT methods, the primary advantage of AE techniques is their capacity for real-time and long-term monitoring without disrupting operations. AE is a phenomenon where stored energy within a material is rapidly released as transient elastic waves during deformation. These waves can be detected as they propagate through the material and are subsequently converted into electrical signals by specialized piezoelectric sensors mounted on the surface of the structures [6]. During the fatigue fracture process, the major AE sources include crack initiation, crack propagation, and crack opening and closure [7]. Numerous studies have established correlations between AE features and crack growth behavior [8–14].
Commercial AE sensors, such as WSα and R15α sensors, are typically used in AE monitoring [15–18]. However, their bulky size hinders their application for monitoring damage in restricted-access areas [19]. Recently, an innovative connection known as the C1-wedge connection (C1-WC) has been developed, and its benefits and novelty have been demonstrated in previous studies [4, 20]. As a robust connection for offshore applications, C1-WCs offer the advantage of reduced construction, installation, and maintenance costs [20]. It has been reported that fatigue damage in C1-WCs often originates from the inside of the connections, where conventional bulky AE sensors are unsuitable.
In addition to commercial sensors, thin and miniature Piezoelectric wafer active sensors (PWAS), with a thickness smaller than 1 mm, are effective for exciting and detecting ultrasonic guided waves in nondestructive evaluation and structural health monitoring (SHM) [21, 22]. Many researchers have compared the performance of commercial sensors and PWAS [23, 24]. Compared to commercial sensors, PWAS offer the following advantages: (a) PWAS are compact and lightweight, which makes them well-suited for use in confined or weight-sensitive environments and facilitates their integration into existing structures. (b) The simplified design and manufacturing processes of PWAS contribute to a reduction in overall system costs. However, there are also disadvantages associated with using PWAS: (a) PWAS are less durable and more susceptible to environmental factors like temperature fluctuations and humidity. (b) PWAS typically have a lower signal-to-noise (SNR) ratio, which may affect their performance in harsh conditions or noisy environments. (c) The installation of PWAS can be complex and time-consuming, necessitating expert knowledge and skills to ensure proper placement and wiring for optimal performance. Bhuiyan et al. [25] concluded that PWAS can achieve comparable detection results for fatigue cracks in the thin plate-like structures. However, PWAS are less effective for monitoring thick steel plates, capturing only 5% of the AE events recorded by R15I sensors. Similarly, Yu et al. [26] observed that the cumulative AE features of PWAS could detect crack initiation only when the crack size reached 0.83 mm. Hence, a new signal processing method is necessary to enhance the capability of PWAS for early fatigue damage detection.
A signal processing method, the baseline-based method, has been proposed for AE monitoring in damage detection within SHM [27–31]. This approach involves creating a benchmark model based on noise or background signals and continuously monitoring for abnormalities that significantly deviate from this baseline. Such abnormalities usually indicate damage in relation to the structural health condition. To identify these anomalies, similarity or difference measures are calculated between signals obtained during the inspection phase and those recorded in a pristine state. Methods for anomaly detection include cross-correlation [30, 32], magnitude squared coherence (MSC) [33], and distance-based anomaly detection [34, 35]. Experimental studies have demonstrated that accurate damage detection can be achieved using PWAS when integrated with the established baseline model [30, 36].
However, creating a benchmark model that accounts for all possible pristine states is challenging due to the variability in environmental and operational conditions in real-world applications. To overcome this limitation, this paper proposes a novel baseline-based method for the early detection of fatigue cracks. Rather than using the health condition as the reference model, this approach utilizes signals from the “damage” state as a baseline to develop a benchmark model that effectively represents this condition. Nevertheless, the damage-related signals generated from crack initiation, growth, and opening vary due to the propagation of the crack [12]. This variability makes it difficult to collect a consistent set of crack-related signals for benchmarking, particularly those specific to crack initiation. A widely recognized approach for simulating crack-like AE signals is to employ the Hsu-Nielsen source pencil leads breaking (PBL) [37]. This method is preferred due to its excellent reproducibility and well-defined analytical expression for its source functions. It plays a crucial role in calibrating AE monitoring systems [38], characterizing AE sensors [39], validating AE signal processing algorithms [40, 41], and facilitating damage localization [42–44].
It is important to note that there are certain differences between crack signals and PBL signals. Firstly, crack signals typically release less energy compared to PBL signals [45]. Furthermore, PBL generates a monopole source that is oriented at an angle to the surface of the specimen, while crack formation and growth produce dipole sources that are aligned parallel to the plane of the specimen. To better understand these differences, Hamstad et al. [46–48] conducted a series of numerical and experimental investigations comparing PBL signals to crack-related signals in metal plates. The results demonstrate that monopole PBLs on the edge of the plate generate waves that most closely resemble those from dipole-type sources near the surface [46]. Fatigue cracks typically nucleate on the surface of a material, where deformation is more heterogeneous compared to the interior [49]. Hence, it is appropriate to use PBL signals generated at the edge surface as a reference dataset for identifying crack initiation, but not for tracking further crack growth.
The primary objective of this paper is to provide an early warning of fatigue cracks in C1-WCs using AE technique. The effectiveness of the proposed methodology is validated through experiments conducted at two levels: the sub-component level, using thick compact tension (CT) specimens, and the element level, using segment specimens with C1-WCs. Both PBL tests and fatigue tests were performed at each level. This paper is organized as follows: Section 2 provides a brief introduction to the proposed baseline-based method. Section 3 details the experimental tests conducted on CT specimens and C1-WCs. Sections 4 and 5 present discussions of the detection results. Finally, Section 6 summarizes the conclusions of this paper.
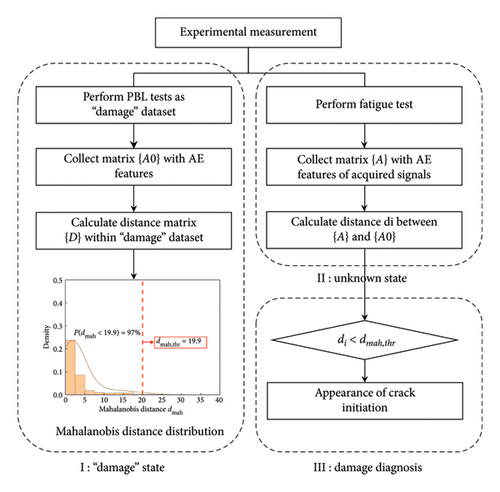
2. The Proposed Damage Detection Method
-
Step I: Create a benchmark model as the “damage” state.
-
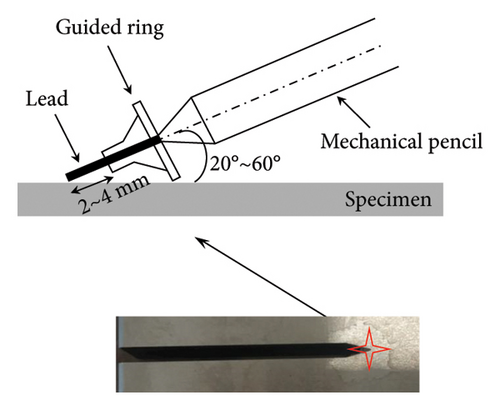
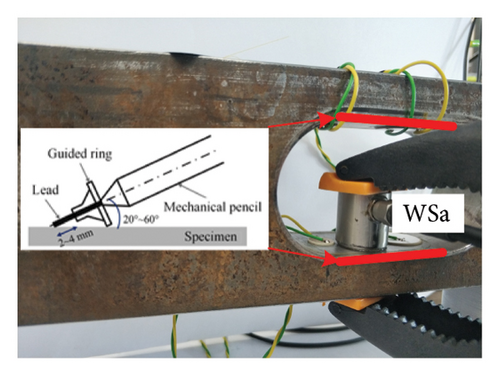
Sause [37] performed a comprehensive finite element analysis of PBL as AE sources. The study revealed that the length of the free lead and the contact angle had minimal impact on the shape of the contact force. However, the magnitude of the AE source varied significantly depending on the type of mechanical pencil used. To account for randomness and uncertainty [37], pencil leads were broken with varying free lengths of 2–4 mm and contact angles of 20°–60°. AE signals from these PBL were then recorded by the AE measurement system.
-
The frequency range of recorded AE signals is highly dependent on the specific application, including the type of structural medium and the characteristics of the AE source. For AE sources in metallic structures, a recommended frequency range is 100 kHz–900 kHz [50]. Additionally, a preliminary analysis of the PBL signals collected from the WSα sensor was conducted. The WSα sensor is characterized by a flat frequency response over a wideband frequency range of 100–1000 kHz. This sensor allows for more accurate identification of the natural frequency characteristics of AE sources. Analysis of the WSα sensor data indicates that the average value of PP (80–500 kHz) is 92%. Consequently, an 80–500 kHz bandpass filter is applied to the collected PBL signals to focus on the primary frequency band of interest.
-
To construct the feature matrix {A0} of the “damage” dataset, the AE features listed in Table 1 are extracted from the PBL signals. Previous research has shown that AE features in the frequency domain are effective in correlating with the appearance of damage and that these features outperform other candidates [51]. Partial power (PP) features are employed to measure the proportion of signal power within a specified frequency range (f1 − f2) relative to the total power of the signal:
(1) -
where a power spectral density formula U(f) for each signal is obtained using the fast-Fourier transform (FFT), and F is the sampling frequency of the signals. computes the total power across the entire frequency range. A feature matrix {A0} is constructed as a 5 × m matrix (5 is the number of features and m is the number of observations). This matrix is defined as {A0} = {a0,1, a0,2, …, a0,m}, where a0,j is the feature vector corresponding to the jth PBL signal.
-
To integrate the feature vectors in {A0}, Mahalanobis distance (MD) is utilized to create a multidimensional measurement scale. MD is a multivariate distance metric that measures the distance between a point or vector, and a distribution. This metric has proven to be an efficient method for calculating pairwise distance, making it particularly valuable in multivariate anomaly detection [30, 34]. The MD dmah,j is calculated for each a0,j as
(2) -
where μ and ∑−1 are computed exclusively from the baseline feature matrix {A0}. Subsequently, a distance matrix {D} is constructed as {D} = {dmah,1, dmah,2, …, dmah,m}.
-
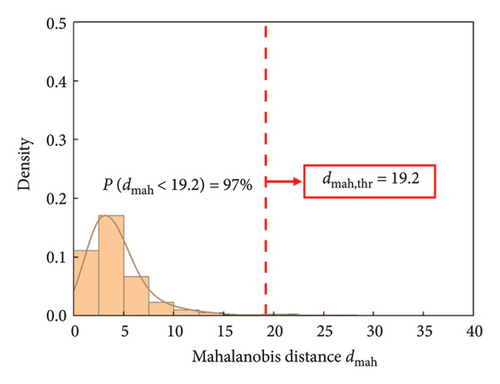
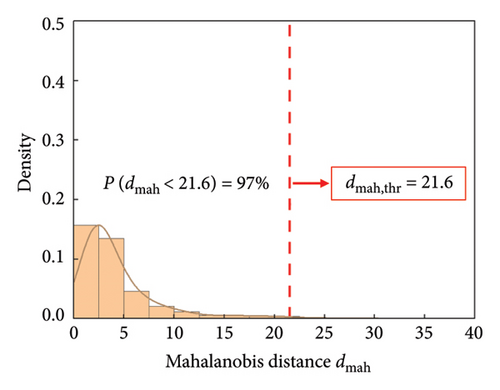
A threshold dmah,thr is determined from the estimated probability density function using kernel density estimation with a 97% survival probability, as shown in Figure 1. This threshold is selected to provide a robust criterion for identifying potential outliers that deviate significantly from the main data distribution.
-
Step II: Acquire dataset from an unknown state.
-
During the fatigue test, AE signals are acquired using the same AE measurement as in the PBL test. A feature matrix {A} = {a1, a2, …, an} is then constructed using the AE features listed in Table 1, where ai represents the feature vector of the ith recorded signals from the actual measurement test. Subsequently, the MD di between ai in {A} and {A0} of the “damage” dataset is calculated as the damage indicator:
(3) -
Step III: Perform damage diagnosis.
-
If the damage indices di exceed the selected threshold dmah,thr, the outliers are associated with a safe state, as the reference dataset corresponds to a “damage” condition. Conversely, if di < dmah,thr, the acquired data indicates the presence of damage.
| Features | Symbol | Unit |
|---|---|---|
| Peak frequency | PeakFRQ | kHz |
| Central frequency | CenFRQ | kHz |
| Partial power 2 [80–200 kHz] | PP2 | % |
| Partial power 3 [200–300 kHz] | PP3 | % |
| Partial power 4 [300–500 kHz] | PP4 | % |
3. Experimental Set-Up
3.1. CT Specimens
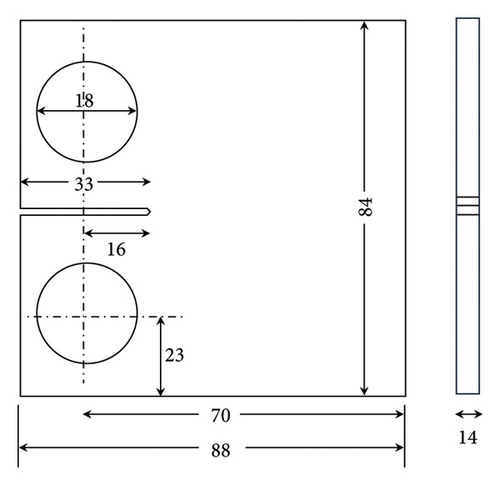
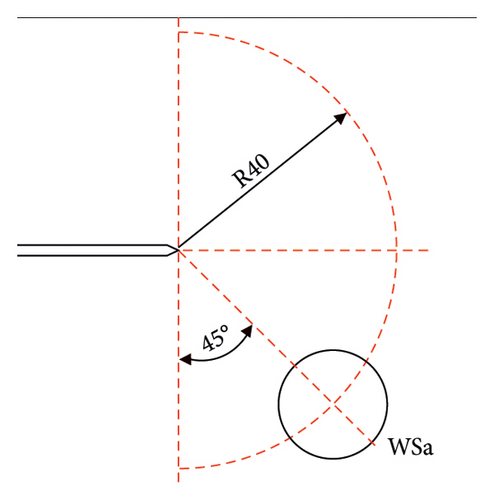
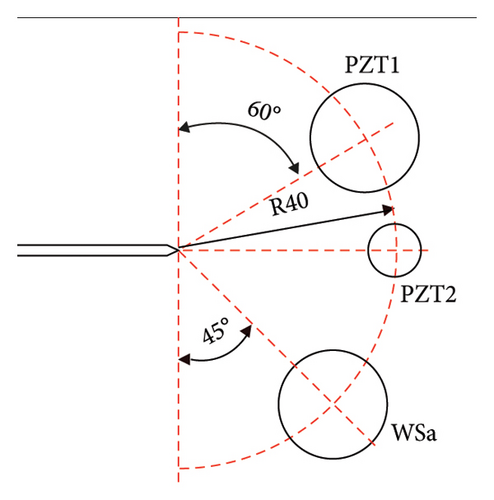
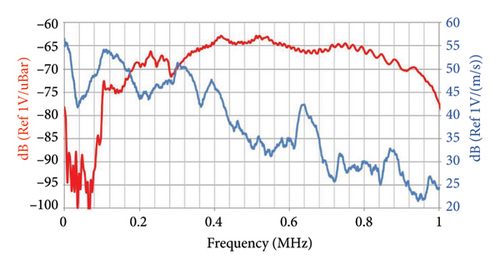
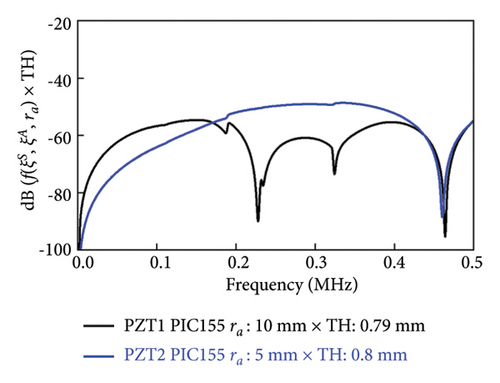
Figure 2(a) depicts the geometry of the CT specimens manufactured from S355 steel. The experimental measurement was conducted in two phases. In the first phase, PBL tests were performed at the notch tip of the CT specimens to generate signals indicative of crack initiation (see Figure 2(b)). A MISTRAS AE system, supplied by the Physical Acoustic Corporation (PAC), was employed to record the “damage” dataset. Signals were captured at a sampling rate of 5 MSPS, with a threshold set at 50 dB and a 40 dB preamplifier. Two CT specimens with different sensor layouts were utilized to investigate the effect of sensor type on measurement, as shown in Figure 3. The sensors were placed at a uniform distance of 40 mm from the tip to ensure consistent propagation distances for each sensor. This study utilized one WSα wide-band AE sensor and two PWAS: PZT1 and PZT2. Their frequency sensitivities and properties are detailed in Figure 4 and Table 2. The sensitivity response of the WSα sensor is provided by the manufacturer [53]. For PZT1 and PZT2, an analytical function was developed to estimate their output [54, 55].
| Parameters | WSα | PZT-1 | PZT-2 |
|---|---|---|---|
| Weight (g) | 32 | 1.90 | 0.49 |
| ra (mm) | 9.5 | 10 | 5 |
| TH (mm) | 21.40 | 0.79 | 0.80 |
| Material | PZT-5A [52] | PIC155 | PIC155 |
| g31 × 10−3 (Vm/N) | −12.4 | −12.9 | −12.9 |
- Note: ra and TH are the radius and thickness of selected sensors, respectively. g31 is the piezoelectric voltage constant.
In the second phase of the experimental measurement, a standard fatigue test was conducted on the same specimen under constant-amplitude tensile loading. The fatigue tests were performed under load-controlled conditions using a hydraulic Instron testing machine (with a loading frequency of 10 Hz, Rs = 0.25, max tensile load Fmax = 20 kN, minimum tensile load Fmin = 5 kN). Here, Rs represents the ratio of the maximum to minimum load levels. The test set-up is illustrated in Figure 5. To support AE interpretation, 2D digital image correlation (DIC) and a crack propagation gauge were used during the fatigue tests.
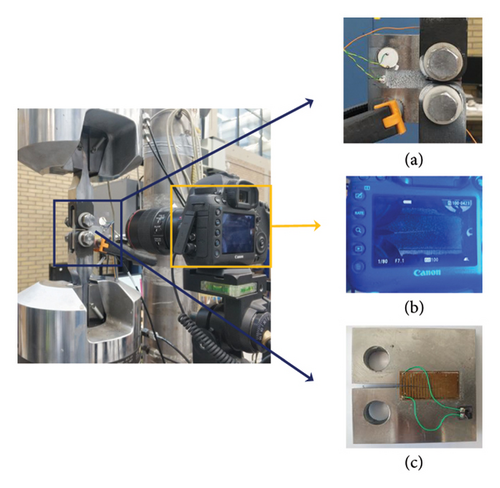
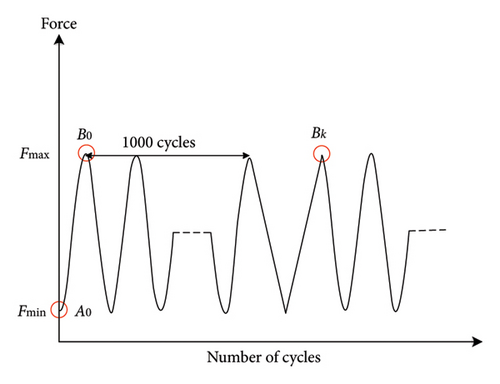
The DIC method allows for capturing high-resolution strain fields on the surface of an object. Previous research has highlighted the potential of integrating AE and DIC techniques for SHM [56, 57]. The DIC system comprises a high-speed camera, a backlight source, and a speckle pattern sprayed on the specimen surface. The camera was positioned perpendicular to the test specimen to capture the planar displacement of the speckles. These images were then postprocessed using GOM DIC software. DIC images were captured at the maximum tensile load Fmax at intervals of 1000 cycles to monitor the evolution of surface strain during the fatigue test. Synchronization between the DIC system and the loading stage was achieved through the Instron testing machine’s controller, which triggered image capture precisely when the load reached Fmax. This ensured accurate timing and eliminated any discrepancies between the loading stage and the DIC capturing process. The load history of the fatigue test is shown in Figure 6. Specifically, the trigger signal was configured to initiate image acquisition exactly at the peak load of the fatigue cycle at intervals of 1000 cycles. The image labelled B0 corresponds to the strain field at the maximum load of the first cycle, while Bk represents the image captured after every kth interval. The accuracy of DIC measurement depends on the quality of speckle pattern applied to the surface of the specimen [58].
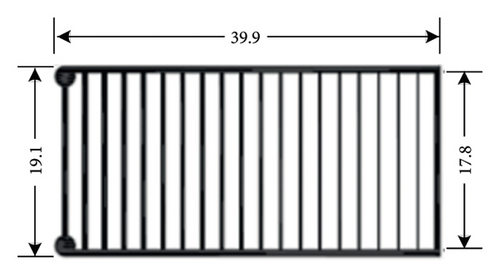
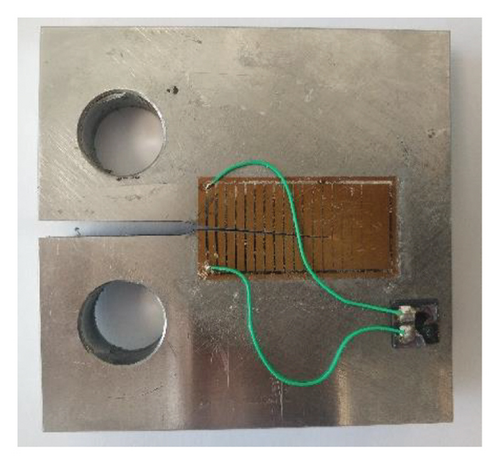
In contrast to DIC, crack propagation gauges provide a more direct measurement of crack lengths [59]. A crack propagation gauge (TK-09-CPC03-003/DP) was mounted on the polished surface at the back of the specimen, as depicted in Figures 5(c) and 7. The gauge consists of twenty vertical resistor strands with a centerline distance of 2.03 mm. Measurements from the crack propagation gauge were used to verify the accuracy of the DIC measurements.
3.2. Segment Specimen With C1-WC
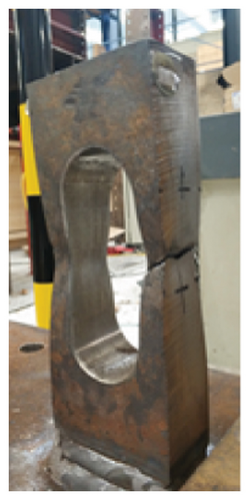
Figure 8(a) illustrates the geometry of the C1-WC. The upper and lower segments are assembled to the cover plates using two types of connections: pin connection and wedge connection. Elongated holes are machined into both the lower segment and the cover plates. The lower segment is identified as the critical component, as evidenced by the failure mode observed during tensile testing (Figure 8(b)). Therefore, four PWAS were installed on the internal flat surface of the lower segment to monitor the damage. Similar to the experimental procedure for the CT specimens, both PBL and fatigue tests were conducted on the C1-WC. The exact position of crack nucleation was unknown prior to the fatigue tests. To collect the “damage” dataset for the C1-WC, pencil leads were broken along the marked red line at the edge of the overall hole of the lower segment pre-assembly, as shown in Figure 8(c). To accurately identify PBL signals, the WSα sensor was used as the reference sensor [55]. The detailed layout of the PWAS is shown in Figure 9(a). The same AE measurement system used for the CT specimens was employed.

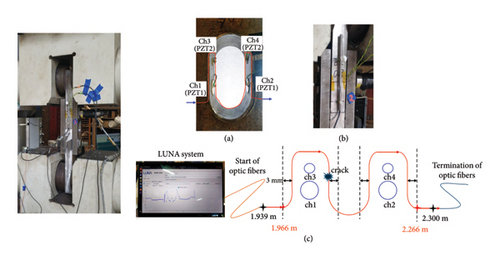
After assembling the segment specimen, a fatigue test was conducted as the second phase, as depicted in Figure 9. A critical tensile load of 470 kN was defined for the C1-WC based on its unique design, with a bolt pretension force of 80 kN [20]. Axial tensile cyclic fatigue loading was applied with a load ratio Rs of 0.1 and a maximum force Fmax of 450 kN. This loading condition was selected to closely align with the critical load, ensuring the design fatigue load was approximately represented.
To complement the AE measurement with four PWAS (Figure 9(a)), the linear variable displacement transducer (LVDT) (Figure 9(b)) and distributed optical fiber sensors (DOFS) were used to measure deformation (Figure 9(c)). While DIC is sufficient to characterize surface damage, it is limited in efficiently capturing internal microscopic behaviour [5]. Therefore, DIC was not employed for fatigue damage monitoring of the C1-WCs. Instead, two external LVDTs were attached to the midsection of the lower segment to measure the elongation externally.
DOFS technology enables the measurement of strain distribution with thousands of sensing points along a structure [60, 61]. The occurrence of structural damage can be detected by identifying variations in the strain field. In this study, a single-mode pigtail optic fiber (G652) from SQS Fiber Optics was adhesively bonded to the surface of the internal lower segment, as illustrated in Figure 9(c). Ensuring high-quality adhesion of the optical fibers to the surface is critical for accurate measurements. Due to surface roughness along the edge of the lower segment’s hole, the fiber was bonded along a line positioned 3 mm inward from the edge to maintain optimal contact. The distributed strain along the overall hole was recorded using a LUNA Optical Distributed Sensor Interrogator (ODiSI 6104). DOFS measurements were acquired at an acquisition rate of 31.25 Hz and a spatial resolution of 0.6 mm. The start and end points of the fibers are shown in Figure 9(c). It is important to note that no strain was detected between DOFS coordinates 0.000 m and 1.966 m. The fiber in this section was not bonded to any surface, which resulted in the absence of measurements throughout the test. The system began recording data from the DOFS coordinate at 1.966 m and continued up to 2.266 m. A coreless fiber was incorporated at the end of the fibers to terminate the measurement and minimize noise from unwanted reflections.
4. Damage Monitoring of CT Specimens
4.1. DIC Approach
Figure 10 shows the strain nephogram of CT-1 obtained from DIC measurements. The image (B0) captured at the maximum load during the first cycle is used as the reference stage. The initial deformation induced by Fmax is disregarded to concentrate solely on the deformation resulting from the crack. The longitudinal strain along the y-direction is analyzed using the reference field. The high-strain region near the crack tip is a characteristic indicator of crack initiation. However, a standardized threshold for the strain value that definitively identifies the crack tip has not yet been established.
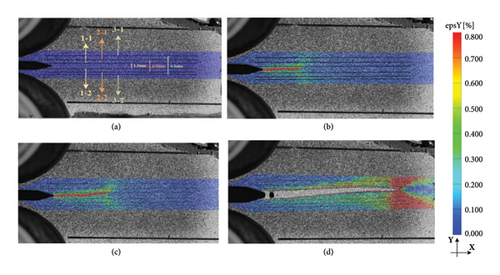
To identify the crack tip, three pairs of horizontal lines are drawn as distributed virtual extensometers, as illustrated in Figure 10(a). Decreasing the distance between the lines enhances the resolution of the measurements. Among the three pairs, the first pair (lines 1-1 and 1–2) offers the highest resolution. However, once the crack tip moves beyond the region covered by the current pair of lines, it is essential to switch to the next pair to ensure continued precise identification. For instance, the crack tip exceeds the region between lines 1-1 and 1–2 after reaching 1.40 × 10⁵ cycles (Figure 10(b)). Subsequently, measurements using lines 2-1 and 2-2 should be used to identify the crack tip between 1.40 × 10⁵ and 1.63 × 10⁵ cycles (Figure 10(c)).
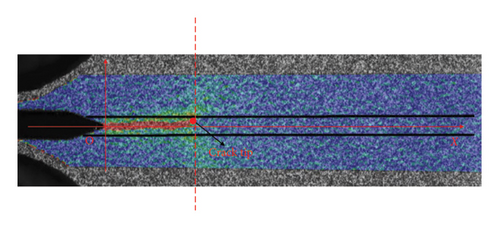
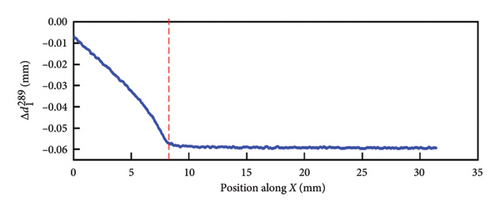

Figure 11(a) presents the image captured at 1.40 × 10⁵ cycles (the 289th images) for illustrative purposes. The plot of versus the X axis is shown in Figure 11(b), where a sudden change in the slope of is observed at the boundary of the high strain field, indicated by the dotted line in Figure 11(a). This abrupt change occurs because a negligible distance difference suggests no variation between the current and the reference images. The ratio is calculated to more accurately pinpoint the transit point in the slope of , which corresponds to the position of the crack tip, as shown in Figure 11(c).
4.2. Results of Crack Propagation Gauges
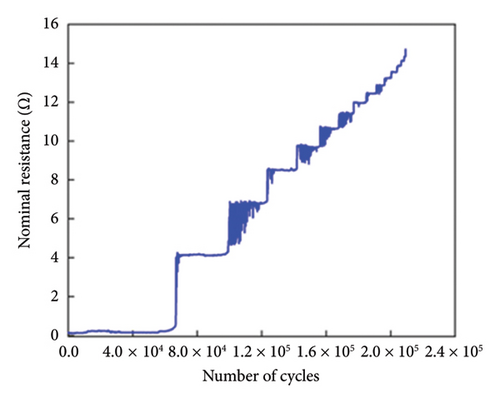
As discussed in Section 3.1, the DIC-based crack tip identification approach is validated using data from crack propagation gauges. In these gauges, the crack tip is detected by a sudden increase in resistance when the crack reaches the vertical strands (see Figure 12). As the crack extends to a critical position beneath the gauge, it intermittently disrupts contact with the remaining conductor tracks. This disruption causes fluctuations in the resistance values measured by the gauge, as shown in Figure 12(a). It is important to note that the crack length in this study refers to the projection of the actual crack along the X axis (see Figure 11(a)). Since the first vertical line in the gauge is positioned 1.8 mm away from the edge, the gauges cannot capture the onset of crack formation. In contrast, DIC provides early detection of crack initiation. Figure 13 compares the crack length obtained using DIC and crack propagation gauges for the two tested two CT specimens. In Figure 13(b), an offset is observed in the crack length versus fatigue cycles curve obtained from DIC and crack gauges for CT-2. This offset can be attributed to manufacturing tolerances in the CT specimen, as the crack gauges and the DIC system measure the crack length from opposite sides of the specimen. Small discrepancies in the crack tip position caused by these tolerances may lead to an initial mismatch between the two measurement methods. Furthermore, the crack gauge edge may not be precisely aligned with the crack tip, resulting in a delay in the crack length measurement recorded by the gauge. Despite this offset, the crack propagation trends from both methods converge as the number of fatigue cycles increases, demonstrating consistent behavior throughout the test. The strong agreement between the results from DIC and the crack gauges confirms the reliability of using DIC to identify the number of cycles corresponding to crack initiation.


4.3. AE Monitoring
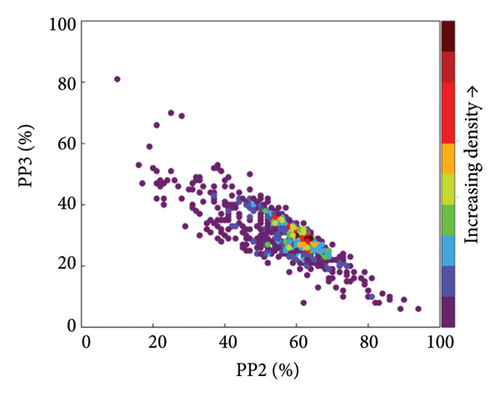
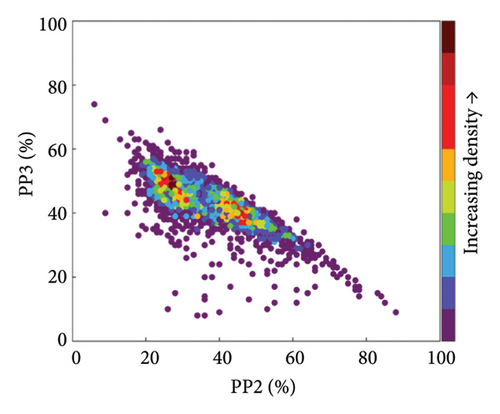
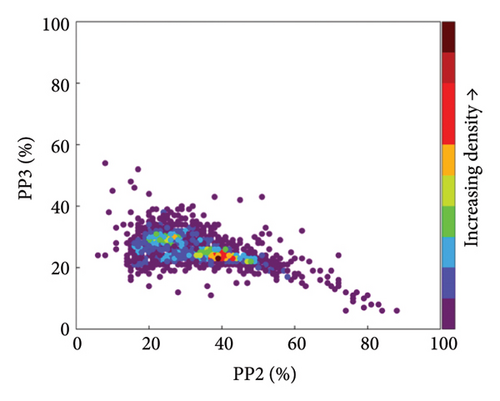
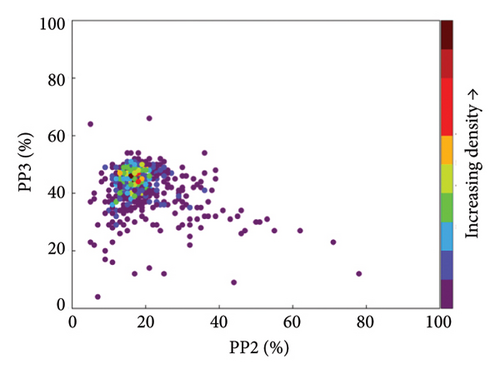
A total of 1500 PBL tests were manually performed on CT-1 and CT-2, with an approximate interval of 5 s between tests. Detailed information regarding the PBL procedure is provided in Step 1 of Section 2. As described in Section 2, the feature matrix {A0}, which includes PP2, PP3, PP4, peak frequency, and central frequency, was obtained. A density plot is used to visualize the distribution of the feature matrix. Figure 14 displays the density plot of PP2 and PP3 from the PBL signals recorded by all sensors. The “hot” regions indicate high density, while the “cold” regions denote low density. Dense regions in the feature matrix distribution likely contain damage-related signals. The distance matrix {D} is then calculated by measuring the MD between the feature vector of each observation and the reference dataset. Figure 15 shows the histogram of the distance matrix for the reference dataset, along with the determined threshold dmas,thr.
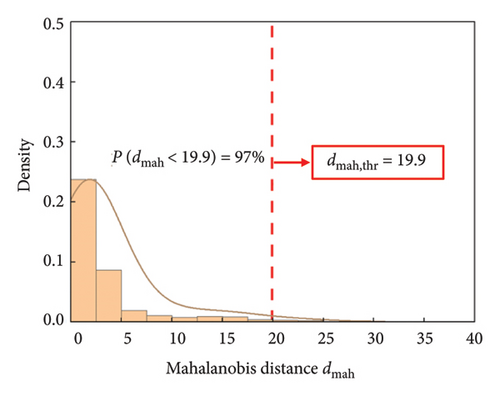
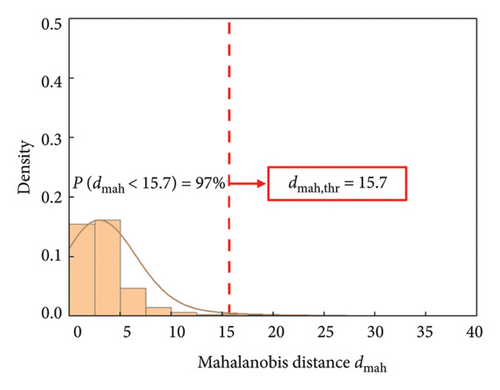
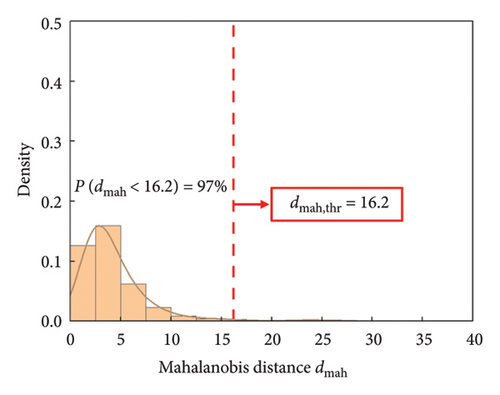
After establishing the threshold dmah,thr from the “damage” state identified through PBL test, the AE signals from the fatigue tests were analyzed. Using the DIC results from Figure 13 as the reference, AE signals up to 3.0 × 10⁴ cycles were examined to focus on the early detection of crack initiation. The feature matrix {A} for the acquired AE signals was calculated, incorporating parameters such as PP2, PP3, PP4, peak frequency, and central frequency. The MD di between the features of the ith acquired signals and {A0} was then computed using equation (3). Figure 16 illustrates the variation of di with the number of cycles. The results indicate that the PWAS recorded fewer AE events compared to the WSα sensor, which is consistent with previous findings reported in [26]. Crack nucleation is assumed to occur when the MD value falls below the defined threshold. The corresponding threshold values for each case are highlighted in Figure 15. It is found that PWAS, when used in conjunction with the proposed approach, can provide detection results as efficient as those of the WSα sensor (see Figures 16(b), 16(c), and 16(d)).
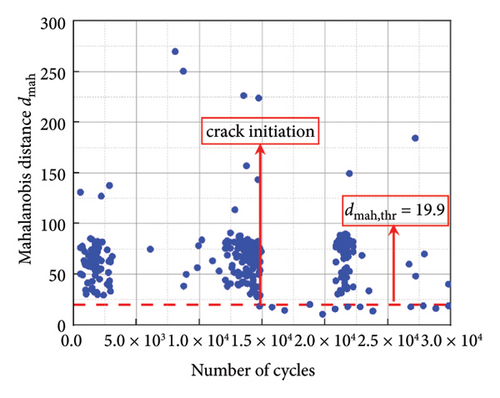
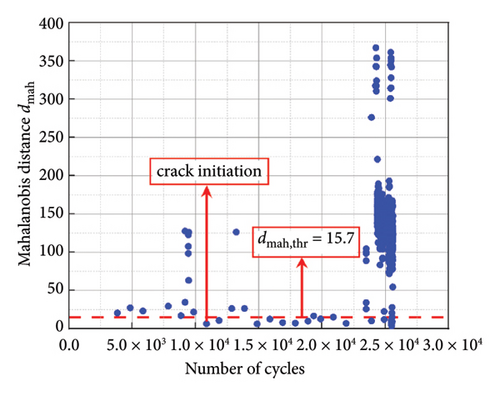
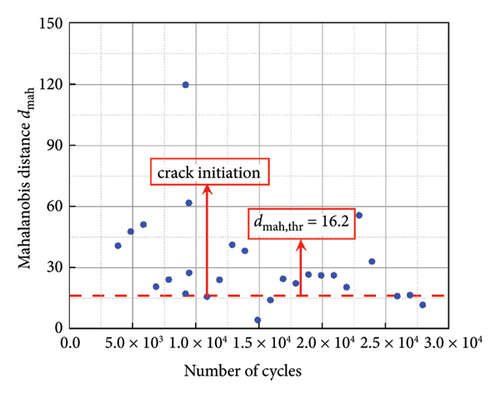
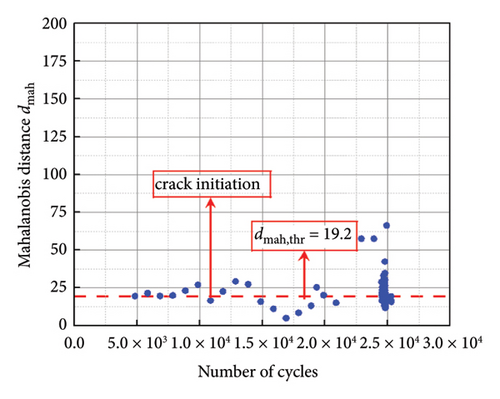
Table 3 summarizes the number of cycles to crack initiation detected by DIC and AE for the CT specimens. It is observed that there is a difference in fatigue initiation life between CT-1 and CT-2. This variation can be attributed to material inhomogeneity [62, 63]. Even within the same steel grade, variations in manufacturing processes or microstructure can influence fatigue behavior. Factors such as grain size, phase distribution, and inclusion content can affect fatigue resistance and initiation times, leading to discrepancies in performance despite using the same material grade.
| Specimens | Measurement techniques | |||
|---|---|---|---|---|
| Acoustic emission | DIC | DOFS | LVDT | |
| CT-1 | 1.47 × 10⁴ | 1.63 × 10⁴ | — | — |
| CT-2 | 1.09 × 10⁴ | 1.35 × 10⁴ | — | — |
| C1-WC | 3.39 × 10⁴ | — | 3.93 × 10⁴ | 5.47 × 10⁴ |
5. Early Warning for C1-WC
5.1. Results of DOFS and LVDT Measurement
The failure modes of the C1-WC specimen under fatigue loading are illustrated in Figure 17. Crack initiation occurred at the edge of the hole in the lower segment. As the crack propagated, it entered a stable crack growth zone. Once the crack reached a critical size, the specimen could no longer sustain the applied load, leading to a sudden fracture of the C1-WC.
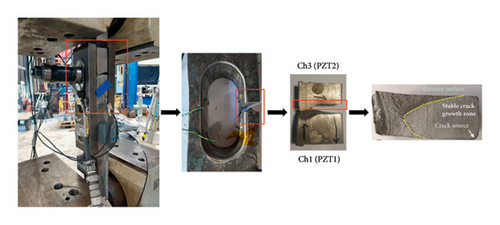
The approximate location of the crack source can be inferred from Figure 17. The effective length of the optical fibers covering the crack source area was confirmed to be between x = 2.0456 m to x = 2.0482 m, where x represents the DOFS coordinate relative to the starting point of the optical fibers, as shown in Figure 9(c). The strain measured within this range during the fatigue test is depicted in Figure 18. The spacing between the distributed data points collected along the fiber is 0.6 mm. A gradual increase in the measured strain is observed at the selected data points. This increase is caused by the onset of slight plastic deformation at the beginning of the fatigue test, which corresponds to cyclic hardening of the material. A significant change in the rate of strain increase at x = 2.0482 m was detected after approximately 3.93 × 10⁴ cycles. This change is interpreted as an indication of crack initiation. The sudden increase in strain is attributed to stress concentration near the crack tip.
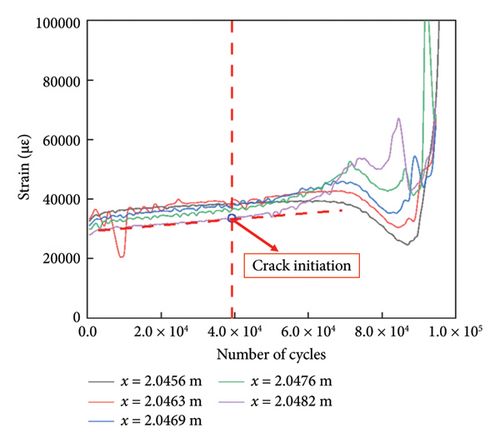
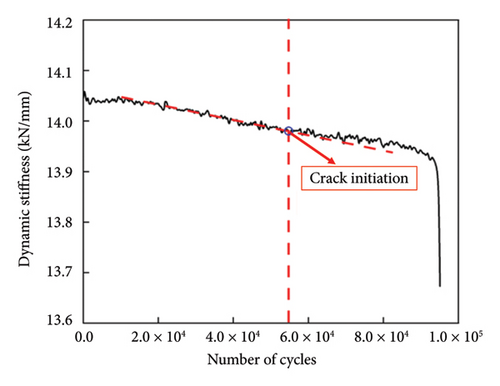
Figure 19 displays the dynamic stiffness obtained from the LVDT measurements. The stiffness is calculated as the ratio of maximum load to maximum deformation recorded by the LVDT. A sudden drop in stiffness signifies the onset of crack initiation. However, as the LVDT was affixed to the exterior surface of the specimen, its sensitivity to detect cracks originating from the interior is limited compared to the DOFS measurements.
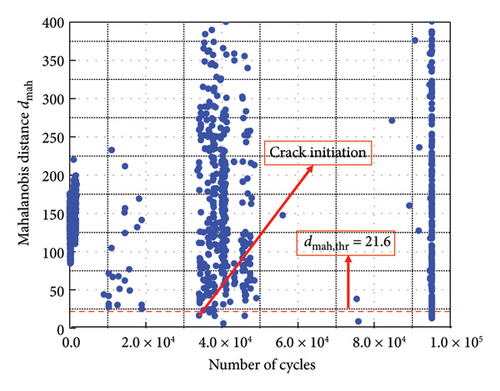
5.2. Results of AE Measurement
In the context of AE monitoring of C1-WCs, 1200 PBL signals were recorded prior to the assembly of the specimen. As shown in Figure 17, Ch3 is located closest to the crack damage region (also depicted in Figure 9). The density plot of two frequency-domain features, along with the distribution of the distance matrix {D} of Ch3 from PBL signals, is shown in Figure 20. The damage identification threshold is computed to be 21.6, and the number of cycles to the initiation of the crack is estimated to be 3.39 × 10⁴ (see Figure 21). Table 3 presents the detection results obtained using various monitoring techniques for the C1-WC specimen. Among these methods, the AE technique provides significantly earlier warning signs compared to the LVDT measurement. While the DOFS method offers comparable detection performance, it has a limited strain measurement range, potentially missing the full range of strains experienced by the metal material during fatigue loading [64]. Moreover, DOFS are susceptible to mechanical damage, such as bending, crushing, or stretching, which can lead to permanent signal loss or reduced accuracy [65]. Additionally, the installation and maintenance of DOFS can be costly, particularly over long distances or in harsh environments, limiting their practicality in certain applications.
5.3. Further Discussion
The findings show that the proposed AE-based method, combined with PWAS, effectively detects and monitors fatigue damage in mechanical connections. By leveraging prior knowledge of critical areas, identified through numerical analysis, the method accurately pinpoints potential damage sites that require attention. After determining these critical areas, baseline datasets can be generated using PBL tests on plates with the same thickness and material, rather than full-scale structures, reducing costs and complexity while maintaining accuracy. This approach is particularly suitable for scenarios with known damage types, especially when surface crack initiation is expected. By using signals from a simulated damaged state as the reference, the method improves sensitivity to early-stage damage, compared to relying solely on healthy conditions. The proposed methodology assumes that monopole PBLs at the edge of the plate generate waves that most closely resemble those produced by dipole-type sources near the surface. This foundational premise is critical for ensuring the methodology’s accuracy in detecting surface damage. Successfully validating this hypothesis would establish the feasibility of applying the methodology to other materials. However, for unknown or complex damage patterns, or materials subjected to diverse loading conditions, further refinement is needed to expand the method’s applicability. These refinements include adapting the methodology to various damage scenarios, such as multi-site damage and damage mechanisms under different stress conditions, as well as incorporating data-driven techniques to enhance detection.
The study did not account for environmental effects, operational noise, or the influence of connections to supports and nearby panels, factors that will be addressed in future research. To enhance the method’s robustness under real-world conditions, advanced signal processing and noise filtering techniques need to be integrated, thereby improving its applicability to SHM. Previous research has also demonstrated the use of PBL signals to develop effective noise filtering methods [40, 41], which could be beneficial for mitigating these challenges in our future work.
6. Conclusions
The objective of this paper is to explore the use of AE monitoring with PWAS for early fatigue damage detection in restricted-access areas using a proposed baseline-based approach. Experimental validation on CT specimens and C1-WC specimens confirms the effectiveness of this approach. Additionally, the integration of supplementary techniques, such as DIC, crack propagation gauges, and DOFS, further enhances the AE monitoring results.
The novelty of this work lies in developing a benchmark model based on a ‘damage’ state using PBL signals. By mapping damage-sensitive features to MD and setting a 97% probability threshold, the method accurately distinguishes between normal and damaged states. This approach provides significantly earlier damage detection than traditional methods, offering timely warnings for fatigue crack initiation. For CT specimens, the proposed AE monitoring method detects damage 10% earlier than the DIC method. In the case of C1-WC specimens, both AE monitoring and DOFS outperformed LVDT measurements in identifying fatigue damage, with AE and DOFS providing 38% and 28% earlier crack detection, respectively. However, given the limitations of DOFS, including their restricted strain measurement range and susceptibility to mechanical damage, AE monitoring proves to be the more reliable and effective option.
Additionally, a new DIC-based technique for tracking crack propagation in CT specimens was introduced and validated with crack gauges. This method enhances the accuracy of crack tracking and holds potential for broader application in future studies. DIC has proven to be an effective tool for objectively and adaptively identifying crack tips, making it a valuable complementary technique to AE monitoring.
Nomenclature
-
- OWTs
-
- Offshore wind turbines
-
- C1-WC
-
- The C1 wedge connection
-
- AE
-
- Acoustic emission
-
- PWAS
-
- Piezoelectric wafer active sensors
-
- MP
-
- Monopile foundation
-
- TP
-
- Transition piece
-
- NDT
-
- Nondestructive testing
-
- SHM
-
- Structural health monitoring
-
- SNR
-
- Signal-to-noise
-
- MSC
-
- Magnitude squared coherence
-
- PBL
-
- Pencil leads breaking
-
- PP
-
- Partial power
-
- FFT
-
- Fast-Fourier transform
-
- MD
-
- Mahalanobis distance
-
- PAC
-
- Physical Acoustic Corporation
-
- DIC
-
- Digital image correlation
-
- LVDT
-
- Linear variable displacement transducer
-
- DOFS
-
- Distributed optical fiber sensors
Conflicts of Interest
The authors declare no conflicts of interest.
Author Contributions
Lu Cheng: conceptualization, methodology, formal analysis, investigation, and writing – original draft. Ze Chang: conceptualization, methodology, and writing – review and editing. Roger Groves: conceptualization, supervision and writing – review and editing. Milan Veljkovic: conceptualization, supervision, and writing – review and editing.
Funding
This work was supported by CSC Scholarship Council under grant number 201806060122.
Acknowledgments
The authors gratefully acknowledge that this manuscript is based on the first author’s thesis, titled “Assessment of bolted connections for supporting structures of offshore wind turbine towers,” submitted to TU Delft for the Doctor of Philosophy in 2023 [66]. The authors gratefully acknowledge Dr. Jincheng Yang for his guidance with the Luna system. They also extend their gratitude to the technicians from Steven Lab II at TU Delft for their invaluable assistance.
Open Research
Data Availability Statement
The data that support the findings of this study are available from the corresponding author upon reasonable request.


