An Advanced Computer Vision Method for Noncontact Vibration Measurement of Cables in Cable-Stayed Bridges
Abstract
With the development of computer and image processing technologies, computer vision (CV) has been attracting increasing attention in the field of civil engineering measurement and monitoring. Cables in slender structures have unique challenges for CV-based vibration measurement methods, such as low pixel proportion and sensitivity to environmental conditions. This study proposes a noncontact vibration measurement method based on a line tracking algorithm (LTA). The robustness and applicability of the proposed method under varying image resolutions, signal-to-noise ratios, and cable inclination angles were systematically evaluated through experimental test of a cable specimen. To validate the effectiveness of the proposed method for practical detection applications, a vibration test on a scaled cable-stayed bridge model was carried out. The numerical result indicates that the LTA provides high reliability and accuracy values of the cable force. The maximum errors of the first-order self-vibration frequency and cable force of the scaled cable-stayed bridge is 0.99% and 2%, respectively. The proposed method maintains strong stability across various conditions, which provides a reference for long-term structural health monitoring of cable-stayed bridges.
1. Introduction
Stay cables in cable-stayed bridges provide a multipoint elastic support to the main girders and compose a statically indeterminate structural system along with pylons and auxiliary piers [1]. However, cables are especially vulnerable to damage from critical factors such as environmental corrosion, fatigue loading, and wind-induced vibrations [2–5]. In the lifetime of a cable-stayed bridge, cables are prone to cumulative damage, resulting in a large number of cable breakage accidents, which calls for attention from bridge maintenance departments [6, 7]. In the case of widespread cable damage and continuous deterioration of service performance, it is of great significance to accurately determine the dynamic characteristics and efficiently estimate cable force [8, 9].
Numerous studies have demonstrated that cable vibration characteristics can directly reflect and impact service performance and structural safety. Vibration frequency is a critical indicator of cable force degradation and damage severity needing accurate measurements [10–13]. Traditional methods for extracting structural dynamic parameters typically involve installed contact sensors, such as accelerometers or displacement sensors [14]. These methods face challenges such as poor measurement conditions, high installation costs, and the difficulty of multipoint synchronous measurements, which add to the difficulty of real-time monitoring [15, 16]. Noncontact methods, such as microwave radar [17, 18] and laser Doppler vibrometers (LDV) [19, 20], enable sub-millimeter displacement measurements [21]. The LDV offers micron-level measurement precision and is suitable for precise displacement measurement. However, it has limitations in multipoint target synchronization, long-range displacement measurement, and resistance to environmental vibration noise, along with high equipment costs. In contrast, microwave radar technology shows excellent environmental adaptability and offers longer effective measurement distances. However, the in-plane measurement precision is limited, and the quality of reflected echo signals significantly affects the measurement results. Although LDV holds an irreplaceable position in the field of noncontact displacement measurement, the introduction of computer vision (CV) technology could offer an innovative and competitive method in the future. In multipoint and large-scale structural measurements, it provides significant advantages and broad application prospects.
With advancements in image equipment and video processing technologies, CV-based measurement methods have emerged as a noncontact technique that has garnered significant attention. Compared to traditional methods, CV-based methods have great advantages, including noncontact measurement, high efficiency, real-time capability, and broad applicability [22]. In recent years, CV-based techniques have been increasingly applied across disciplines and have seen initial success in areas such as finite element model updating [23], crack extension monitoring [2–26], deflection measurement [27], damage detection [28], cable force assessment [29], and structural modal analysis [30]. Noncontact vibration measurement techniques using CV include feature point matching, geometric matching, template matching, optical flow algorithms, and digital image correlation (DIC) [31–35]. These methods can effectively capture parameters such as structural dynamic displacements, natural frequencies, and modal vibration patterns, providing a novel solution for structural displacement monitoring and modal identification in bridge engineering. In terms of cable vibration measurement, scholars have made considerable progresses using these methods [36–45]. Despite significant advancements in using CV technologies in structural vibration identification and displacement measurement, several limitations remain. The accuracy of template matching algorithms heavily depends on the quality of image capture. In addition, the proportion of the target object in the image affects the template matching score, reducing accuracy for objects like cables that occupy a small proportion of the image. Optical flow methods require calculating the displacement of every pixel in the image, resulting in enormous computational load. Its performance can be affected by scene complexity, occlusions, and image noise. DIC is a noncontact image measurement technique which integrates modern optoelectronics and image processing technology. It is effective in structural displacement measurement, vibration fatigue testing, material performance evaluation, and strain monitoring [46–51]. However, DIC has limitations with displacement measurements on objects lacking distinct textures or structural features. In such cases, expensive targets or high-contrast speckles have to be placed on the structural surface. The size and density of these speckles are critical to the accuracy of the monitoring results. Furthermore, installing such targets or speckles on civil structures, particularly bridges, can affect their overall appearance and contradict esthetic design considerations.
In recent years, the line tracking algorithm (LTA) is a novel fully noncontact measurement method based on CV, designed to rapidly detect the centerline of linear objects and extracting sub-pixel level vibration displacements. Jiang et al. [52, 53] addressed the limitations of DIC technology in complex environments by innovatively proposing a CV-based LTA. They detailed the principles of this technology and applied it to the displacement measurement of railway contact lines. On this basis, Luo et al. [54, 55] enhanced the phase motion amplification algorithm, developing a broadband phase video motion amplification technique. Combined with the LTA, this approach was used to detect the vibration displacement of cables. Wang et al. [56] further advanced the field by incorporating deep learning into LTA and created a target-free detection system for cable vibrations in complex backgrounds, which effectively solved the precision limitations in harsh environments.
LTA is particularly well-suited for the vibration displacement detection of cables. However, research on the application of cable vibration detection remains insufficient. While some scholars have utilized this method for preliminary calculations of cable vibration frequency and cable force, detailed analysis of its internal parameters and robustness is missing, and no comprehensive study of the algorithm has been conducted. Because of the unique characteristics of the cable, when observed from a long distance, the proportion of the cable in the entire image is relatively small, and distortion introduced by the optical lens is inevitable. The goal of LTA is to locate the centerline of the cable and track its sub-pixel displacement changes. However, existing studies often neglect the effects of camera distortion. Without proper calibration, the accuracy of cable vibration displacement monitoring can be compromised, leading to deviations in the estimation of cable force.
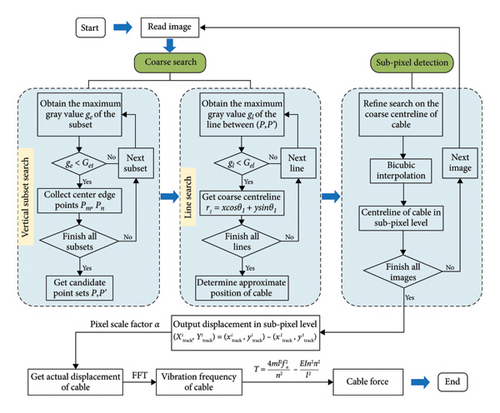
In view of the above issues, this study proposes a noncontact vibration measurement method based on LTA and evaluates the robustness of the LTA under different imaging parameters. The overall framework of the study is shown in Figure 1. The main procedures are: (1) a fixed camera captures the vibration video, and camera calibration methods are utilized to calculate the internal and external parameters; (2) the sub-pixel centerline of the cable is detected in each frame of the calibrated images using LTA, and the positional changes of tracking points are recorded to generate the vibration displacement; and (3) the vibration displacement obtained by the algorithm is processed using the Fast Fourier Transform (FFT) to extract the frequency spectrum, which is then used to estimate the cable force.
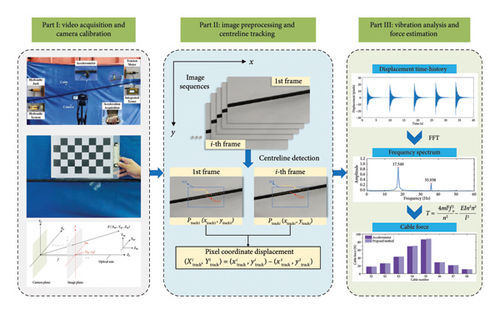
The main contents of this study are organized as follows: (1) Section 2 outlines the camera calibration theory and the method for calculating the pixel scale factor; (2) Section 3 describes the principles of displacement extraction using the LTA and the cable vibration theory; (3) Sections 4 and 5 present experimental study of a cable specimen and a scaled model of cable-stayed bridge; and Section 6 summarizes the conclusion of this study.
2. Theoretical Basis of Camera Calibration
In measuring cable force using CV technology, the first step is to capture the vibration videos of the cable under natural conditions or vehicle load excitation. Video acquisition can involve industrial cameras, cell phones, drones, and consumer-grade cameras. However, these devices share the common characteristic of converting three-dimensional objects into two-dimensional images through optical lenses, leading to distortion during the projection from real-world coordinates to image coordinates. The goal of camera calibration is to accurately estimate the camera’s intrinsic parameters, extrinsic parameters, and distortion coefficients. When the motion of an observed object is confined to a plane, a coordinate transformation method can accurately map 2D world coordinates to 2D image coordinates. Zhang’s camera calibration method [57], recognized for its ease of implementation, high accuracy, and ability to handle nonlinear distortions, has become a widely used tool in CV and image processing. This study employs the analytical method of a 2D plane calibration board to correct the image distortion caused by the camera lens.
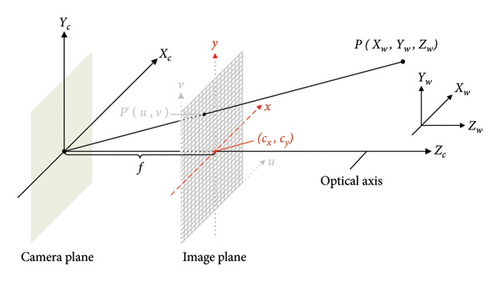
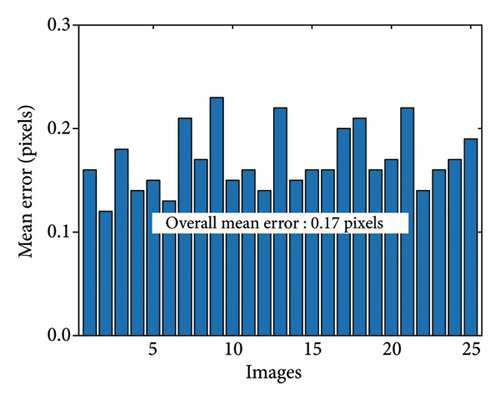
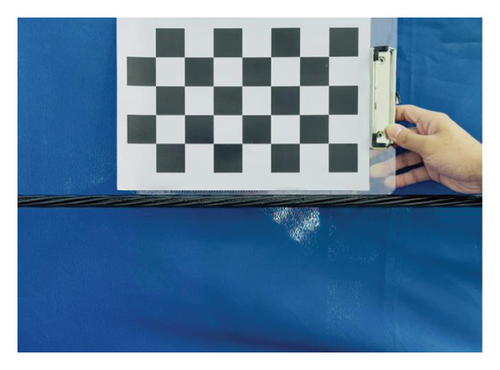
With a camera featuring a 30 mm focal length as an example, as shown in Figure 3(a), a 8 × 5 chessboard with a 35 mm square size was used for calibration, and 25 photos of the calibration board were taken from various angles. The Camera Calibrator toolbox in MATLAB was employed for calibration. Figure 3(b) lists the calibration results of each image, showing an average calibration error of 0.17 pixels, which indicates high reliability. This camera calibration method efficiently supports the batch processing of each frame in the captured cable vibration videos.

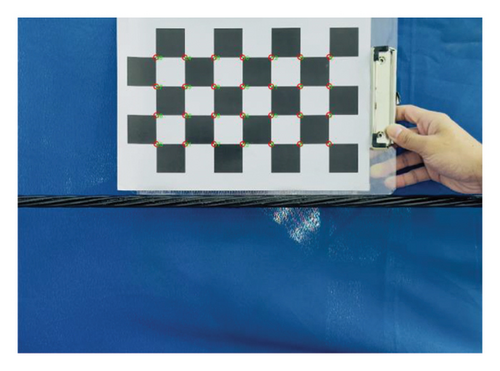
First, the camera was placed according to the pre-defined focal length and shooting distance for the experiment. Second, the calibration plate was positioned above the cable and aligned parallel to the lens plane. It is important to minimize calibration errors by ensuring that the checkerboard calibration plate is close to the cable and on the same plane. Finally, three to five images of the calibration plate and the cable were chosen. In addition, before calculating the pixel scaling factor, the camera calibration results for the specified focal length were applied to the captured images. As shown in Figure 4, corner detection was performed on the calibrated plate images to calculate the pixel coordinates of each corner in MATLAB platform. The pixel scaling factor αi for each image was determined after solving its calibration model. The average of the calculations from multiple images was taken as the pixel scale factor for the given experimental conditions.
3. Cable Force Estimation Based on LTA
3.1. Overall Framework
The proposed method applies the LTA to identify the sub-pixel of the cable in each frame. The vibration displacement is derived by tracking the movement of points along the centerline. Subsequently, the FFT is applied for time-frequency analysis to extract the vibration frequency of the cable. Finally, the cable force is calculated using the vibration frequency method. The specific implementation process is presented in Figure 5.
- a.
The cable is a straight line within region of interest (ROI);
- b.
There is sufficient intensity difference contrast between the cable and the background in the grayscale image; cable spans the ROI from left to right.
- c.
The cable spans the ROI from left to right.
In large-span cable-stayed bridges, the long length of the cables causes a sagging effect, leading to cable curvature. However, because of the high internal stress experienced by the cables, the sagging effect is usually not significant. For the cables within the field of view, their length typically constitutes approximately 1/10 to 1/5 of the total cable length. Given the small ROI range, the bending caused by the sagging effect can be considered negligible. Consequently, the cables within the ROI can be approximated as straight line segments. For the second assumption, video frames are typically converted into single-channel grayscale images to enhance computational efficiency. During on-site recording, appropriate shooting angles and exposure settings are chosen to improve detection accuracy, thus mitigating external influences during sampling. In most application scenarios, sufficient intensity contrast exists between the cable and the background. As for the third assumption, under environmental excitation, the cable typically does not experience large vibration displacements. The cable should ideally be centered within the ROI, extending across both the left and right edges to allow the algorithm to detect the endpoints and form a complete centerline. This section introduces the basic principle and detailed implementation process of the algorithm.
3.2. Coarse Search at the Pixel Level
Initially, the cable vibration video is calibrated, with the first calibrated frame selected as the reference frame. Based on the cable’s position in this reference frame, an ROI is defined, which remains consistent across subsequent frames. The coarse search consists of two parts: vertical subset search and line search.
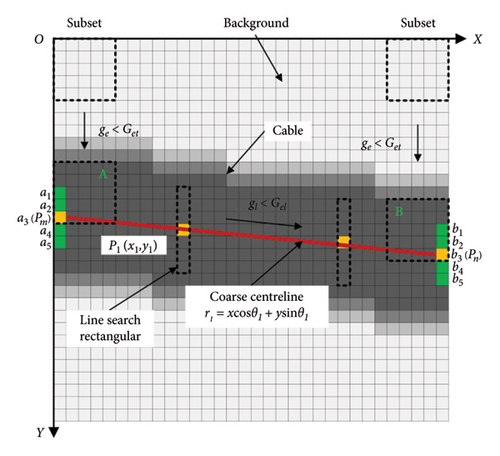
A grayscale image consists of individual pixels with varying intensity values. The vertical subset search serves to identify the left and right candidate endpoints of the cable within the entire image, resulting in a pixel-level candidate line and determining the approximate position. As illustrated in Figure 6, a two-dimensional coordinate system is established with the top-left corner of the image serving as the origin. First, a search subset is defined, which is typically square, as shown in the figure with a 5 × 5 black dashed box. The ROI or subset is then moved vertically on the left and right sides of the image for searching. The maximum intensity value ge is calculated in each subset range of the grayscale image. If ge < Get within the subset range, the center of the subset’s edge pixel is selected as the candidate endpoint of the cable. Get is the set image intensity threshold, which is typically set to the average intensity of the background within the cable range. The search subset is then moved down by one pixel, and the same operation is repeated to obtain several adjacent candidate endpoints in the vertical direction. This forms a candidate endpoint set, represented as a1 ~ a5, b1 ~ b5 in the Figure 6. The center point of the candidate endpoint set is taken as the candidate endpoint for the cable edge, as shown by Pm, Pn in Figure 6. Moreover, it should be noted that the width of the search subset must be smaller than the pixel value of the cable’s diameter.
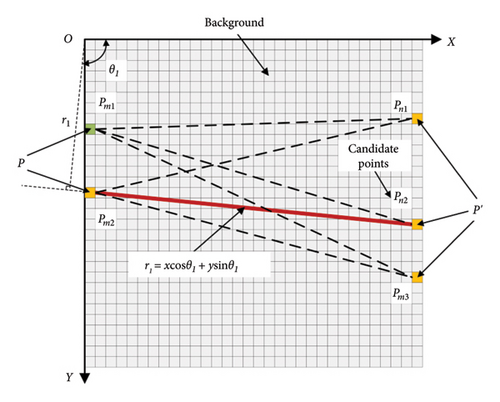
However, because of the varying positions of the cable and the influence of the shooting angle and surrounding environmental factors, the grayscale intensity of the background may sometimes be similar to that of the cable. Therefore, during the vertical subset search, multiple sets of candidate points may appear. It is necessary to perform the second step of the algorithm: line search. The purpose of the line search is to filter the multiple candidate endpoints obtained from the vertical subset search to retain only the cable endpoints. As stated in the first assumption, the cable in the image is assumed to be a straight line, and the gray values along the length of the cable are approximately uniform. For the combination of multiple point sets P and P′ obtained from the vertical subset search, the line with the maximum gray value is searched in their linear direction. As illustrated in Figure 7, a 1 × 7 rectangular window is constructed along the line formed by the left and right endpoints to search the area between the candidate endpoints Pm and Pn. The maximum line intensity value gl is compared to the linear intensity threshold Gel, and if gl < Gel along the line direction, the line is taken as a rough estimate of the cable’s position. Considering the possibility that the slope of the straight line does not exist in the search results, the polar coordinate linear expression in Hough transform is used, which is denoted as r1 = x cos θ1 + y sin θ1, where r1 represents the position of the image coordinate origin to the straight line, and θ1 denotes the angle between the x-axis and the shortest distance. Similarly, to avoid incorrect results, the linear search window is set smaller than the diameter of the cable.
3.3. Centerline Detection in Sub-Pixel Level
The coarse search process described above results in candidate endpoints and centrelines of the cable at the integer pixel level. However, pixel-level precision is insufficient for accurately extracting vibration frequencies. To further enhance the accuracy of centerline detection and the applicability of the method, sub-pixel detection is necessary. Unlike the coarse search process, the range for sub-pixel search is not the entire image but limited to a local area centered on the cable endpoints identified during the coarse search. Performing sub-pixel centerline detection after obtaining the approximate position of the centerline from the coarse search can significantly reduce the computational load and improve detection efficiency.
The main detection process is similar to the coarse search but utilizes bicubic interpolation to estimate intensity values at the sub-pixel subset, approximating the upper and lower edges of the cable, and precisely determining the center point within the search scope. In contrast to bilinear interpolation, which only interpolates the adjacent pixels of the target, the bicubic interpolation method employs a cubic polynomial to interpolate the 16 neighboring pixels (a 4 × 4 pixel block) surrounding the target. It yields smoother and more accurate fitting results, effectively preventing the occurrence of jagged edges in regions with significant changes in image intensity. Despite its higher computational complexity, the bicubic interpolation algorithm offers greater displacement accuracy, making it particularly suitable for sub-pixel level detection applications. The sub-pixel centerline detection should focus on the cable endpoints, and the search scope should exceed the cable’s diameter. To clearly reveal the working principle, the process is shown in Figure 8. Firstly, the appropriate size of the sub-pixel subset is selected, ensuring that the size is smaller than the diameter of cable. The sub-pixel search subset is a 7 × 7 square grid with a vertical step interval of 0.5 pixels, determining the upper and lower edges of the cable with 0.5-pixel resolution. Following the same criteria as in the vertical subset search, if the maximum intensity value ge within the sub-pixel search subset at a given position is less than Get, the subset is considered to be fully covered by the cable, and the centerline edge point of the subset at that location is selected as a candidate point. The search results in sub-pixel level candidate endpoints of the cable, as indicated by the green rectangle in the figure. Finally, since sub-pixel detection is performed after the coarse search, the gray-level variations within the search scope are minimal. Thus, these candidate endpoints are typically adjacent and continuous. Once all candidate endpoints within the left and right boundaries are identified, the center point of the sub-pixel candidate set is chosen as the endpoint for the sub-pixel centerline within that region. This corresponds to Pcentre1 (x1, y1) and Pcentre2 (x2, y2) in the figure, and the line connecting these two center points represents the precise centerline of the cable, denoted by r2 = x cos θ2 + y sin θ2.
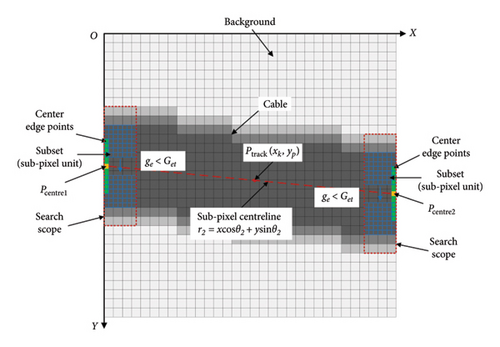
After acquiring the cable vibration displacement, use FFT to determine the natural frequency and estimate the cable force accordingly.
3.4. Frequency-Based Cable Force Estimation
4. Verification Study: Laboratory Test of a Cable Specimen
4.1. Test Setup
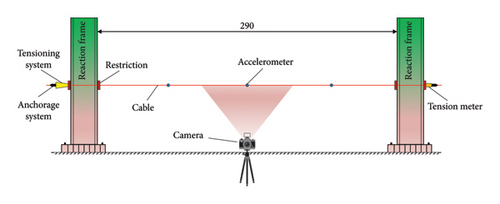
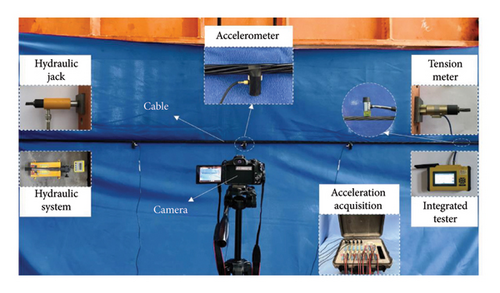
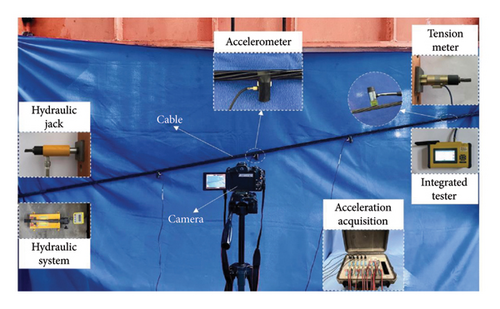
To verify the accuracy and applicability of the cable vibration response and force estimation method based on LTA, an experimental test of a cable specimen was carried out. The test setup and its schematic diagram are shown in Figure 9(a). A 1 × 7 steel strand with a nominal diameter of 15.2 mm was used as the test specimen, with a unit mass of 1.101 kg/m and a test segment length of 2.9 m. The vibration frequency of the cable was extracted using a fixed camera and accelerometers. Specific parameters of the test cable are shown in Table 1. The test setup is shown in Figure 9(b). The cable was fixed on a reaction frame, with the cable divided into an anchor end and a load end. The anchor end is equipped with a load cell and connected to an integrated testing system to record the cable force. The load end is tensioned using a through-heart hydraulic jack, with the force value controlled by the hydraulic system. Once the force value reaches the specified cable force, it is maintained for 2 min before final adjustments are made.
| Specification | Diameter (mm) | Section area (mm2) | Elastic modulus (N/mm2) | Tensile strength (MPa) | Line density (kg/m) |
|---|---|---|---|---|---|
| 5 mm 1 × 7 | 15.2 | 140 | 210,000 | 1920 | 1.101 |
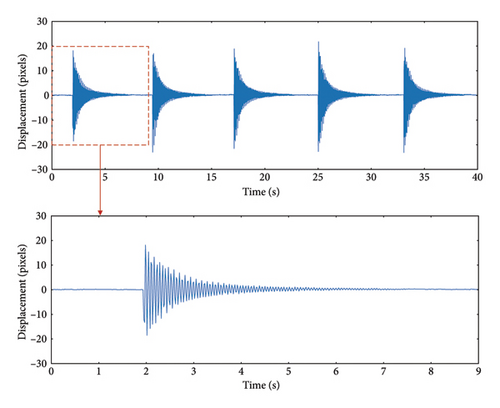
Three sets of vibration data under 5, 10, and 15 kN cable force were tested, respectively. A rubber hammer was used to strike the cable ends every 6-7 s to simulate external excitation of the cable. Accelerometers of model IEPE-1A111E, with a mass of 20 g, were installed at 1/4, 1/2, and 3/4 of the cable span, and the sampling frequency was set to 500 Hz. The camera was fixed 1 m away from the cable, with a video resolution of 1920 × 1080 pixels and a frame rate of 60 Hz, synchronizing the acceleration signals and cable vibration video under excitation. To better characterize the vibration displacement response of the cable, the mid-span of the cable was chosen as the shooting position. Meanwhile, in order to minimize experimental variability and errors, the influence of external factors such as lighting conditions or mechanical vibrations are eliminated; acceleration signals and vibration videos were collected three times for each experimental condition, with the average value used as the experimental result for that condition.
Three experimental groups were designed to study the applicability and robustness of the algorithm and to explore the impact of internal parameters and external environmental changes on the actual detection performance. By adjusting internal parameters, image signal-to-noise ratio (SNR), and cable angle, the actual performance of the algorithm was tested, laying the foundation for subsequent cable force estimation of cable-stayed bridges.
4.2. Sensitivity Analysis of the LTA Parameters
In practical engineering applications, variations in shooting equipment and parameters may cause slight differences in the collected vibration video data. To investigate the influence of internal parameters on test results and verify the applicability of the LTA, this section conducts a sensitivity analysis on the proposed method, focusing on three factors: shooting resolution, ROI division position, and shooting frame rate.
A vibration video recorded with a cable force of 10 kN and a camera frame rate of 60 Hz was selected, and a segment of the excitation signal was used as the research subject, as shown in Figure 10. The resolution of the test video was 1920 × 1080 pixels. The calibrated images were compressed without loss of information, and the resolution was reduced to 1440 × 810p, 960 × 540p, and 480 × 270p, respectively. Four different ROI sizes were selected, accounting for 0.25, 0.5, 0.75, and 1 of the entire image area, ensuring that the cable vibration range was not exceeded. The cable centerline was detected in each resolution group. Notably, the proportion of the ROI to the resolution was consistently maintained in this study, and the aspect ratio could be changed without altering the relative proportion of the ROI to the image. In addition, to prevent errors from varying tracking point positions, the tracking points in each ROI were selected at the center of the image. By detecting the cable centerline in the image, the y-axis pixel coordinate changes of the tracking points were recorded to calculate the cable vibration displacement.
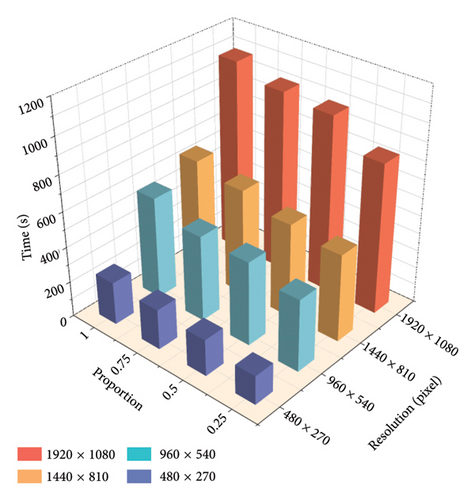
To enhance computational efficiency, GPU acceleration was employed for image processing. The algorithm is run on a NVIDIA GeForce RTX4070 with 12 GB of memory. Figure 11 compares the computation times for different combinations of resolutions and ROI proportions. The results show that, for the same image resolution, selecting a smaller ROI size slightly reduces runtime, although the decrease is relatively minimal. However, with the same ROI proportion, reducing resolution significantly shortens the program runtime, thereby greatly improving efficiency. It was also noted that since the algorithm primarily performs vertical subset searches, changes in ROI width have a minimal impact on computation time, whereas changes in height significantly influence it. Table 2 lists the first-order natural frequency identification results for each combination. Compared to the frequencies measured by the accelerometer, the maximum error is less than 1%, and all results remain consistent and within a reasonable range.
| Resolutions (pixels) | ROI proportions | Measured frequency (Hz) | |||
|---|---|---|---|---|---|
| 1 | 0.75 | 0.5 | 0.25 | ||
| 1920 × 1080 | 17.546 | 17.537 | 17.533 | 17.541 | 17.644 |
| 1440 × 810 | 17.546 | 17.536 | 17.537 | 17.537 | |
| 960 × 540 | 17.541 | 17.533 | 17.537 | 17.517 | |
| 480 × 270 | 17.533 | 17.535 | 17.527 | 17.513 | |
The algorithm demonstrates strong performance across different resolutions and ROI proportion, showing high accuracy and broad applicability. While ensuring the clarity of the cable segment within the camera’s field of view, resolution can be appropriately reduced to decrease memory usage. Alternatively, after acquiring a high-resolution video, it can be compressed without losing image information to enhance efficiency. For ROI selection, it is important to note that the ROI proportion is not fixed, as long as the ROI covers the cable’s vibration range; reducing the ROI height as much as possible will still yield accurate results.
No image cropping or additional processing is required. The LTA can detect different target areas by adjusting the ROI selection position. To investigate the impact of different ROI selection positions on identification accuracy, while balancing computational efficiency, the resolution of the video is reduced to 960 × 540 pixels. The extracted images are proportionally divided, and seven positions are selected for centerline detection. The ROI size is the same for each position, and the tracking point is set at the center of the ROI rectangle. Taking the detection result with 100% ROI proportion and xtrack set as the midpoint of the image as the reference, recognition results at different positions are compared, as shown in Figure 12. The figure shows that reducing the ROI proportion has minimal impact on tracking results, with an average error of 0.391 pixels compared to detecting the entire image. Regarding detection results at different positions with the same ROI size, the farther the position from the initial tracking point, the larger the recognition error. However, when comparing the vibration displacement results obtained at each position, the maximum average recognition error is only 0.1657 pixels, and the average displacement recognition error across the entire image remains within a small range.
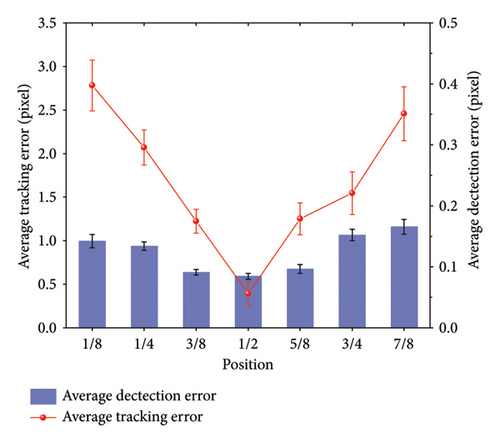
Table 3 lists the displacement recognition errors for tracking points across different rectangular windows and the vibration frequency results obtained from FFT analysis of the displacement time series. Comparisons indicate that selecting different rectangular regions within the same field of view has minimal impact on the recognition results. Although there are slight differences in displacement calculation results for each ROI, the vibration frequency errors are negligible. This finding also indirectly confirms the second preliminary assumption. Therefore, even if the ROI is selected at different positions in the cable image, the calculation results remain largely unaffected. The relatively large average error in tracking point pixel coordinates is often attributed to the cable ends not being perfectly horizontal and the variations in grayscale intensity across different regions of the cable.
| Positions | 1/8 | 1/4 | 3/8 | 1/2 | 5/8 | 3/4 | 7/8 |
|---|---|---|---|---|---|---|---|
| Average detection error (pixels) | 0.1421 | 0.1388 | 0.091 | 0.0845 | 0.0966 | 0.1523 | 0.1657 |
| Average tracking error (pixels) | 2.7815 | 2.0685 | 1.2238 | 0.391 | 1.2514 | 1.5449 | 2.4583 |
| Vibration frequency (Hz) | 17.529 | 17.534 | 17.535 | 17.537 | 17.537 | 17.541 | 17.539 |
According to the Nyquist sampling theorem, to avoid spectral aliasing, the sampling frequency must be at least twice the frequency of the sampled object. For instance, with a sampling frame rate of 30 Hz, the maximum detectable vibration frequency is 15 Hz. Therefore, selecting an appropriate frame rate is crucial for accurately capturing cable vibration videos. In this experiment, vibration videos of the cable are sampled using frame rates of 60 and 120 Hz, with a 10 kN cable force as the reference. As shown in Figure 13, the video captured of 120 Hz frame rate identified the first two natural frequencies of the cable as 17.549 and 38.938 Hz. However, at the 60 Hz frame rate, the second frequency clearly exceeds the frequency recognition range of this sampling rate. As shown in Figure 14, compared to the vibration frequencies measured by the accelerometer, the identification error for lower frequencies is minimal, indicating high accuracy of the algorithm. However, for higher vibration frequencies, the smaller amplitudes in the frequency spectrum make it challenging to accurately distinguish higher-order frequencies.
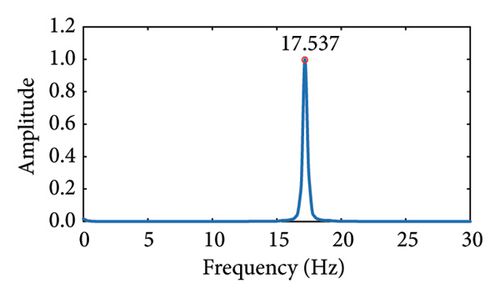
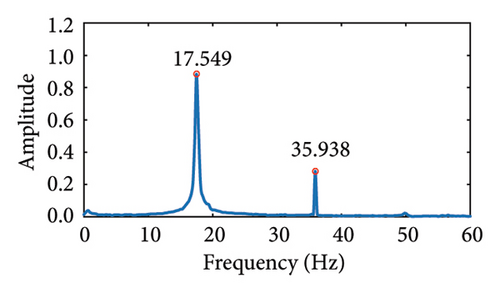
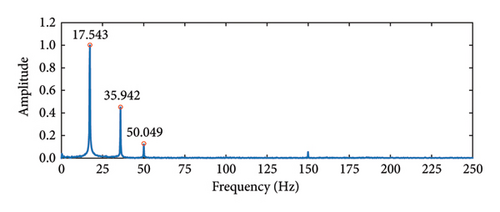
It is evident that using a higher frame rate captures more detailed vibration information; however, higher sampling frequencies often result in increased memory usage and significantly longer algorithm runtimes. Because of the high overall stiffness of the cable-stayed bridge structure and the small amplitude of cable vibrations, even with the use of high-frame-rate cameras, the spectral magnitude of higher-order vibration frequencies remains low, making effective extraction of these frequencies challenging. In such cases, the application of motion amplification algorithms can be considered to enhance high-frequency displacement and facilitate the extraction of higher-order frequencies. In practical applications, the focus of cable force calculations is on the primary frequency range of cable vibration, which typically falls within the range of 0.3 to 12 Hz [59]. Therefore, a lower frame rate can be selected to balance accuracy with computational efficiency.
4.3. Robustness Analysis of the Algorithm
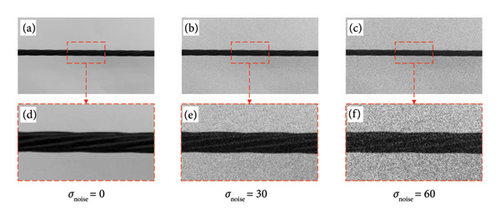
A grayscale difference between the noisy image and the reference image can be observed at each pixel when noise is introduced into the image. As the noise level increases, this difference enlarges, resulting in a corresponding decrease in the SNR. After separating the captured video into individual frames, these frames were processed in batches, with varying levels of Gaussian noise introduced to modify the image SNR. The standard deviation of noise σnoise is increased in increments of 10, ranging from 1 to 60, which cause the SNR to decrease from 59.34 to 9.81 dB. As shown in Figure 15, with increasing noise levels, the number of noise points in the image rises, leading to a significant decline in image quality.
To assess the error of the LTA, the same ROI size was applied to both the original and noisy images. The coordinates of the tracking point in the image are recorded, and the displacement detection errors for each condition are presented in Figures 16 and 17.
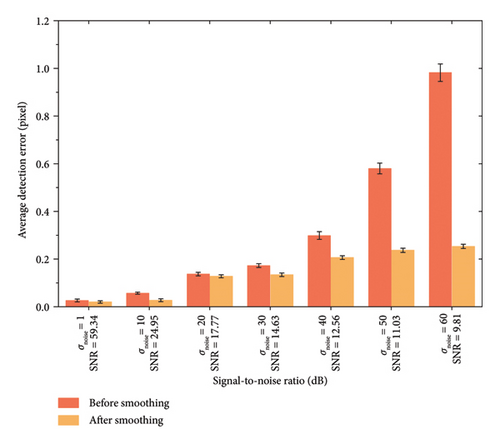
As observed in Figure 16, the average recognition error and standard deviation of the same tracking point are compared across seven SNR levels based on the noise-free reference images. With increasing noise, the average recognition error of the tracking point gradually increases relative to the original noise-free image, particularly when the σnoise > 30, at which point the average recognition error begins to rise significantly. Because of the sufficient intensity difference between the cable and the background, recognition accuracy remains at a high level even with minimal Gaussian noise. When Gaussian noise σnoise = 60, the average recognition error is 0.982 pixels, demonstrating that the LTA can still accurately identify the centerline of cable even with significant image noise, showing robustness of the proposed method.
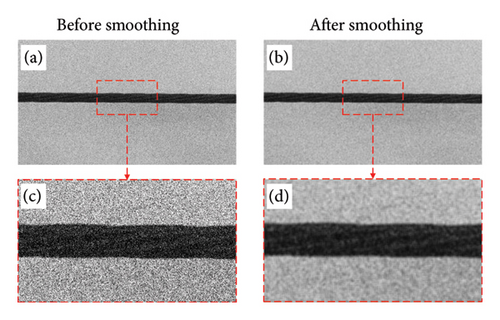
Despite the decrease in SNR, the overall detection error remains within acceptable limits. However, as noise increases, individual “drifting data” can still arise, even when a significant intensity difference exists. This is caused by the nonuniform intensity differences in the image during the vertical subset search process. When noise points appear within the cable region, the grayscale values in the search subset become similar, leading to multiple candidate endpoints, with some locations exhibiting significant detection errors or complete failure to detect the centerline. This study employs a 5 × 5 Gaussian smoothing kernel with σ = 3. Figure 17 illustrates the effect of image smoothing before and after the application of σnoise = 60. As shown in Figure 18, after adding noise σnoise = 60, eight points with significant recognition errors appeared in the vibration displacement. Although these points have a minor effect on the average error, large discrete points can introduce significant deviations in time-frequency conversion during FFT. Consequently, image smoothing is necessary.
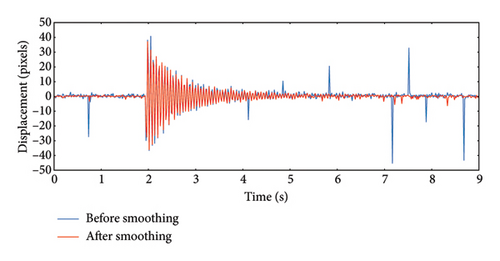
It is evident that after smoothing, noise in the image is reduced, and the grayscale difference between the cable and the background becomes more uniform. Figure 18 compares the displacement before and after Gaussian smoothing filtering under σnoise = 60. It can be observed that, with all other internal parameters unchanged, smoothing the noisy image mitigated large displacement detection errors at certain points caused by a low SNR, thereby significantly enhancing the accuracy of displacement detection results.
By comparting the displacement recognition errors of each noisy image set after smoothing in Figure 16, it is demonstrated that the average recognition errors in displacement detection are reduced compared to the unsmoothed images. Specifically, after smoothing the image with σnoise = 60, the average recognition error decreased by 74.2%. This result indicates that the Gaussian smoothing method significantly enhances both accuracy and stability. Selecting an appropriate Gaussian smoothing kernel for preprocessing images before applying the LTA can significantly improve detection accuracy. In practical detection scenarios, the SNR of images is much higher than the experimental noise levels, further demonstrating that the algorithm has excellent accuracy and robustness.
4.4. Effect of Angle Change of Cable on Tracking Result
It is well established that the length and angle distribution of cables in a cable-stayed bridge vary along the span direction of the structure. To simulate the real-world distribution of cables in a cable-stayed bridge, this experiment adjusts the anchoring positions of the loaded and anchored ends in the reaction frame’s limit holes to vary the height difference between the two ends, thereby changing the laboratory inclination angle of the cable. Other testing conditions and excitation methods remain consistent with those used when the cable is positioned horizontally, and the experimental setup is shown in Figure 19.
Taking an inclination angle of 25° and a shooting frame rate of 60 Hz as an example, the vibration displacement measurement results based on the LTA are shown in Figure 20. Compared with the accelerometer results, the frequency measurement accuracy remains consistent.


In the centerline detection process, the algorithm searches vertically by dividing subsets at the left and right ends of the image. As mentioned in the preliminary assumptions of Section 3, the cable must span the defined ROI. However, when the cable angle changes, a large inclination can cause the cable to cross the upper and lower edges of the ROI. As shown in Figure 21, this can prevent the detection of the cable’s centerline endpoints during vertical subset searching. Even if the ROI height is increased, excessive cable amplitude during vibration may cause candidate points to be missed on one or both sides, leading to centerline detection failure. At this stage, defining the ROI becomes difficult. The video image can be rotated or, during video capture, a wider field of view can be obtained by reducing the focal length.

4.5. Cable Force Estimation Result of the Experimental Cable
Based on the above parameter analysis results, the camera is calibrated for the focal length used in this experiment using a calibration board. After calibrating the extracted image frames, the pixel scale factor for the focal length is calculated as α = 0.31 mm/pixel. Video data with a frame rate of 60 Hz was selected, and the calibrated image resolution is reduced to 960 × 540 pixels. The ROI size is set to 50% of the image, with the midpoint of the image chosen as the tracking location. Vibration displacements under different cable forces are generated and subsequently transformed into frequency-domain data to obtain the vibration spectrum.
Figures 22 and 23 present the vibration displacement and acceleration signals for three different cable forces. The weight of the accelerometer introduces damping during the test, which suppresses high-frequency vibrations to some extent. The theoretical calculations also do not account for the effect of damping on vibration frequencies. Despite the sampling frequency of the accelerometer being 500 Hz, the small amplitude of higher-order frequencies and the measurement accuracy limitations of the sensor mean that only the first three orders of vibration frequencies can be identified. Therefore, the first-order frequency identification results were used to calculate the cable force in this experiment. It is worth noting that the mass of the accelerometer is relatively small compared to the total mass of the cable. The impact of the accelerometer’s mass is considered negligible and has been omitted in this study. It can be seen from the figures that vibration frequency increases with higher cable force, which is consistent with principles of physics. A detailed comparison between the frequency identification results of the proposed algorithm and the accelerometer shows that, within the identifiable frequency range, the maximum identification error is only 2%. The study demonstrates the high identification accuracy of the proposed method.


Based on the cable vibration frequencies shown in Figures 22 and 23, the cable force is calculated using Equation (13). Table 4 lists the cable force calculation results using the proposed method and measured by the accelerometer. Compared to the theoretical values, Table 4 shows that the cable force calculated using the proposed method is very close to both the theoretical and measured values, with maximum errors of only 3.41% and 0.99%, respectively, indicating high accuracy in cable force estimation.
| Case | Proposed method | Accelerometer results | Theoretical results | Relative error (%) | ||
|---|---|---|---|---|---|---|
| |FP − FT|/FT | |FA − FT|/FT | |FP − FA|/FA | ||||
| 1 | 5170.35 | 5142.46 | 5000 | 3.41 | 2.85 | 0.54 |
| 2 | 9846.51 | 9931.46 | 10,000 | 1.53 | 0.69 | 0.86 |
| 3 | 14532.54 | 14677.95 | 15,000 | 3.12 | 2.15 | 0.99 |
- Note: FP, FT, and FA represent the result of the proposed method, accelerometer results, and theoretical results, respectively.
5. Case Study: A Scaled Specimen of a Cable-Stayed Bridge
5.1. Bridge Description
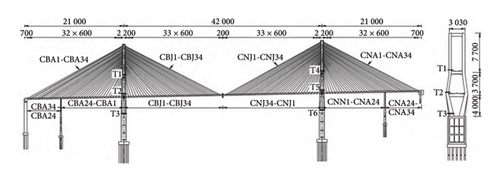
The scaled model was based on the Second Hejiang Yangtze River Bridge in Luyu Highway. The bridge is a double-tower prestressed concrete cable-stayed bridge with a span of 210 + 420 + 210 m and a rigid frame system. Each tower is equipped with 34 pairs of cables, made of high-strength parallel steel wires. The elastic modulus and shear modulus are 2.0 × 10⁵ MPa and 7.69 × 10⁴ MPa, respectively, with a Poisson’s ratio of 0.3. The cables adopt a dense symmetrical fan-shaped arrangement in a double-cable plane system, as shown in the layout in Figure 24. More detailed information can be found in Reference [60].
5.2. Scaled Model and Test Program Design
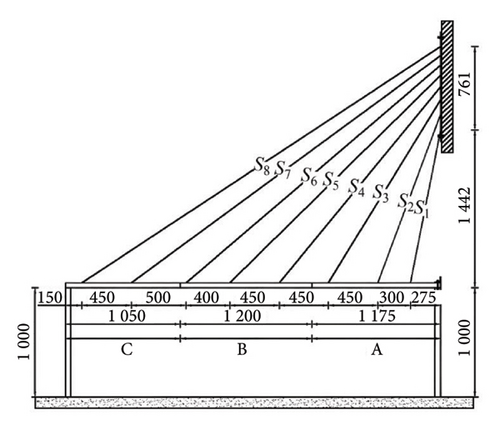
Because of the limitation of the experimental site, the scaled model was selected from the section on the left tower pier fixed to the auxiliary pier at 137 m for the model design, with a geometric similarity ratio λ = 1/40. According to the similarity theory [61, 62], the main beam of the test model was welded with 6 mm thick steel plates, and the cables were made of 3 mm diameter steel wire ropes. The important design parameters and specific lengths of the cables can be referred to in Tables 5 and 6. The main beam length of the scaled model was 3.425 m, with segmented lengths of 1.175 + 1.200 + 1.050 m, and the beam width was 0.400 m. The main beam cross section used a side box girder. The main beam was assembled from three steel box girder segments. To ensure the longitudinal continuity of the steel main beam, one connection steel plate was arranged on both the inside and outside of the side box girder at the splice positions, and the segments were connected by M12 bolts. In this model, the cables were simplified to eight pairs, with the cables at the side piers and main towers retained. The final layout of the scale model is shown in Figure 25. For details on the assembly and connection of components in the laboratory model of the cable-stayed bridge, please refer to References [63, 64].
| Specification | Diameter (mm) | Section area (mm2) | Elastic modulus (N/mm2) | Tensile strength (MPa) | Line density (kg/m) |
|---|---|---|---|---|---|
| Steel wire ropes | 3 | 7.1 | 195,000 | 1860 | 0.055 |
| Cable no. | S1 | S2 | S3 | S4 | S5 | S6 | S7 | S8 |
|---|---|---|---|---|---|---|---|---|
| Length (m) | 1.468 | 1.654 | 1.950 | 2.303 | 2.688 | 3.057 | 3.517 | 3.947 |
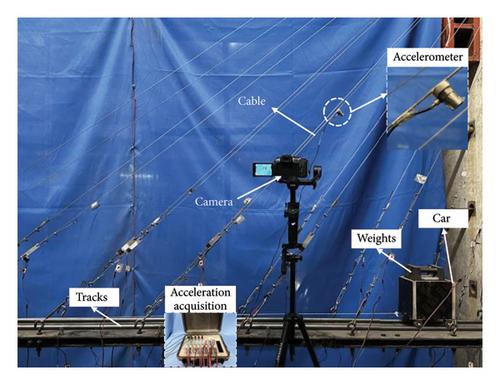
As shown in Figure 26, to simulate the vibration of cables under vehicle load excitation, two guide rails were laid on the main beam, and a car with 20 kg weight was placed on the rails. The movement of the weighted car simulates a vehicle driving over the bridge. The camera lens was fixed at a distance of 0.5 m from the cable, with a focal length of 30 mm, a frame rate of 60 Hz, and a resolution of 1960 × 1080 pixels. In addition, to validate the practicality and accuracy of all methods, an IEPE-1A111E accelerometer was placed at the midpoint of the cable’s length to simultaneously acquire vibration acceleration signals, with the sampling frequency set at 500 Hz. Similarly, to reduce experimental errors, each cable vibration was tested three times, and the average value was taken as the experimental result. This procedure was repeated to obtain vibration video data and acceleration signals for a total of eight cables (S1–S8) on one side of the scaled model of the cable-stayed bridge.
5.3. Data Analysis
In the field test, considering that the cable is only 3 mm in diameter, if the shooting distance is far, or the shooting focal length is too short, it will result in a low proportion of pixels occupied by the cable in the image. Under the aforementioned imaging conditions, the cable diameter in the image is about 35 pixels. Furthermore, because of vehicle excitation, the cable’s vibration amplitude is relatively small, with the maximum displacement not exceeding 24 pixels. After experimental comparison, the maximum difference in the centerline detection results of the images at the same moment before and after calibration reached 1.25 pixels, which is unequivocally unacceptable for the accuracy of the cable vibration detection. Therefore, it is evident that, to ensure the accuracy of cable vibration displacement identification, calibration of the captured cable vibration images is essential.
The cable vibration images were calibrated according to the method described in Section 2, followed by the application of the LTA to calculate the vibration displacements of the cables. To improve computational efficiency, the image resolution was reduced to 480 × 270 pixels, with the pixel scale factor for these parameters calculated as α = 0.78 mm/pixel. To demonstrate the actual testing effect of the algorithm proposed in this study on the scaled model of a cable-stayed bridge, the test results of S5 are used as an example. Figure 27(a) shows the vibration displacement of the cable identified by the LTA and its displacement spectrum. Figure 27(b) shows the acceleration signal collected by the accelerometer and its corresponding spectrum. A comparison shows that, within the frequency recognition range of the algorithm, the frequency recognition results of both methods are relatively consistent.


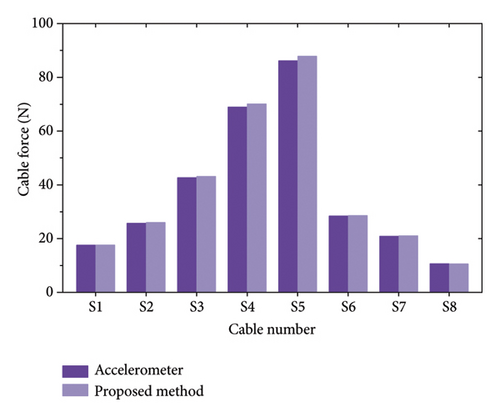
In practical engineering applications, the cable force is difficult to obtain directly. The frequency measured by an accelerometer is typically used, and the cable force is calculated based on the vibration frequency method, serving as the true value of the cable force. Therefore, accelerometer measurements are used in this study to verify the accuracy of the proposed method. The experiment was conducted under ideal laboratory conditions, without considering environmental factors such as lighting and wind speed. In fact, lighting variations in natural environments typically do not occur frequently. It is worth noting that because of the slender characteristic of the scaled model cable, the mass of the accelerometer accounts for approximately 10% of the total mass of a single cable. However, the cable force, overall stiffness, and material properties are the primary factors determining the vibrational behavior of the cable, and the installation of the accelerometer can be considered a localized disturbance. In this study, the vibration amplitude of the cable under moving loads is negligible, and the impact of the accelerometer on natural frequencies and overall mode shapes of the slender cable is limited. Therefore, the effect of the accelerometer’s mass on the vibration analysis of the cable is disregarded in this study. In addition, to reduce computational complexity, the mass of the accelerometer is not included in the cable force calculation formula. Table 7 and Figure 28 list the vibration frequencies and cable forces of S1–S8, as determined by the proposed method and accelerometer measurements. As shown in the table, the cable vibration frequencies obtained by the LTA closely match the accelerometer measurements, indicating high accuracy in the cable force calculations. As shown in Figure 28, because of differences in boundary conditions, the cable forces of the mid-span cables S4 and S5 are significantly larger than those in the short cables near the main tower and the long cables near the side piers, which is consistent with the cable force distribution observed in prior static loading tests. The results indicate that the maximum frequency identification error and cable force calculation error are 0.99% and 2%, respectively, which meets the accuracy requirements for practical engineering applications and further validates the proposed method.
| Cable no. | Vibration frequency of cables (Hz) | Relative error (%) | Force (N) | Relative error (%) | ||
|---|---|---|---|---|---|---|
| Accelerometer | Proposed method | Accelerometer | Proposed method | |||
| S1 | 7.592 | 7.607 | 0.20 | 17.54 | 17.61 | 0.40 |
| S2 | 8.158 | 8.203 | 0.54 | 25.71 | 25.99 | 1.09 |
| S3 | 8.911 | 8.961 | 0.57 | 42.63 | 43.12 | 1.15 |
| S4 | 8.595 | 9.673 | 0.81 | 68.95 | 70.07 | 1.62 |
| S5 | 9.187 | 9.278 | 0.99 | 86.11 | 87.83 | 2.00 |
| S6 | 4.636 | 4.655 | 0.40 | 28.36 | 28.59 | 0.81 |
| S7 | 3.453 | 3.472 | 0.55 | 20.83 | 21.06 | 1.10 |
| S8 | 2.202 | 2.193 | 0.42 | 10.67 | 10.58 | 0.84 |
6. Conclusions
- 1.
The proposed method requires only camera calibration parameters before capturing the vibration video of cables. Vertical subset search and sub-pixel detection were employed to identify the cable centerline within the ROI, achieving sub-pixel accurate extraction of vibration displacement and addressing issues of low detection efficiency and inadequate measurement accuracy in traditional CV techniques.
- 2.
Numerical analysis of cable specimen vibration test results indicates that image resolution and ROI size significantly impact the algorithm’s computational efficiency. The error introduced by varying identification positions in vibration frequency calculation is negligible. A moderate reduction in resolution maintains high recognition accuracy, with the maximum error relative to measured values being only 1%. The algorithm exhibits robust performance in noisy environments, with the average displacement recognition error reduced by up to 74.2% after smoothing to high-noise images.
- 3.
Using the identified cable vibration frequency, three different cable forces were calculated. The cable force calculated using the proposed method exhibited a maximum error of only 3.41% and 0.99% compared to theoretical and sensor-measured values, further validating the accuracy of vibration frequency testing and the effectiveness of cable force estimation.
- 4.
The LTA performed effectively in the scaled model tests of a cable-stayed bridge. The numerical results demonstrate that the calculated values are highly consistent with the accelerometer measurements, with the maximum frequency identification error at only 0.99% and the maximum error in cable force estimation at 2%. This indicates that the method has high applicability and reliability for cable force estimation and holds promising potential for practical application in cable-stayed bridge monitoring.
In summary, the proposed method exhibits high robustness and accuracy in vibration frequency identification and cable force estimation. In this study, the camera is positioned at a relatively close distance to the bridge. Compared to real-world engineering structures, the amplitude of the cable is more pronounced during vibration testing. The background used in the experiment is relatively simple, and under more complex background conditions, it may compromise the accuracy of the LTA.
Future research should focus on assessing the potential effects of long-distance monitoring and complex environmental backgrounds on the computational results. Although this method holds significant potential for application, varying cable configurations and bridge types will present a series of unique challenges, imposing higher demands on the LTA. In future work, we will conduct inspections on real bridges and perform in-depth studies on the impact of sag effects on the mechanical performance of extra-long cables. To further improve the comprehensiveness and practical applicability of detection, integrating drone-based detection with this method and conducting simultaneous measurements of cable forces across multiple cables will be a major focus of future research.
Conflicts of Interest
The authors declare no conflicts of interest.
Author Contributions
Naiwei Lu: conceptualization, funding acquisition, investigation, and writing – original draft. Weiming Zeng: data curation, formal analysis, investigation, visualization, and writing – original draft. Jian Cui: investigation, validation, and visualization. Yuan Luo: funding acquisition, visualization, and writing – review and editing. Xiaofan Liu: investigation and visualization. Yang Liu: funding acquisition, supervision, and writing – review and editing.
Funding
The study was supported by the National Natural·Science Foundation of China (52178108, 52478128, 52408175), the Natural Science Foundation of Hunan Province (2023JJ50180, 2024J15033), Scientific Research·Foundation of Hunan Provincial Education Department (23B0575), the Postgraduate Research Innovation Project of Changsha University of Science and Technology (CLKYCX24021), and Shenzhen Science and Technology Planning Project (GJGJZD20220517141800001).
Open Research
Data Availability Statement
The data that support the findings of this study are available from the corresponding author upon reasonable request.


