From Flow to Packet: A Unified Machine Learning Approach for Advanced Intrusion Detection
Abstract
In the era of advanced networking with 5G integration, the need for efficient and scalable intrusion detection systems has become critical to securing large-scale digital infrastructures. Traditional intrusion detection approaches either analyze individual packets yielding high computational costs or rely solely on flow-based data, which can miss important sequence-level information critical to identifying interservice communications and attack behaviors. To address this, we propose a unified machine learning approach that integrates flow-based and packet-based detection using convolutional neural networks (CNNs) for advanced intrusion detection. Our method prioritizes flow-based detection for short flows as the first defense layer and selectively invokes packet-based detection for longer flows or cases deemed uncertain. Uncertain predictions from the flow-based stage are identified using a confidence threshold and re-evaluated by the packet-based system. We validate our method using a systematically generated dataset from a microservices environment alongside benchmark datasets, including CIC-IDS-2017, CIC-IDS-2018, and CREMEv2. This hybrid detection strategy yields strong performance in both accuracy and efficiency. Specifically, our approach reduces the computational cost by up to 24 × (approximately 1.38 orders of magnitude) compared to relying solely on packet-based analysis. Additionally, the model demonstrates strong generalization with detection rates of 95% and 100% for flow- and packet-based detection, respectively, even against previously unseen attacks generated through behavioral variations and command-level perturbations.
1. Introduction
The advent of 5G technology has paved the way for the development of on-demand services that require low latency to function effectively [1]. As a result, network and system architectures have evolved to accommodate these requirements by transitioning to distributed environments. One of the key aspects of this evolution is the adoption of distributed systems, such as microservices. Microservices allow for the decomposition of an application into separate components or “services” that can be managed independently. Container-based applications have become the standard for effectively implementing microservices, with Kubernetes being the most widely used container orchestration platform.
System security and intrusion detection have become increasingly crucial with the rising adoption of 5G and microservices. Addressing these needs involves securing microservice systems and detecting intrusions within them. Securing microservices is challenging for several reasons [2]: (1) They are distributed across nodes with interservice communications, and these nonlinear communication patterns make distinguishing normal from anomalous behavior difficult. With potentially hundreds of concurrently running microservices, such systems are harder to secure than traditional monolithic ones. (2) Unlike monolithic systems where components communicate locally, microservices communicate over networks, enlarging the attack surface. Each service can be an entry for attackers, with the complex communication allowing lateral attacker movement. (3) Microservices communicate using diverse protocols and event-driven architectures, complicating the identification of malicious activities. (4) These intricate patterns can increase false positives (FPs) and negatives (FNs) in intrusion detection.
A prevalent strategy is implementing distributed intrusion detection on each network node, allowing for real-time anomaly identification by analyzing network traffic data. There are two forms of network data that can be used for intrusion detection: packet-based and flow-based.
Packet-based detection focuses on the packet, the fundamental unit of data transmission in a network. Each packet carries detailed information about its source, destination, and content. This method can involve analyzing the payload of packet data [3–5]. However, the prevalence of encryption in modern protocols poses significant challenges to achieving accurate classification [6]. Alternatively, packet-based detection may employ sampling techniques based on specific fields from the 5-tuple source IP, destination IP, source port, destination port, and protocol type [7, 8]. This approach offers granular insights into each packet and tends to improve accuracy. Nevertheless, due to the large volume of packets in modern networks, this method demands significant computational resources to process and analyze the data.
On the other hand, flow-based data collate packets into flows using the same 5-tuple fields, providing a statistical snapshot of traffic between endpoints. This summary might include metrics such as packet count, byte count, and flow duration, facilitating a comprehensive network behavior analysis. While third-party tools can extract features from these flows and calculate statistics, offering a less computationally intensive alternative to packet-by-packet analysis, this method captures only statistical patterns, omitting the nuanced sequences and trajectories indicative of network anomalies. Additionally, the necessity to wait for a flow’s completion before calculating the correct statistics limits its applicability to real-time detection. Analyzing incomplete flows leads to lower detection accuracy and higher FP rates, diminishing the method’s overall effectiveness [9].
Packet-based and flow-based detection methods each have their strengths and limitations. While packet-based detection ensures high accuracy, it demands significant computational resources. Conversely, flow-based detection is less resource-intensive but experiences reduced accuracy, requiring the completion of extensive flows before detection can take place [10]. A unified approach, merging both methods, could optimally harness their advantages and enhance detection efficiency.
In the past, network data were typically analyzed using signature-based detection. However, this approach proved ineffective due to the prevalence of encrypted packets in modern networks. Furthermore, it was also constrained by its reliance on predefined attack signatures and exhibited a high FN rate, leading to missed unknown attack attacks. Machine learning (ML) has now emerged as a superior alternative by learning the patterns and behaviors of network data. ML models can be trained on network data, enabling them to distinguish between normal and malicious network activity. This approach significantly enhances detection performance while reducing the FN rate [11] and can work effectively even in the presence of encrypted packets [12–14].
Deep learning (DL) algorithms, a subset of ML, have demonstrated impressive effectiveness in intrusion detection. They excel at profiling traffic and identifying malicious activities [15]. One such algorithm, the convolutional neural network (CNN), is frequently deployed due to its capacity to autonomously extract features from data, making it ideally suited for traffic profiling. With CNN, traffic features can be directly learned and profiled, facilitating more accurate intrusion detection even when dealing with encrypted packets [16–18]. This method can be implemented in a unified approach for both flow and packet data, learning patterns and identifying malicious behavior within the data.
The motivation for this work arises from the limitations of existing intrusion detection methods in addressing the challenges posed by modern network environments. Current unified or hybrid approaches predominantly focus on either flow-based or packet-based data, with limited exploration of how these can be combined effectively [19–31]. While [8] introduced a hybrid method that integrates flow and packet features for joint processing, it incurs significant computational overhead due to the simultaneous processing of both data types. In contrast, our work seeks to address these shortcomings by proposing an innovative unified approach that leverages the strengths of both flow- and packet-based detection while minimizing resource demands. Specifically, our method uses flow-based detection as the primary defense for shorter flows, reserving the more resource-intensive packet-based detection for longer flows or cases where flow-based confidence scores fall below a specified threshold. By forwarding uncertain flow-based results for packet-level reanalysis, our approach reduces FPs and FNs, enhances computational efficiency, and enables real-time detection, making it well-suited for securing dynamic and distributed systems such as microservices.
- •
To the best of our knowledge, this study is the first to introduce a novel unified detection framework that combines flow- and packet-based methods, leveraging their respective strengths to improve both accuracy and efficiency.
- •
We propose a confidence-driven mechanism that flags uncertain flow-based detections for further analysis at the packet level, significantly reducing FPs and FNs.
- •
We design an approach that prioritizes computational efficiency, utilizing flow-based detection for most traffic and engaging packet-based detection selectively, thereby optimizing resource usage.
- •
We validate the proposed framework through extensive experiments across multiple datasets, demonstrating its superior performance in terms of detection accuracy, computational efficiency, and robustness against state-of-the-art methods.
Furthermore, in order to enhance our knowledge, we also investigate: (1) the performance of various detection methods, including flow- and packet-based approaches; (2) the influence of different threshold types on grey zone data, which impacts FP and FN rates; (3) the effectiveness of the unified flow-and-packet approach, to evaluate its performance in terms of detection accuracy and computational demand; and (4) unknown attack testing, to assess the effects of unknown attack on the performance of the unified flow-packet approach.
The remaining sections of this paper are structured as follows. Section 2 discusses the related works on unified and hybrid intrusion detection. In Section 3, the problem formulation is defined. Section 4 discusses the design solution, and Section 5 explains the system’s implementation. In Section 6, we present the results and discussions. Finally, in Section 7, we draw the conclusions based on our findings.
2. Related Works
We provide a comprehensive overview of previous research in the field of unified or hybrid network anomaly detection and intrusion detection systems (IDSs), which is summarized in Table 1. Although numerous studies have proposed methods for anomaly detection or intrusion detection using ML, our focus is specifically on works that utilize hybrid approaches, whether through mixed models or data. This distinct focus allows us to highlight the unique contributions of hybrid methodologies in enhancing detection capabilities. The table provides a comparative analysis of each study, focusing on several key aspects, such as the employed hybrid detection method, types of input data used for training and testing, the specific ML methods applied, proposed solutions, and the used datasets. Given the multitude of research studies conducted on hybrid intrusion detection in network traffic, each study adopts a distinct definition of hybrid detection. To enhance clarity, we categorize these definitions into three categories.
| Paper | Hybrid detection | ML input | Method | Solution | Dataset | |
|---|---|---|---|---|---|---|
| Flow | Packet | |||||
| [19] | Model hybrid | O | X | Binary in 1st level multiclass in 2nd level | Decision tree–random forest | CIC-IDS-2017, UNSW-NB15 |
| [20] | Autoencoder–soft output | Bot-IoT dataset | ||||
| [21] | SparkML–Conv-LSTM | ISCX-IDS 2012 | ||||
| [22] | Autoencoder–random forest | CIC-IDS-2017 | ||||
| [23] | Combination of deep learning models | CNN as feature extractor, SVM as classifier | CIC-IDS-2017 | |||
| [24] | Cu-LSTM–GRU | CIC-IDS-2018 | ||||
| [25] | CNN–LSTM | NSL-KDD | ||||
| [26] | LSTM–Naive Bayes | CIC-DDoS2019, CIC-IoT2023, CICIoV2024 | ||||
| [27] | CNN–GRU–BiLSTM | NSL–KDD | ||||
| [28] | GCN–LSTM | IoT-23 | ||||
| [29] | RF–CatBoost–XGBoost–MLP | CIC-IDS-2017, UNSW-NB15 | ||||
| [30] | X | O | CNN as feature extractor, LSTM CosMargin layer as classifier |
|
||
| [31] | GWO as feature selection, CNN as anomaly classification |
|
||||
| [8] | Data hybrid | O | O | Fusion statistical and packet features | Multitask learning model with one CNN model | BoT-IoT, CIC-IDS-2017, UNSW-NB51, ISCX-IDS2012 |
| Ours | Model and data hybrid | Unified flow-based and packet-based | Flow-based in 1st line, packet-based in 2nd line | Self-generated (microservices environment), CIC-IDS-2017, CIC-IDS-2018, CREMEv2 | ||
The first category involves model hybrid, which refers to combining classification methods using binary classification in the first level and multiclass in the second level or employing a combination of DL models. The classifier combination was performed by [19–22] through combining binary and multiclass classification. In their method, binary detection is employed at the first level, while multiclass classification is utilized at the second level. For instance, [19] used a Decision Tree at the first level and a Random Forest (RF) at the second level, training and testing their model on CIC-IDS2017 and UNSW-NB15 datasets, achieving F1 scores of 100% and 97%, respectively. [20] employed a multimodal deep autoencoder for binary detection and soft-output classifiers for multiclass classification, improving performance by 5% over the baselines. Similarly, [21] used SparkML at the first level and a Conv-LSTM model at the second level, training and testing on the ISCX-IDS 2012 dataset to achieve a 97.29% accuracy. This approach aligns with the work of [22], which initially employed an autoencoder for anomaly detection at the first level, and then utilized a RF trained exclusively on malicious data at the second level, achieving a balanced accuracy of 96%. It is worth noting that all mentioned datasets are flow-based and rely on statistical features.
Furthermore, several studies have combined DL models to enhance intrusion detection performance. These approaches often involve using DL for feature extraction or selection, followed by training with ML or DL techniques. For instance, [31] employed grey wolf optimization (GWO) for feature selection and trained a CNN model, while [30] extracted features using a CNN model and trained a long short-term memory (LSTM) model. Similarly, [23] utilized a CNN for feature extraction and support vector machine (SVM) for model training. Other works include [26], which employed LSTM and Naive Bayes; [27], which integrated CNN, gated recurrent unit (GRU), and BiLSTM models; [25], which employed a CNN–LSTM combination; and [28], which combined graph convolution network (GCN) and LSTM models. Additionally, [29] applied stacked ensemble learning using RF, CatBoost, and XGBoost as base learners, with a multilayer perceptron (MLP) as the meta-learner. Moreover, some studies adopted ensemble techniques that combine multiple DL models for final decision-making. For example, [24] utilized a Cu-LSTM–GRU architecture.
Most existing hybrid detection approaches discussed above focus on model hybrid techniques, where multiple classifiers are combined at different stages to improve classification performance. However, these approaches do not explicitly optimize the integration of flow- and packet-based detection, instead focusing on refining classification models rather than reducing computational overhead.
Among prior works, MEMBER [8] is the closest competitor to our approach, as it also integrates both flow- and packet-based data. MEMBER employs a multitask learning model that fuses statistical flow-based features and raw packet details into a single CNN model, processing both data types simultaneously. While this approach enhances feature representation, it introduces significant computational overhead because it processes both flow and packet data at all times, even for benign traffic. This redundant computation makes MEMBER less efficient for real-time deployment in large-scale networks, as it lacks a mechanism to selectively process only relevant traffic.
In contrast, our method follows a tiered decision-making approach, where flow-based detection serves as the first defense, and packet-based detection is selectively applied only for uncertain cases in the “grey zone.” This confidence-driven mechanism ensures that most network traffic is processed efficiently at the flow level, preventing unnecessary packet-based analysis for benign traffic. By escalating only ambiguous cases to packet-based detection, our approach significantly reduces computational costs while maintaining high accuracy.
Furthermore, while MEMBER merges flow and packet features into a unified model, our approach separates flow and packet detection into two distinct CNN models, allowing independent processing at different levels. This separation improves adaptability, ensuring that packet-based detection is only triggered when the flow-based model lacks confidence in its classification. The resulting efficiency gain makes our method better suited for real-time intrusion detection in large-scale and resource-constrained environments.
3. Problem Formulation
This section explains our problem definition and the variables and notations employed, summarized in Table 2. Given the training dataset, ML algorithm, and testing dataset, we need to determine the most accurate ML model and the ideal threshold detection parameters for flow-based and packet-based approaches. Additionally, we must establish the threshold for the grey zone data to filter out low-confidence detection results. Our objective is to maximize the F1 score of the unified flow-and-packet method. The problem statement is then formally defined as follows:
| Notation | Meaning |
|---|---|
| RB | Training dataset |
| RG | Testing dataset |
| Sj | j-th packet data |
| Fi | i-th flow data |
| F∗ | i-th extracted flow |
| |F| | The total number of flows F |
| K | ML algorithm |
| LF | Best ML model for flow-based detection |
| LP | Best ML model for packet-based detection |
| τQ | Threshold value for waiting time |
| τS | Threshold value for flow duration |
| Confidence score of flow-based detection for each i-th flow data | |
| Confidence score of packet-based detection for each i-th flow data | |
| τF | Threshold value for flow-based detection |
| τP | Threshold value for packet-based detection |
| y | The percentile number from 0 to 100 y = 0, 1, 2100 |
| Set of percentile-based probabilities for false-negative data pFN = {pFN|y ∈ [0, 100]} | |
| Set of percentile-based probabilities for false-positive data pFP = {pFP|y ∈ [0, 100]} | |
| Set of percentile-based probabilities for true-negative data pTN = {pTN|y ∈ [0, 100]} | |
| Set of percentile-based probabilities for true-positive data pTP = {pTP|y ∈ [0, 100]} | |
| The minimum false-negative probability percentile | |
| The maximum false-negative probability percentile | |
| The minimum false-positive probability percentile | |
| The maximum false-positive probability percentile | |
| The minimum threshold value for false-negative data | |
| The maximum threshold value for false-negative data | |
| The minimum threshold value for false-positive data | |
| The maximum threshold value for false-positive data |
Input: The training dataset RB, ML algorithm K, and testing dataset RG.
Output: Most accurate ML models with threshold detection for flow-based LF, τF; packet-based LP, τP; and the optimal threshold of grey zone data .
Objective: Maximize F1 score of unified flow-and-packet ML model.
4. System Design
We propose a unified flow-and-packet intrusion detection approach based on ML with the goal of improving the efficacy and efficiency of network intrusion detection while minimizing computational overhead. Our method utilizes flow-based detection as the first-line defender by aggregating packets into flows and extracting features by calculating the statistics of a flow. This process demands less computational resources while providing a confidence score for intrusion detection. If the confidence score is low, packet-based detection will re-check the traffic. In this section, we discuss the details of this unified approach.
4.1. Unified Flow-and-Packet Intrusion Detection Algorithm
The algorithm runs in a live mode that processes the network traffic. It comprises one top-level stage and four detailed steps, as illustrated in Figure 1. It begins by initializing the ML models and various parameters, followed by an exhaustive search for the grey zone threshold. Next, it starts “Packet Handler” step to handle the incoming traffic in the form of packets. Every incoming packet is then grouped into flow entries. A flow represents a sequence of data packets sharing common characteristics, such as source and destination addresses, ports, and protocol type. Once the packet has been grouped into their appropriate flow entries, the subsequent processes occur in parallel. The first parallel process involves continuously receiving new packets, while the second parallel process gets the total number of flows and examines those flows in the “Flow Checker” step to determine whether they meet the criteria to be processed by the intrusion detection module. If the decision is no, it returns to receive and group the next incoming packets.
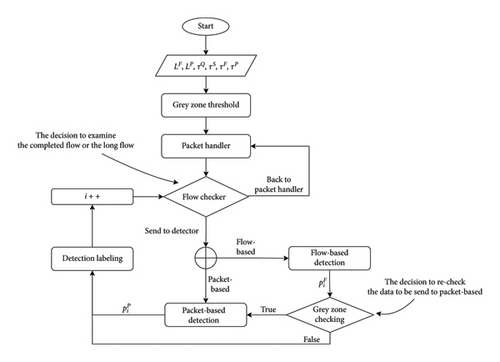
There are two criteria for determining when a flow is analyzed by intrusion detection: when it is finished or too long. When the flow is finished, it will be sent to flow-based detection. Two criteria are employed to determine when a flow is considered finished: (1) utilizing a timeout threshold and (2) examining the TCP flags. The first criterion involves setting a predetermined period of inactivity (e.g., 30 s), after which the absence of packets indicates the end of the flow. This criterion is also applied to define the end of UDP and ICMP connections. The second criterion involves examining the TCP flag. If the flag indicates either FIN (Finish) or RST (Reset), the flow is then categorized as a finished flow. On the other hand, when the flow is too long, it will be sent to packet-based detection. We employ a flow duration threshold to ascertain whether a flow has become excessively lengthy. When the flow’s duration reaches this threshold, we cease the reception of further incoming packets and proceed directly to the packet-based detection process.
When the flow-based detection processes the flow, it outputs the confidence score pF. The system then checks the confidence score of the flow-based detection in the “Grey Zone Checking” step to determine whether the result belongs to the grey zone data or not. Grey zone data are the condition when the flow-based detection does not have good confidence to decide whether the data are benign traffic or anomaly traffic. If it is grey zone data, then the packet data, which has been grouped from this flow, are sent to “packet-based detection” for further checking. Finally, after the data are processed by either flow-based or packet-based detection, the output of confidence score or is checked with the defined threshold to classify it as benign or anomaly in “Detection Labeling.”
4.2. Grey Zone Threshold
IDSs have demonstrated success in detecting network attacks, but they often generate numerous false alarms, straining network operators and reducing effectiveness. Even just 1% of FP data might cause hundreds of false alarms every day, which strains the network operator. Combining flow-packet detection aims to reduce FPs and FNs while maintaining low computational overhead. In this context, the positive class represents malicious flows, while the negative class represents benign flows. FP occurs when benign flows are incorrectly flagged as malicious, and FN stands for undetected malicious flows.
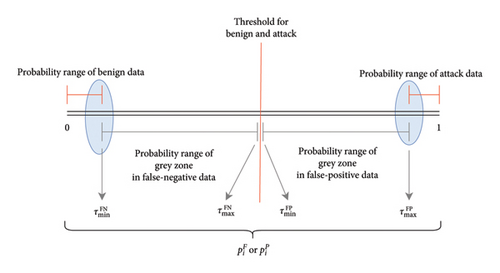
Furthermore, to improve the performance of our intrusion detection, we introduce a new term called “grey zone data” to filter low-confidence detection results by our flow-based detection as the first defender. Grey zone data occur when flow-based detection cannot confidently classify traffic as benign or malicious. We evaluate the confidence score of each flow against a defined threshold and flag any data falling within the threshold range as the grey zone. All the grey zone data are then forwarded to packet-based detection for further analysis.
We used two carefully configured thresholds for FN and FP data to determine grey zone data. Tight thresholds burden resources with excessive correct data checking, while loose thresholds result in many FP or FN data being lost to be rechecked by packet-based detection.
Figure 2 provides an illustration of the defined thresholds. When flow-based detection outputs a high confidence result, the confidence score leans closer to either 0 or 1. However, if the confidence score is far from 0 or 1, it is categorized as a “grey zone,” representing a low-confidence result. To manage the computational load, we set a maximum tolerance of only 0.5% for correct data. This tolerance limit is set to reduce the number of correct data entries that the packet-based detection system needs to verify. Based on these considerations, the values for and can be fine-tuned to optimize the unified system.
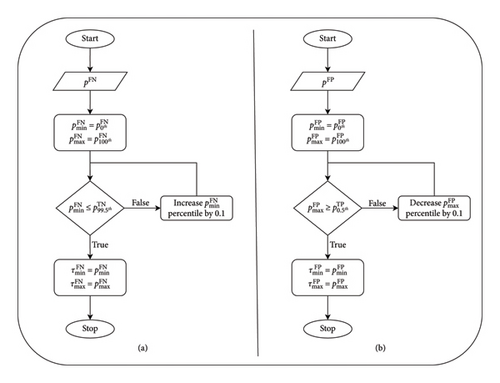
Figures 3(a) and 3(b) illustrate the algorithm for finding the grey zone threshold for FNs and FPs, respectively. After running flow-based detection on the testing data, we obtain the detection results in terms of confidence scores. We then group the results into FN, FP, true negative, and true positive by comparing the detection results with the ground truth. Thus, we compute the percentiles of the confidence scores for each group and store them in a set. These percentiles are used to determine a neither too loose nor too tight threshold. We calculate the percentile of the confidence score by using the notation:  , where k represents the value of the confidence score in the dataset that corresponds to the desired percentile, h is the percentile we want to calculate, and n is the total number of confidence scores in the dataset.
For example, to calculate the 90th percentile, denoted as k, from the example set of confidence scores (0.1, 0.15, 0.2, 0.25, 0.3, 0.35, 0.4, 0.45, 0.5), we can use the formula mentioned earlier:  . This gives k = 9. This yields k = 9, indicating that the 90th percentile corresponds to the 9th value in the sorted dataset, which in this case is 0.5.
We employ the algorithm in Figure 3(a) to determine the minimum and maximum thresholds for FN data, using probability percentiles for FN () and true-negative () data as inputs. Initially, we assign the {0th percentile} of FN as the minimum value and the 100th percentile of FN as the maximum value . We then adjust to find an appropriate threshold by checking if it is lower than the 99.5th percentile value of true negative . If not, we increment the percentile by 0.1 and update . We continue adjusting until is lower than , and accept and as the FN data thresholds, and , respectively.
Similarly, to find the threshold for FP data, we apply the technique used for FN data, as shown in Figure 3(b). Using probability percentiles for FP and TP data as inputs, we assign the 0th percentile of FP () as the minimum value () and the 100th percentile of true positive () as the maximum value (). We then adjust by checking if it is greater than the 0.5th percentile value of true positive . If not, we decrement the percentile by 0.1 and update . We continue adjusting until is greater than and accept and as the FP data thresholds, and , respectively.
4.3. Packet Handler
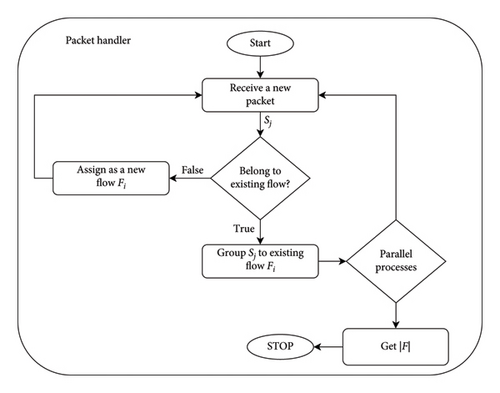
Figure 4 shows the detailed steps on the packet handler step. We defined packet as Sj and flow as Fi. When the system receives the new packet Sj, it is checked by “belong to existing flow?” step to see whether it belongs to an existing flow or not. Furthermore, a flow entry is defined as bidirectional when its address port pair and reverse address port pair belong to the same entry. If the incoming packet Sj has the same pair with the existing flow entry Fi, then it will be grouped in “group Sj to existing flow Fi” step. Otherwise, the system creates the new flow entry Fi for this Sj in the next step and goes back to receive a new packet. After grouping the packet to an existing flow, the subsequent processes occur in parallel. The first parallel process involves the continuous reception of new packets, while the second parallel process gets the total number of flows |F|. This total number is used to check how many flows need to be examined by the IDS.
4.4. Flow Checker
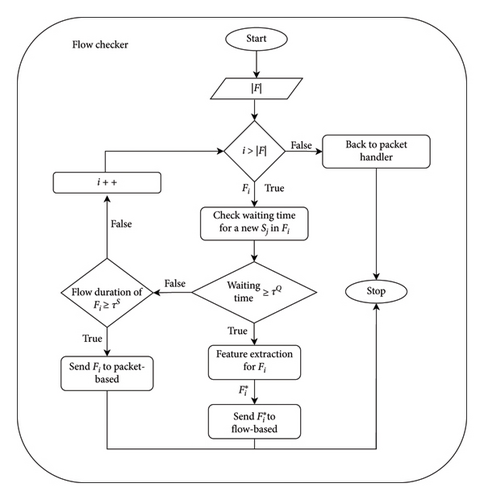
Figure 5 shows the detailed steps in the process of deciding whether the data are to be sent to intrusion detection for further processing or not. In the packet handler step, the system has obtained the total number of flows |F|. Then, it starts to process the first flow in check the waiting time for a new Sj in Fi step. The waiting time indicates the amount of time that the flow has been waiting for a new packet to arrive since the last packet seen The next step is to determine if the waiting time has reached a defined threshold in waiting time ≥ τQ. If the waiting time has reached the threshold, or if the TCP flag on the last packet indicates either FIN or RST, the flow has been completed. Therefore, the flow features will be extracted in step feature extraction for Fi by aggregating packet information and calculating some statistical data. Finally, in step send F∗ to flow-based, the extracted flow data F∗ then is sent to flow-based detection for further processing. However, if the waiting period has not yet reached the threshold, it examines the flow duration. If the flow duration reaches the defined threshold, it indicates that the flow is too long, and therefore, the system stops waiting for the next incoming packet for this Fi and directly transfers the data in Send Fi to packet-based step to be processed by packet-based detection. Finally, the system returns to the first looping step to verify the other flows. After examining all flow data, the process ends and returns to the Packet Handler to receive and group the next incoming packet.
4.5. Grey Zone Checking
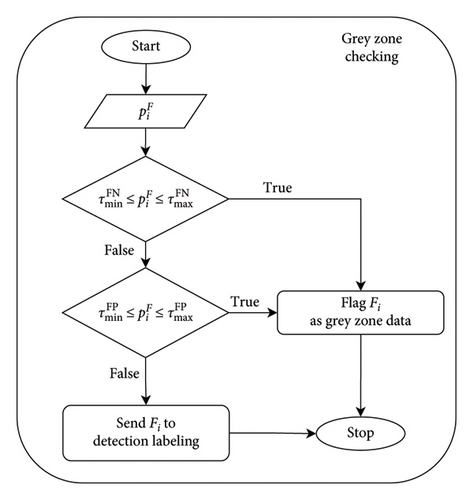
Figure 6 shows the detailed steps involved in determining whether a flow is in the grey zone data and must be rechecked by packet-based detection or not. After flow-based detection analyzes the flow, it outputs the confidence score . The system then takes this score and checks the thresholds in the next steps. , , , and are the thresholds used to determine the grey zone data. If the score is below or above , or if it falls below or above , it indicates a low-confidence level in flow-based detection, requiring further verification through packet-based detection However, if the score of is not inside the range of those thresholds, it is sent to detection labeling step for classifying the data as benign or anomaly.
4.6. Detection Labeling
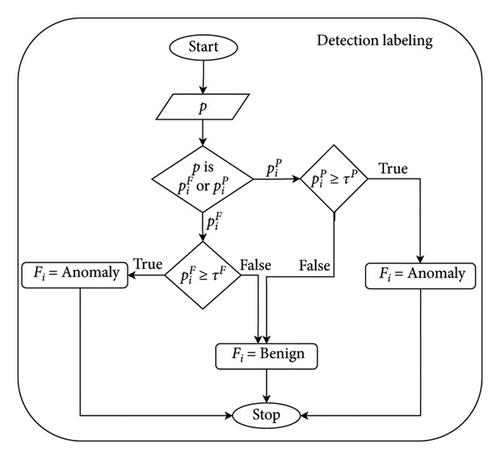
Figure 7 shows the detailed steps of detection labeling for classifying the data as benign or anomaly based on the confidence score from either flow-based detection or packet-based detection . After getting the confidence score, the system checks whether it is or . If the input is , the system checks the score with the defined threshold τF. The flow is then classified as malicious if the score of is greater than τF; otherwise, it is benign. Furthermore, if the input is , the system checks the score with the defined threshold τP, and if the score is greater than τP, then the data are classified as an anomaly.
5. System Implementation
This section provides a detailed explanation of the system implementation. It includes the testbed setup, the method of generating the traffic, the preprocessing method, the DL architecture, and the setup of unknown attacks. All the code to run the proposed solution can be retrieved from our GitHub repository1.
5.1. Testbed Setup
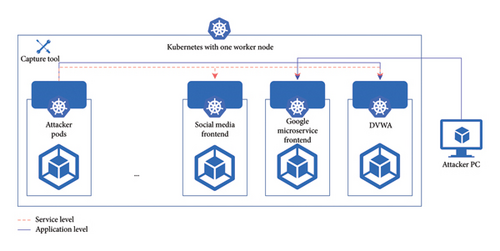
Our testbed environment, shown in Figure 8, used a Kubernetes-based microservices system with 27 services. This setup emulated a microservice system operation and generated both benign and malicious traffic, which was used as the dataset to train our ML models. To generate malicious traffic, we added two pods: an attacker pod initiating malicious activities and a damn vulnerable web application (DVWA) pod with open vulnerabilities. As the existing microservices applications lacked exploitable vulnerabilities, the DVWA was crucial for generating malicious traffic. Additionally, we involved an external attacker in diversifying the attack strategies.
5.2. Traffic Generation
High-quality datasets play a crucial role in developing and evaluating ML models. However, publicly available datasets specific to microservices are limited. To address this gap, we took a systematic approach to create our own dataset.
The dataset collection approach for our study differs significantly from traditional monolithic systems. In monolithic systems, collecting the traffic at the router level often suffices to understand communication patterns since all services are tightly integrated within a single application.
Conversely, a microservice architecture introduces a higher level of complexity. Microservices communicate over networks using diverse protocols, and each microservice operates as a standalone entity with dynamic interactions. To comprehensively understand microservices’ intricate communication patterns, we collected traffic at the finer granularity of individual microservices.
By collecting the traffic at each individual microservice, we were allowed to explore the nuances of microservices architecture, revealing variations in protocols, traffic volumes, and unique patterns specific to each service. Such detailed data collection was crucial to construct a dataset that accurately represents the diverse and decentralized nature of microservices interactions.
5.2.1. Benign Traffic
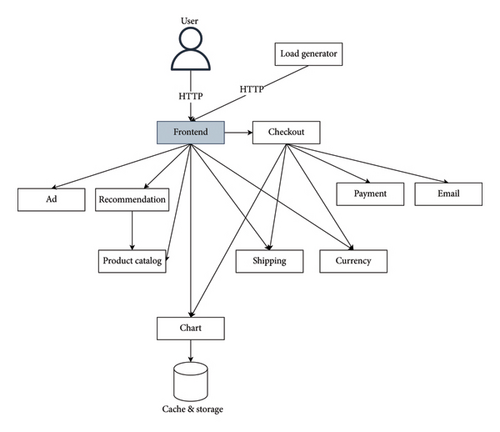
Our first application to simulate benign traffic was a microservices-based e-commerce application by Google [32]. This web application, comprising 11 microservices, lets users explore products, add items to a cart, and make purchases. It also includes a load generator that mimics real shopping activities by continuously sending requests to the front end. The architecture of the e-commerce application is shown in Figure 9.
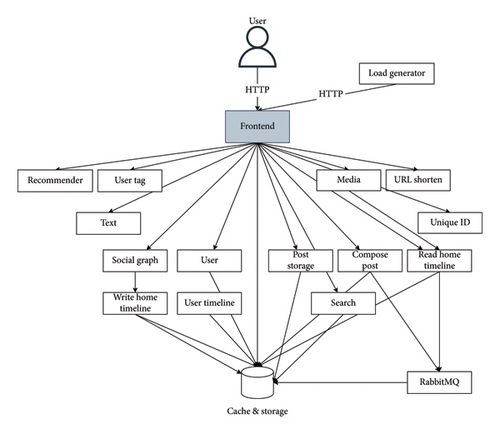
We further diversified our benign traffic by deploying a second application: a social network application with microservices communicating over Thrift RPCs [33]. Figure 10 shows the architecture of this social network application.
5.2.2. Malicious Traffic
This study encompasses various attack scenarios aimed at mimicking malicious traffic and critically assessing microservices security threats. Malicious traffic is primarily classified into two categories: service-level attacks and application-level attacks. The former involves “noisy traffic” attacks that aim to overwhelm the network, while the latter comprises “silent traffic” attacks that subtly blend with normal traffic to exploit application logic.
In simulating service-level malicious traffic, we utilized two attack strategies: brute force and denial-of-service (DoS) attacks. The brute force strategy attempted to overwhelm the target with numerous phrase combinations, employing the DIRB tool to locate hidden server files and directories [34]. In contrast, DoS attacks flooded the target with excessive requests to exhaust its resources, using the HPing tool [35] and Slowloris [36]. The latter exploit concurrent connection limits, disrupting the service availability effectively.
To simulate “silent attacks,” we implemented three methods: vulnerability scanning, SQL injection, and cross-site scripting. For vulnerability scanning, we used the Nikto Tool to scan the system thoroughly, identifying active services and possible open ports. We employed SQL injection, a common database security attack, to extract sensitive information by manipulating SQL queries. Lastly, cross-site scripting involved injecting harmful scripts into web applications by sending malicious browser executable codes to the end user.
After completing the traffic generation process, we obtained a total of 126,213 labeled samples, consisting of 73,275 benign and 52,938 malicious instances. The malicious traffic includes 20,507 brute force attack samples, 21,401 scanning attack samples, 5120 SQL injection samples, 5051 XSS samples, and 2859 DoS samples.
5.3. Benchmark Datasets
- •
CIC-IDS-2017: Developed by the Canadian Institute for Cybersecurity in 2017 [37], this dataset features 7 distinct attack classes and includes a total of 2.8 million samples. It was generated over five days using a network of 14 machines and provides raw PCAP files, making it widely used in numerous studies for its comprehensive range of attack scenarios.
- •
CIC-IDS-2018: Building on its predecessor, the CIC-IDS-2018 dataset was released in 2018 and includes the same attack classes. It expands the testing environment to a cloud setting, involving over 500 machines over 10 days, thereby increasing the complexity and scale of attack simulations. This dataset comprises 9.3 million samples and continues to use the same tools as the CIC-IDS-2017 dataset.
- •
CREMEv2: Based on the MITRE ATT&CK framework, the CREMEv2 dataset focuses on specific threat models and methodologies. It includes five attack variants, such as ransomware, resource hijacking, mirai, disk wipe, and end point dos. These attacks are developed using 14 tactics across 17 different MITRE techniques, with a total of 2.3 million samples [38].
These datasets serve as a robust testing ground to evaluate the resilience and adaptability of our proposed solution across different environments, ensuring a thorough assessment of its effectiveness.
5.4. Preprocessing
The raw benign and attack traffic data recorded for training must first be preprocessed, involving feature extraction and cleaning. Given the distinct structures of flow-based and packet-based data, we adopted different preprocessing strategies.
5.4.1. Flow-Based Detection
The preprocessing of flow-based data involves three steps. First, we used NFStream [39] to extract 61 features from raw data. After this, we removed features without variance and those related to testbed settings to prevent model bias toward specific patterns. Then, we cleaned the data by removing the missing values and processed the data in the appropriate format. Lastly, we rescaled the data using StandardScaler from Scikit-Learn.
5.4.2. Packet-Based Detection
Figure 11 illustrates the packet-based preprocessing steps, following [40]. The process begins with grouping raw network packets by 5-tuple for flow identification. Trace sanitization then removes MAC and IP addresses of each packet, preventing the model from learning specific testbed configurations. Afterward, flow cleaning is performed to remove identical or duplicated data, which could cause bias in DL model training.
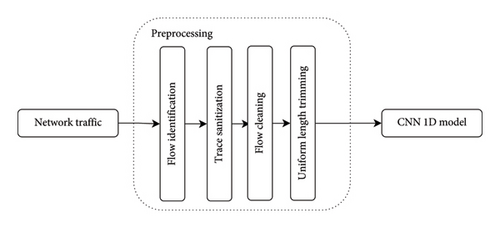
The final step in our process is uniform-length trimming. We extract and trim the first n-packets from each flow. This not only lessens the traffic load for analysis but also accelerates the process for long sessions. As DL models require consistent data lengths, we set a default packet size. Packets exceeding this setup are trimmed, while smaller ones are zero-padded. Previous research suggested that the first three packets, each being 60 bytes long, yielded optimal results [40]. These trimmed bytes are considered as one-dimensional vectors and used as CNN model inputs.
5.5. Key Features Tool
In this work, we delve into an in-depth investigation of the key features extracted from our CNN model to elucidate the mechanisms by which our CNN model determines the detection result. This is crucial not only for model validation but also to enhance transparency and interpretability, which are often obscured in DL models. For this reason, we employed SHapley Additive exPlanations (SHAP) to extract and elucidate these key features.
SHAP is a game-theoretic approach to explain the output of any ML model. It determines each feature’s importance by approximating the contribution of each feature to every possible prediction. In the context of CNN, SHAP meticulously identifies and ranks key features by assessing the impact of each convolutional layer and its neurons on the final prediction. This methodology is preferred because it offers insightful, consistent, and locally accurate attributions, making it superior in capturing intricate data patterns and dependencies.
5.6. Unknown Attack
In the context of our study, the term “unknown attack” refers to attack scenarios that are novel to our detection system. These scenarios simulate real-world conditions where defense mechanisms encounter unknown threats.
Furthermore, research has shown that ML-based IDS are vulnerable to adversarial perturbations. While adversarial attacks could theoretically reshape packet-level features, doing so without disrupting the attacks effectiveness is highly impractical, especially in black-box scenarios where the attacker lacks access to the IDS feature extraction process. Most adversarial research assumes attacks occur at the feature level, requiring privileged access to IDS devices or network infrastructure, making real-world execution unlikely unless the attacker controls the IDS itself.
Instead, real-world adversarial tactics are more likely to involve host-based perturbations, where attackers modify their behavior at the command level rather than manipulating network features postcapture. These behavioral modifications can alter network activity in ways that cause an ML-based IDS to fail in recognizing the attack, as the observed patterns deviate from the training data.
To account for these adversarial behaviors, our study evaluates the models robustness by introducing three categories of unknown attacks: (1) variant attacks, which resemble known threats but use different execution techniques to evade detection; (2) anomalies that mimic benign traffic, designed to blend in and bypass traditional detection mechanisms; and (3) completely novel attack vectors, representing threats the model has never encountered. By testing across these categories, we ensure that our model can effectively detect both adversarial and unknown attack behaviors, reinforcing its resilience and generalization capabilities in real-world scenarios.
We focused on SQL injections as the first type of unknown attack. We trained the CNN model using standard SQL injections, where malicious SQL statements are directly inserted into entry fields, causing the database to execute them. These often trigger error messages that can reveal insights about the database structure. We then tested with blind SQL injections. Unlike standard SQL injections, blind SQL injections do not produce direct database error responses but rather require interpretation of subtle changes in application responses. Despite similar objectives to exploit system vulnerabilities, their differing methodologies make blind SQL injections a novel unknown attack exploit, presenting a unique challenge to traditional detection methods.
The second type of unknown attack simulates benign behavior, initially involving normal login form access. The anomaly arises when the attacker launches a brute force attack on the login form within the social media application.
The third type of unknown attack targets microservices applications using several methods. These attacks include Cross-Site Request Forgery (CSRF), File Upload, File Inclusion, and Command Injection attacks. In CSRF, a malicious actor manipulates a user’s browser to execute unauthorized actions on a website where the user is authenticated. File Upload attack exploits an application’s vulnerabilities, enabling the upload and execution of harmful files on the target system. File Inclusion attack gains unauthorized access by exploiting vulnerabilities to execute server files. Lastly, a Command Injection attack allows arbitrary command execution and potential unauthorized system control by inserting malicious commands into a vulnerable application. All these methods aim to exploit system vulnerabilities, breach security, and gain control.
6. Results and Analysis
This section presents the numerical results obtained from the tests that were carried out in order to evaluate the performance and effectiveness of our DL models.
6.1. Baseline Configurations DL Architectures
In our research, we employed CNN due to its excellent autoprofiling abilities. CNNs are especially appropriate due to their proficiency in handling large and complex datasets, where recognizing patterns and anomalies is crucial for effective intrusion detection. The architecture of CNNs supports the efficient processing of both statistical features derived from flow-based data and the sequential data characteristic of packet-based detection. This dual capability aligns perfectly with our unified approach, which seeks to enhance both accuracy and computational efficiency by combining flow- and packet-based methods.
Furthermore, CNNs have been widely adopted in intrusion detection research, as comprehensively surveyed in [41]. These prior studies have consistently shown that CNNs can effectively detect and classify anomalies and malicious activities, providing a strong empirical foundation for our decision to employ this technology.
Table 3 shows the architecture of our CNN model, which consists of three convolution layers for critical feature extraction and learning. The model also includes a pooling layer, a dropout layer, and a flattened layer, followed by three dense layers for classification, with a sigmoid function as the final activation step. To optimize the model performance, we employed Optuna, a Bayesian optimization framework, for hyperparameter tuning [42]. The tuning process explored a search space for key parameters, including the learning rate, batch size, kernel size, number of convolutional filters, dropout rate, and weight initialization strategies. Optuna’s Tree-structured Parzen Estimator (TPE) algorithm was used to efficiently navigate the hyperparameter space, selecting configurations that maximized detection accuracy while minimizing overfitting. This automated tuning process ensured that our CNN architecture was optimally configured for intrusion detection.
| Layer | Type | Filters/neurons/stride | Padding |
|---|---|---|---|
| 1 | 1D-ConV + ReLu | 32 (kernel size = 3) | Same |
| 2 | 1D-ConV + ReLu | 64 (kernel size = 3) | Same |
| 3 | 1D-ConV + ReLu | 128 (kernel size = 3) | Same |
| 4 | MaxPooling + dropout + flatten | Kernel size = 3, dropout = 0.5, stride = 2 | Same |
| 5 | Dense + ReLu | 256 | — |
| 6 | Dense + ReLu | 512 | — |
| 7 | Dense + sigmoid | 1 | — |
6.1.1. Dataset Configuration
As previously mentioned, dataset creation involves generating two types of traffic: benign and malicious. This ensures a comprehensive dataset, covering various scenarios and capturing microservices application nuances in normal and malicious behaviors.
The dataset was split into three parts: 70% for the training set, 15% for the testing set, and 15% for the grey zone investigation set. The grey zone investigation set was used for a more comprehensive exploration of output probabilities, thereby increasing the diversity and range of these probabilities. By allocating a dedicated grey zone investigation set, we could effectively evaluate and fine-tune the system’s performance within this critical zone, ensuring robust and accurate results.
6.1.2. Evaluation Strategy
The evaluation of the models in this study focuses on two main aspects: their classification performance and computational complexity. The latter is measured using the Linux-based PERF tool, which calculates the number of instructions required to process a single flow, while for the former, we used F1 score, precision, recall, and accuracy.
6.2. Detection Performance Flow-Based Detection
A DL model necessitates a threshold for data classification. To achieve an optimal balance between precision and recall, and thus maximize the F1 score, we employed an exhaustive search strategy. This strategy enabled us to identify the most suitable threshold of detection for our model, which was found to be 0.513222. Hence, any score below this threshold is classified as benign, while scores above this threshold are marked as malicious.
Figure 12 displays the confusion matrix of our model’s flow-based performance. The model achieved a high accuracy of 98.2% in correctly identifying benign traffic but resulted in a 1.8% FN rate, indicating 122 instances of incorrectly classified data. For attack traffic, the model’s accuracy was even higher at 99.2%, with a 0.8% FP rate. Analyzing the FPs revealed that most of them were caused by noisy attacks, specifically DoS attacks.
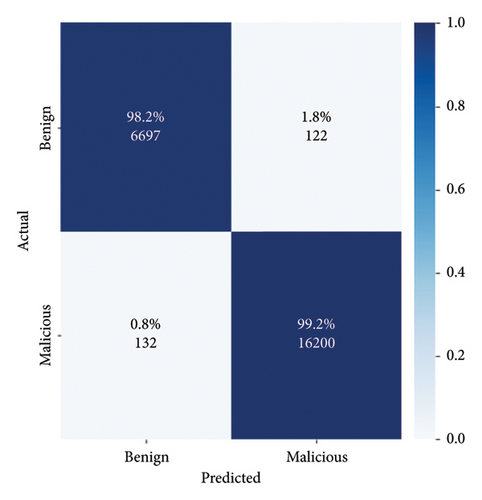
We conducted two types of DoS attacks: ICMP and HTTP. The flow-based detection method struggled to accurately classify HTTP-based attacks due to the similarity in statistical information between malicious and normal requests.
6.2.1. Packet-Based Detection
Figure 13 illustrates the confusion matrix for the packet-based detection method. It clearly exhibits superior performance compared to the flow-based method. The packet-based approach achieves an impressively low FN rate of 0.1%, and an accuracy rate of 100% in classifying malicious traffic, indicating its high precision in correctly identifying such traffic. Moreover, this method proves that examining just three packets within a flow is sufficient to differentiate between traffic types. This greatly reduces the amount of data required for processing, leading to more efficient analysis.
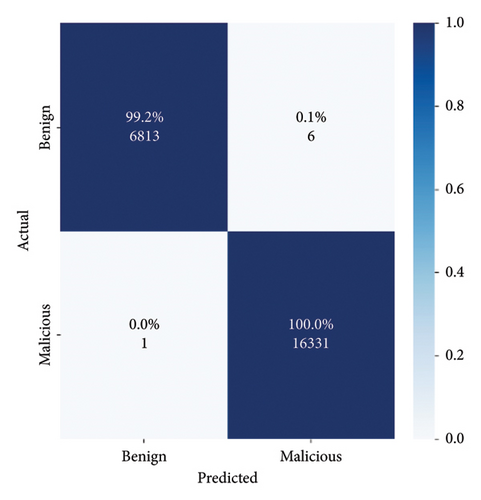
The packet-based method also outperforms the statistical features used in the flow-based approach by leveraging automatic feature learning. By adaptively and automatically learning spatial hierarchies of features through the convolutional layer, this approach can detect a vast array of features that may occur anywhere in the traffic, further boosting its effectiveness.
6.3. Key Features of the CNN Model
In a CNN model, key features refer to the specific patterns or characteristics in the input data that the model deems most important for making predictions. A CNN model is designed to automatically learn the key features from the input data during the training process. Through a series of convolutional and pooling layers, the model learns to extract and recognize hierarchical features at different levels of abstraction. We then extracted the key features by utilizing SHAP.
In this subsection, we explain the key features used by the CNN model in flow-based and packet-based detection.
6.3.1. Key Features in Flow-Based Detection
The key features extracted by the CNN model using NFStream represent the most relevant statistical characteristics of the flow-based data that are crucial for distinguishing between benign and malicious traffic. These features are essentially the unique patterns and properties that the model has learned to associate with each class, allowing it to accurately classify new traffic samples into the appropriate category. Figures 14(a) and b show the key features of flow-based for benign and malicious traffic. This visualization offers insights into how specific features influence the model’s predictions and contribute to its accuracy.
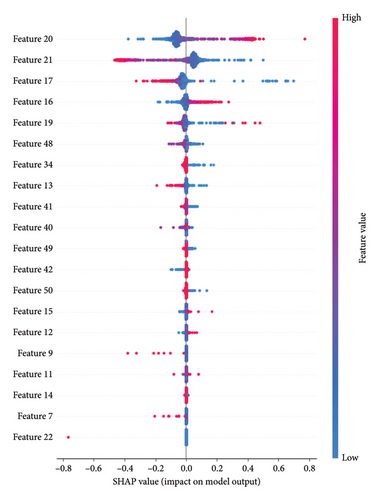
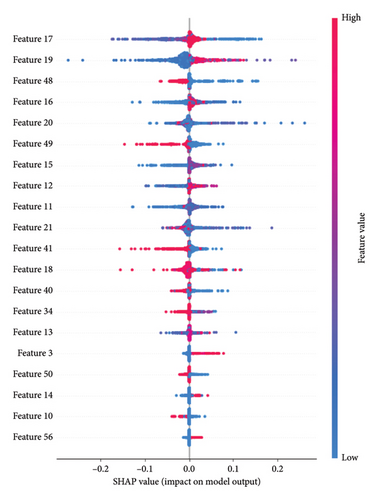
The y-axis of the figure displays a list of features, with more important features situated at the top and less important ones toward the bottom. The x-axis represents the impact of the features on the model’s predictions. Features on the right side contribute positively to increasing predictions, while those on the left contribute negatively.
The color coding within the bars adds an extra layer of information. Darker shades of blue correspond to lower feature values, while darker shades of red indicate higher feature values. This color scheme helps visualize the relationship between feature values and their impact on predictions.
- •
Maximum packet size within a flow: This feature is indicative of the largest singular data payload exchanged during a communication session. Malicious activities, especially those trying to exploit vulnerabilities, exfiltrate data, or upload malicious payloads, can often lead to packets that have atypical sizes compared to regular traffic. Benign traffic in our microservices environment, in general, tends to have maximum packet sizes that conform to expected norms.
- •
Standard deviation of packet size within a flow: Variability in the sizes of packets within a flow can be a sign of irregular or anomalous behavior. For instance, a DDoS attack using varying packet sizes or malware trying to hide its activities among regular traffic could lead to a higher standard deviation. Conversely, benign traffic, especially that of well-defined microservices, might exhibit a more consistent and predictable pattern, resulting in a lower standard deviation.
- •
Minimum packet size within a flow: Some malicious activities involve sending a flurry of smaller, often identical, packets to overwhelm a system (e.g., a type of DoS attack). This can result in a lowered minimum packet size for the flow. On the other hand, benign flows may occasionally have smaller control or acknowledgment packets, but malicious activities might be more pronounced in this aspect.
- •
Mean size of a flow: The average size of packets within a flow can provide insights into the overall nature of the communication. A flow with unusually large mean packet sizes might indicate data exfiltration or bulk transfer of malicious payloads, while a very low mean might suggest flooding attacks. Benign communications, depending on the application, tend to have mean packet sizes that are reflective of regular data exchanges, neither too small nor excessively large.
In conclusion, these flow-based features capture crucial aspects of the data communication patterns within a network. The subtle nuances and variations in these features between benign and malicious flows provide valuable insights, enabling a model to effectively discern between regular and potentially malicious traffic.
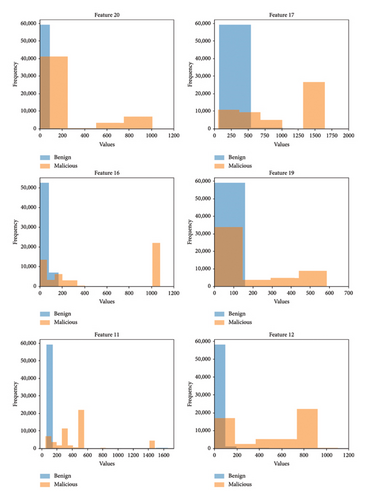
Furthermore, we carried out an exploration of the data distribution of these four key features, as shown in Figure 15. It is evident from the results that the distribution of data differs significantly between benign and malicious data. This observation supports our earlier explanations, emphasizing that benign traffic in a microservice environment demonstrates a more consistent and predictable pattern, while malicious traffic has a more diverse pattern. The clear separation observed in the data distribution is attributed to the model’s ability to effectively differentiate between the distinct data patterns associated with benign and malicious activities.
6.3.2. Key Features in Packet-Based Detection
In this section, we explore the key features in packet-based detection, which involves a dataset of 180 features extracted from 3 packets with 60 bytes each in every flow. Our analysis focuses on identifying the key features that the CNN model utilizes to determine the classification outcome. Figure 16 illustrates the significant features used by the CNN in distinguishing between benign and malicious data within packet-based detection.
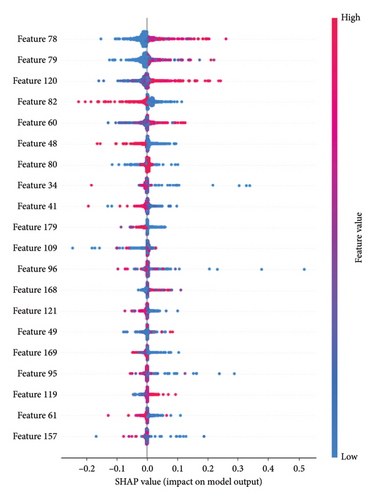
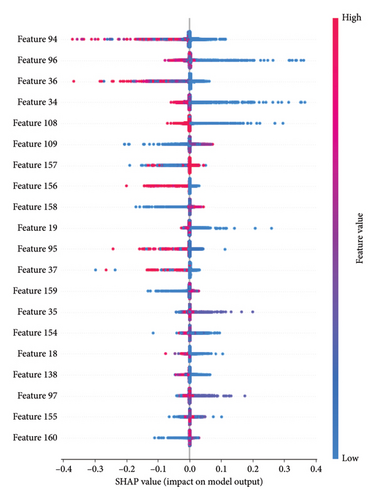
Upon analyzing the results, it becomes evident that several features significantly impact the CNN’s classification ability for benign and malicious traffic. In our deep analysis of these key features, we found that those key features are predominantly linked to the destination port within a flow, TCP window size value, and TCP sequence numbers.
Destination port within a flow plays a pivotal role in distinguishing between benign and malicious traffic. Specifically, the CNN model has learned that certain combinations destination ports are indicative of benign or malicious activities, leading to higher predictions when such patterns are detected.
Furthermore, the TCP window size value represents the amount of data (in bytes) that the receiver is willing to accept and buffer at any given time. This feature affects the flow of data between devices. The model identifies specific window size values that correlate with malicious behavior, contributing significantly to the model’s predictive accuracy.
TCP sequence numbers also contribute notably to the model’s predictions. The sequence numbers of TCP packets hold valuable information about the order and reliability of data transmission. While TCP’s initial sequence number (ISN) is randomly generated for security reasons, subsequent sequence numbers during a TCP connection increment predictably for each transmitted packet. This progression can be valuable information for a CNN, which might detect patterns in these sequence numbers that differ between benign and malicious traffic. Furthermore, DL models, especially CNNs, excel at identifying complex interactions between features. The sequence number might not be important on its own but in combination with other packet attributes. For example, analyzing the relative differences between sequence numbers in a data stream, combined with other features, may provide valuable insights.
The interpretability provided by the SHAP summary plot enhances our understanding of the CNN’s inner workings. It sheds light on the specific features that contribute to its high classification accuracy in identifying malicious network activity.
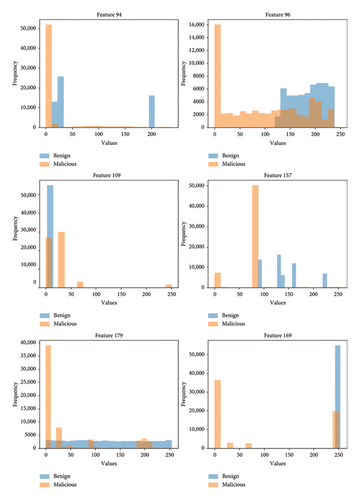
Moreover, we also conducted an investigation into the distribution of key data features and specifically focused on some key features, such as features 94, 96, 109, 157, 169, and 179. Figure 17 presents the data distribution between those features. From the figure, it can be seen that those features exhibit more varied distributions. Features with varied distributions can give the model more information to distinguish between different classes. The variation allows the model to capture unique patterns associated with each class, leading to improve the accuracy of the model.
6.4. Unified ML Approach: Flow and Packet
We have organized the explanations in this section into two subsections. The first subsection presents an analysis of the results obtained from finding the grey zone threshold. This threshold is used to filter misclassified data from the flow-based detection and then re-evaluate it in the packet-based detection. In the second subsection, we provide a detailed explanation of the results achieved when employing the unified flow-and-packet technique.
6.4.1. Grey Zone Threshold
To address the potential risk of overfitting while tuning the grey zone thresholds, we adopted a methodical approach leveraging separate datasets. Initially, we trained our model using a designated training dataset, ensuring that the model learned the underlying patterns without any influence from the subsequent datasets. Following the training phase, instead of directly employing the trained model on our testing data, we introduced an intermediary step. We used a distinct grey zone dataset to determine the optimal thresholds for classifying uncertain data points. This approach ensures that our thresholds are not biased by the characteristics of the training data. Furthermore, using a separate dataset for threshold determination acts as an additional validation layer, allowing us to gauge the threshold’s effectiveness on unseen data before actual performance testing. Finally, with our model trained and thresholds determined, we evaluated the entire system’s performance using a separate testing dataset. This segregation ensures that at each step training, threshold tuning, and testing the data involved is independent, minimizing the risk of overfitting and providing a more holistic and unbiased view of the system’s performance.
The grey zone dataset consists of 74,532 benign flows and 64,588 malicious flows, which were analyzed using the flow-based method. The flow-based method provided detection probabilities for each flow, and upon evaluation, we identified 501 instances of FNs and 1398 instances of FPs in the dataset.
To find the optimal grey zone threshold, we conducted an exhaustive search algorithm as shown in Figure 3. The results showed that the default threshold at the 0th percentile successfully captured all FN data, as shown in Table 4. Although 112 true-negative data points were also flagged for re-checking, this trade-off was deemed acceptable as they constituted only 0.5% of total true-negative data.
| Percentile | value | True-negative data | False-negative data |
|---|---|---|---|
| 0 | 1.97E − 05 | 112 | 501 |
| 0.1st | 0.00541815 | 8 | 500 |
| 0.5th | 0.0108242 | 8 | 498 |
| 1st | 0.0166902 | 6 | 496 |
| 2nd | 0.0167551 | 6 | 492 |
| 3rd | 0.157455 | 0 | 486 |
For the threshold values of τFP, the default threshold at the 99.99th percentile effectively captured almost all instances of FP data, as shown in Table 5. However, this resulted in 375 true-positive data points being flagged for re-checking, which remained below the 0.5% threshold of the total true-positive data. During the testing phase of our unified flow-and-packet ML model, we then used the defined thresholds.
| Percentile | value | True-positive data | False-positive data |
|---|---|---|---|
| 99.99th | 0.999982 | 375 | 1397 |
| 80th | 0.999982 | 375 | 1397 |
| 17th | 0.999919 | 274 | 244 |
| 15th | 0.619065 | 74 | 210 |
| 13th | 0.578193 | 44 | 193 |
| 12th | 0.578167 | 0 | 189 |
6.4.2. Flow vs. Packet vs. Unified
Our unified approach employs a two-step approach for detection. Initially, flow-based analysis is conducted, resulting in 122 FNs and 132 FPs, as depicted on the left side of Figure 18. To enhance the accuracy, we use the grey zone threshold to filter and forward 452 data points to the subsequent packet-based analysis for re-evaluation. The right side of Figure 18 shows the updated confusion matrix after re-correction by the packet-based method, revealing significant improvement with no FPs and only one FN remaining. This unified approach effectively enhances the overall performance of our detection model.
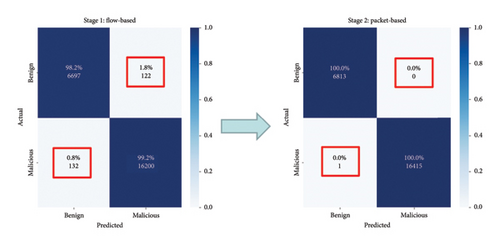
Table 6 presents the detection performance of our models: flow, packet, and unified. The unified approach stands out with the best performance, achieving an F1 score and recall of 100%. It successfully rectifies incorrect classifications from the initial stage, leveraging the strengths of both flow and packet–based detection. The unified approach’s exceptional performance highlights the advantages of this integrated approach.
| Data source | F1 score (%) | Precision (%) | Recall (%) | Number of instructions/flow |
|---|---|---|---|---|
| Flow | 99.22 | 99.19 | 99.25 | 15,635,967 |
| Packet | 99.98 | 99.99 | 99.96 | 672,117,601 |
| Unified | 100 | 99.99 | 100 | 27,801,023 |
Notably, the unified approach outperforms the other two, achieving a perfect score of 100% in both F1 score and recall. This showcases its ability to correct misclassifications from the initial detection stage, validating its effectiveness. The unified approach effectively combines the strengths of flow and packet–based approaches, resulting in superior performance.
Table 7 presents a comparative analysis of our method, MEMBER [8], and CNN–LSTM [25], which are among the most closely related works to ours. The results clearly demonstrate that our approach consistently outperforms both MEMBER and CNN–LSTM across multiple datasets. For example, in our self-generated dataset from a microservice environment, our method achieves an F1 score, precision, and recall of 100%, significantly exceeding MEMBER’s scores of 99.00%, 98.5%, and 99.5%, and CNN–LSTM’s scores of 98.8%, 99.87%, and 97.75%, respectively. Similarly, this superior performance is also evident in the CIC-IDS-2017, CIC-IDS-2018, and CREMEv2 datasets.
| Dataset | Method | F1 score (%) | Precision (%) | Recall (%) |
|---|---|---|---|---|
| Microservices (self-generated) | MEMBER [8] | 99 | 98.5 | 99.5 |
| CNN–LSTM [25] | 98.8 | 99.87 | 97.75 | |
| Ours | 100 | 99.99 | 100 | |
| CIC-IDS-2017 | MEMBER [8] | 99.06 | 98.42 | 99.7 |
| CNN–LSTM [25] | 99.25 | 97.00 | 98.1 | |
| Ours | 99.68 | 99.83 | 99.54 | |
| CIC-IDS-2018 | MEMBER [8] | 98.78 | 98.22 | 99.34 |
| CNN–LSTM [25] | 99.32 | 98.52 | 98.92 | |
| Ours | 100 | 100 | 100 | |
| CREMEv2 | MEMBER [8] | 97.67 | 96.71 | 98.65 |
| CNN–LSTM [25] | 98.55 | 97.02 | 97.78 | |
| Ours | 99.61 | 97.69 | 99.83 | |
- Note: Bold values indicate the best result.
Our unified model is geared toward adaptability and scalability, which are critical for the dynamic environments in which IDSs are deployed. In such environments, the ability to scale with lower resource consumption is often more valuable than small increments in accuracy. Our unified approach proves to be more efficient, achieving comparable performance while requiring fewer computational resources, as shown in Figure 19. Our system efficiently utilizes the flow-based model as the primary defense most of the time, which demands fewer computational resources, and employs the packet-based model, which requires more computational resources, as a secondary defense only when necessary. This approach strikes a better balance between performance and computational efficiency.
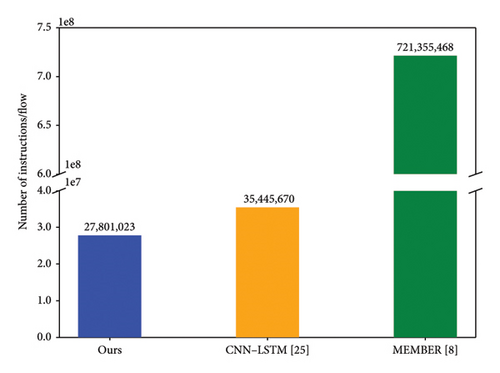
Moreover, Table 8 provides an overview of the time requirements for preprocessing and ML detection in both the flow-based and packet-based models, revealing that preprocessing is the main bottleneck. Specifically, preprocessing consumes 85% and 99% of the total time in the flow-based and packet-based models, respectively. In the flow-based method, most of the time is spent on feature extraction and statistical calculations, while the packet-based method dedicates the majority of its time to identifying flows and trimming them to a uniform length. Surprisingly, both the flow-based and packet-based methods spend a comparatively small amount of time for ML detection, with the flow-based detection being 20% faster than packet-based detection due to its lower data complexity. The results clearly demonstrate the superiority of the unified approach in detection and its significant improvement in computational resource utilization.
| Preprocessing | ML detection | Total | |
|---|---|---|---|
| Flow-based | 0.73 | 0.107 | 0.837 |
| Packet-based | 53.36 | 0.129 | 53.489 |
6.5. Unknown Attack Testing
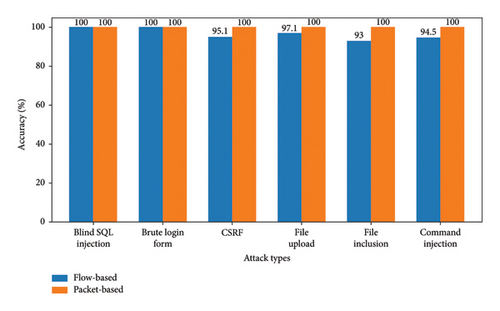
Figure 20 illustrates unknown attack testing accuracy for flow-based and packet-based approaches, covering six types of unknown attack attacks. Remarkably, our model achieved exceptional results, with accuracy above 95% for flow-based and 100% for packet-based detection, showcasing its robustness and strength. These outstanding results can be attributed to the superior generalization capabilities of the CNN model. The CNN’s ability to autonomously learn, construct, and interpret traffic patterns within complex networks allows it to detect previously unseen unknown attacks never encountered during training effectively. Furthermore, the ability of the CNN model to recognize unknown attack data reflects its flexibility and adaptability in recognizing and learning from various patterns in network traffic.
7. Conclusions and Future Works
This study presents a unified flow-and-packet ML approach designed for intrusion detection in microservice systems. Combining both flow-based and packet-based techniques, this unified model utilizes flow-based detection as the first defensive layer for shorter flows. Conversely, it uses packet-based detection for longer flows that require more substantial computation. When flow-based detection results in uncertain outcomes below a defined threshold, the data are flagged as potentially falsely detected and redirected to the packet-based detection system for further verification.
This new approach’s strength lies in its ability to correct misclassified data using the predetermined threshold. Moreover, it enhances the effectiveness and efficiency in identifying malicious traffic in a microservice system, expedites real-time detection, and holds the capability to detect unknown attacks. For generating datasets, this study adopts a systematic approach to automate the generation of both benign and attack traffic. It involves recording the generated traffic, processing it, and feeding it into our CNN models for both flow- and packet-based detection.
The experimental results demonstrate that this unified approach can achieve a 100% F1 score and recall, which is superior to using only flow or packet-based detection. Furthermore, it offers a 24 × reduction (approximately 1.38 orders of magnitude) in computational resource usage compared to using only the packet-based approach. This unified approach also proves to be robust against unknown attacks, boasting a 100% accuracy rate in detecting such attacks.
Future work could include evaluating the proposed unified method on real-world microservice systems to validate its effectiveness and scalability in live intrusion detection. This could extend to investigating the impact of different network types and microservice architectures on performance, as well as exploring its adaptability for detecting anomalies in more complex or heterogeneous environments.
Another area for future exploration is optimizing the grey zone threshold tuning process. While our current approach uses exhaustive search, we recognize that alternative optimization techniques, such as genetic algorithms or reinforcement learning, could provide a more adaptive and computationally efficient solution. These methods have the potential to dynamically adjust thresholds based on real-time feedback, improving both detection accuracy and resource efficiency. Integrating such optimization strategies could further enhance the scalability and automation of our framework.
Additionally, future research could focus on real-world deployment and evaluation of the proposed system to further validate its practicality and robustness in operational environments. This includes assessing performance under live traffic conditions, scalability across different infrastructures, and integration with existing security tools.
Conflicts of Interest
The authors declare no conflicts of interest.
Funding
This research was supported by the Industrial Technology Research Institute (ITRI), Taiwan. No funding was received for this manuscript.
Endnotes
Open Research
Data Availability Statement
The data that support the findings of this study are available on request from the first author. The data are not publicly available due to privacy or ethical restrictions.


