Statistical Optimization of Solid-State Fermentation by Aspergillus oryzae for Valorization of Olive Cake and Its Application as a Poultry Feed
Abstract
The agro-industrial wastes gained much attention in recent years as an alternative source of animal feed because of the accelerated increase in the prices of feed and the need for the safe disposal of these wastes. Olive cake (OC), as one of the supplementary olive oil extraction by-products, is distinguished by its excellent nutritional value. However, the crude untreated OC is fibrous with low protein content which makes it unsuitable for animal feed. In this investigation, four indigenous microorganisms (two bacteria, one yeast, and one filamentous fungus) were isolated from OC. These isolates were evaluated for their ability to valorize OC as poultry feed by reducing fiber content and increasing protein content under solid-state fermentation. The filamentous fungal isolate NFAO4 demonstrated the best performance for these objectives. NFAO4 fungal isolate was selected as the best isolate to valorize OC. It was identified as Aspergillus oryzae based on ITS sequencing with 97.35% similarity. The conditions of solid-state fermentation were optimized using one-factor-at-a-time approach to be beef extract, pH 6, incubation period of 14 days at 28°C, and 3% inoculum size. The nutritional value of OC was enhanced by decreasing the crude fiber percentage to 29.01 and the crude protein was increased by 1.67-fold. Statistical optimization determined the optimum factors to be 19.48, 7, 30°C, 2%, and 30% for fermentation time, pH, fermentation temperature, inoculum size, and moisture content, respectively, which decreased the fiber content to 28.1%. The treated OC was utilized alone without any additives as a rooster’s feedstuff for 48 h. Its gross energy and the apparent metabolizable energy were remarkably increased compared with untreated OC. These results demonstrated the ability of Aspergillus oryzae to increase the nutritional value and the digestibility of OC to be used as poultry feed without any additives.
1. Introduction
In the animal production system, costs of feeding account for 70% of the total cost. For poultry production field, it may exceed 75%. Feed supplies are extremely limited in many developing nations. The usage of grains and oil seeds for production of biofuel and biodiesel made this issue more challenging. So, finding novel, cheap, and nontraditional feedstuff is essential to control the overall cost [1]. To address these issues, a lot of efforts have been done to utilize agricultural by-products as a feed, which saves grains for human consumption and control the waste disposable cost [2, 3]. In Egypt, although thirty million tons of agricultural wastes are produced annually, only 7 million tons of these wastes are used as animal feed [4].
The solid residues from the extraction of olive oil are called olive cake (OC) which is one of the most prevalent agro-industrial by-products in the Mediterranean region, and its buildup and disposal lead to environmental issues [5]. More than 240,000 acres of land in Egypt is planted with olive trees, which yield roughly 580,000 tons of fruit annually. It was calculated that 100 kg of olives would yield about 35 kg of crude OC as agro-industrial by-products [4]. Depending on the method of olive oil production, OC can contain anywhere from 30% to 50% water and 2%–4% residual oil. It also has low protein % and a high fiber content in form of cellulose, hemicellulose, pectin, and lignin. It also contains a lot of fats, mostly polyunsaturated fatty acids. Although its composition varies, the main components of OC are proteins and fibers [6].
Several methods, most notably the manufacturing of animal feed and composting, have been implemented for the use and disposal of OC for lowering its environmental pollution [7]. One efficient method of recycling this by-product is to incorporate it into the diet of broiler chickens. There were no negative impacts on the growth performance, carcass features, internal organs, or blood hematology when it was given to broiler diets at a rate of 5%–10% [8]. On the other hand, a higher untreated OC level has a detrimental effect on the nutrient’s digestion [9]. Broiler diets should only contain a limited amount of unusual feed with high fiber and low protein concentrations. One strategy to raise the caliber and suitability of these feedstuffs for broiler diets is the fermentation process. There are several ways by which fermentation can improve the nutritional value of feed materials: (1) reducing the amount of fiber [10], (2) raising the amount of fat and crude protein (CP), (3) enhancing the availability of vitamins, and (4) enhancing the patterns of amino acids and protein solubility [11, 12]. Additionally, it has been demonstrated that fermentation improves the digestibility of several minerals, including calcium, nitrogen, organic matter, fiber, and amino acids [13]. It was also recorded to improve the palatability of feedstuffs [14].
According to [15], fermentation is a process that transforms complex substrates into simpler molecules by using microbes, substrates, and environmental factors. Solid-state fermentation (SSF) and submerged liquid fermentation (SLF) are the two main categories of fermentation processes [16]. SSF is a fermentation method that utilizes solid substrates with minimal free liquid, such as rice straw, corn cobs, rice bran, and wheat bran [5]. Based on the high output yield, SSF techniques have several benefits over submerged one [17]. Consequently, fermented dry feed (FDF), which may be made into a powder or crimped feed and mixed with whole grain, is generally made with SSF. Nutritionists are becoming interested in using agricultural by-products to improve animal production because of their enormous nutritional potentiality. Few microorganisms can perform the SSF method because of its limited moisture level. These include bacteria like Lactobacillus species and fungi like Aspergillus and Rhizopus species [5, 18].
Reports indicated that the kind and properties of the substrates used seem to play a key role in the remarkably varied results of fermentation [13]. Temperature, pH, moisture content, medium composition, addition of precursors, fermenter shear rates, and the duration of the fermentation process are some of the variables that can affect the rate of SSF and the quality of the product [19]. Traditionally, the one-factor-at-a-time approach has been used to optimize media, changing one variable while maintaining the same values for the others. This technique requires a lot of experimentation without taking into consideration the interaction between factors. Response surface methodology (RSM) is a recent common tool used in the optimization process. It combines statistical and mathematical techniques for the design and analysis of complicated processes with a small number of tests and minimal effort. It assesses the impact of altering many variables at once on the necessary response, investigates the interactions between variables, and prevents wasting valuable time and resources [20]. In this concern, our study aims for optimization of nutritional and environmental factors under SSF to biotransform and valorize the OC and its application as poultry feedstuff.
2. Materials and Methods
2.1. Sample Collection and Its Chemical Analysis
The OC was kindly gifted from ISIS organic company (Egypt), which produces olive oil continuously using a cold method. It was sun-dried under normal conditions. Before being analyzed, the dehydrated samples were placed in polyethylene bags and stored in the dark. OC analysis was performed according to AOAC [21] using triplicate samples for each determination. Ash was conducted by slowly charring about 2 g of the sample over a Bunsen burner. After that, the sample was burned in a muffle furnace at 600°C for 2 hours, or until the ash became gray or white. Crude fiber (CF) was determined by boiling the sample in H2SO4 and then in NaOH (each 1.25% w/v) for 30 min using an ANKOM 220 fiber analyzer (ANKOM Technology Corporation, NY, USA) [22]. All procedures were conducted to determine neutral detergent fiber (NDF), acid detergent fiber (ADF), and acid detergent lignin (ADL). Hemicellulose was estimated by subtracting ADF value from NDF, ADL from ADF, and insoluble ash from ADL for cellulose and lignin, respectively. Ether extract (EE) was extracted using ethyl ether by using Soxhlet apparatus. Siphoning continued for 8 h. The quantity of ammoniacal nitrogen in the tested sample for CP was measured using the Macro-Kjeldahl technique. Approximately 2 g of the sample was digested in 40 mL of concentrated sulfuric acid with the help of anhydrous nitrogen-free potassium and copper sulfates at ratio 5:1 as a catalyst. The ammonia content was determined by distilling the digested sample after addition of sodium hydroxide (50% w/v). Ammonia was then trapped in a boric acid indicator and titrated with sulfuric acid. 6.25 was used as a factor for protein percentage calculations. Nitrogen-free extract (NFE) was obtained by difference: NFE = 100 − (moisture % + CP % + Ash % + EE % + CF %).
2.2. Microbial Isolates
The indigenous microbial community of the OC was used for isolation, and 10 g of dried OC was mixed with 90 mL of sterile water to get 10−1 dilution. Next, 1 mL of this suspension was added to 9 mL of sterile water to get a 10−2 dilution. This process continued until a 10−5 dilution was achieved. 0.1 mL from each dilution was applied on the surface of a solidified nutrient agar plate for bacteria [23] and potato dextrose agar (PDA) medium for fungus and yeast (Difco Laboratories, Detroit, USA). For isolating bacteria, the plates were incubated at 30°C, and for fungus, the incubation was at 25°C. After incubation, separate colonies different in shape, color, and margins were picked up and restreaked on the surface of the suitable media to obtain pure isolates and then were stored on nutrient agar slants for bacteria and on PDA slants for the fungi [24].
2.3. Inoculum Size Preparation
Ten milliliters of sterile 0.1% Tween 80 solution was added to 5-day old culture slant and vigorously agitated using a vortex to prepare a spore suspension. The spore count was adjusted to 5 × 10⁷ spores/mL using hemocytometer [25].
2.4. Fermentation Medium and Microbial Selection
The used fermentation medium was mineral salt medium (MSM) as described in [26]. 500 mL Erlenmeyer flasks with one hundred grams of sterilized OC were inoculated with 1 mL of spore suspension (5 × 10⁷ spores/mL) of each strain. Using sterile MSM, the moisture content of every flask was brought down to 30% (v/w). The flasks were incubated in a static condition at 30°C and 25°C for 14 days for bacterial and fungal isolates, respectively. After incubation, OC was sun-dried for chemical analysis. The isolate showing the highest CF degradation and protein content in treated OC was identified for further studies.
2.5. Molecular Identification of the Most Promising Isolate
The mold isolate, which exhibited the highest degradation potential of complex CF and enhanced protein content, was subjected to molecular identification as described later.
2.5.1. DNA Extraction
The selected fungal isolate was cultivated on PDA broth medium, incubated for three to five days at 28°C, centrifuged for five minutes at 12,000 g, and then rinsed three times with 0.85% NaCl solution. The CTAB method was utilized to extract genomic DNA according to the method in [14]. The DNA aliquots were stored for further analysis at 20°C.
2.5.2. Amplification and Sequencing of the Internal Transcribed Spacer (ITS) Region
Using the universal primers ITS1 (5′-CTTGGTCATTTAGAGGAAGTAA-3′) and ITS4 (5′-TCCTCCGCTTATTGATATG-3′), the full-length ITS region of the chosen isolate was amplified [27]. Before sequencing, the PCR product’s purity was assessed using agarose gel electrophoresis (0.8% gel) for 45 min (80 v). A 3730xl automated sequencer and a Big Dye terminator cycle sequencing kit (Applied Biosystems, USA) were used to sequence the amplified product.
2.5.3. Phylogenetic Analysis of the Selected Isolate
The evolutionary history of the strain was inferred using the neighbor-joining method [28]. Using the maximum composite likelihood approach, the phylogenetic tree of the selected isolate was computed. One ITS rRNA gene amplified sequence from the selected isolate and 7 sequences that had the highest resemblance to the study’s isolate were used in the analysis. MEGA11 software (https://www.megasoftware.net) was used to conduct evolutionary relationships [29].
2.6. Studying the Factors Affecting OC Valorization by the Selected Isolate
Using a one-factor-at-a-time approach, optimization was carried out to valorize the OC by the most promising isolate by examining the effects of numerous factors on the MSM, including the nitrogen source, pH, incubation period, incubation temperature, and inoculum size. Every optimization experiment was conducted in 500 mL Erlenmeyer flasks filled with 100 g of dried OC, and the moisture content was adjusted to 30% and inoculated with 1% of the most promising isolate. After the incubation period, the OC was sun-dried and analyzed for CFs and CP %.
2.6.1. Nitrogen Source
The nitrogen source in MSM was substituted at the same concentration with peptone and beef extract as organic sources and potassium nitrate as an inorganic nitrogen as inorganic source [30, 31] and incubated for 14 days at 25°C. The optimum nitrogen source was used for further experiments.
2.6.2. pH
Different pH values (6.0, 7.0, 8.0, and 9.0) were used by adjusting the pH of the MSM using 0.1 N HCl or 0.1 N NaOH [30, 31]. The incubation was for 14 days at 25°C.
2.6.3. Incubation Period
To evaluate the impact of the incubation period of the selected isolate on the OC fiber degradation, flasks containing the optimal nitrogen source and pH were incubated for different time periods (3, 7, 14, and 21 days) at 25°C.
2.6.4. Incubation Temperature
Different incubation temperatures: 25°C, 28°C, 30°C, 32°C, and 35°C, were used to investigate its impact on the CF degradation of OC and its protein content [32].
2.6.5. Inoculum Size
The most promising isolate was used at 1%, 2%, 3%, 4%, and 5% inoculum sizes of 5 × 10⁷ spores/mL solution. The inoculum concentration (5 × 10⁷ spores/mL) was determined through a preliminary optimization study. We prepared spore suspensions of Aspergillus oryzae from 7-day-old cultures grown on PDA plates. The spores were harvested using sterile 0.1% Tween 80 solution [33]. Flasks were incubated at optimum incubation period and temperature. After incubation, dried OC cake was analyzed for CFs and protein content.
2.7. Statistical Analysis
CoStat statistics software Version 6.303 (2004) was used to conduct all experiments in three independent replicates and analyze the data using one-way analysis of variance (ANOVA) for multiple comparisons across groups. The least significant difference (LSD) test was used to identify significant differences (p < 0.05) between the means.
2.8. Statistical Design for Optimization of CF Degradation in OC by the Selected Isolate
For SSF, environmental variables such as fermentation temperature, pH, moisture content, fermentation time, and inoculum size are crucial [34]. The optimum values from the one-factor-at-a-time approach for pH, fermentation temperature, fermentation time, and inoculum size were used as center points for central composite design (CCD) of RSM. In this design, different variable levels, fermentation time (7–21 h), pH (5–7), fermentation temperature (25°C–30°C), inoculum size (2%–4%), and moisture content (30%–50%) were used for OC valorization under SSF (Table 1). A total of 50 runs with different variable combinations were examined including 18 factorial points, 24 axial points, and 8 repetitions at the center point. Design-Expert Version 13.0 software (State-Ease Inc., Minneapolis) was used.
| Factor | Code | Unit | Levels | ||
|---|---|---|---|---|---|
| Low | High | Center | |||
| Fermentation time | A | Days | 7 | 21 | 14 |
| pH | B | 5 | 7 | 6 | |
| Fermentation temp. | C | °C | 25 | 30 | 28 |
| Inoculum size | D | % | 2 | 4 | 3 |
| Moisture content | E | % | 30 | 50 | 20 |
2.9. Scaling Up of Fermentation Process
Large-scale fermentation was performed using 500 kg capacity bioreactor (S-F, Egypt) containing 200 kg of the OC. 150 L of the optimized MSM was used to adjust the moisture to 30% and then sterilized at 121°C. 2% as an inoculum size of the most promising isolate was inoculated in the 15 kg of sterilized OC as a starter culture for the fermentation process and incubated for 19.48 days at 30°C. After incubation, the fermented OC was sterilized to kill and get rid of any living cells and then dried at 65°C for 7 h in the bioreactor before the sun-drying step.
2.10. Biological Evaluation of OC on Poultry
3. Results and Discussion
3.1. The Chemical Composition of the OC
Low protein (5.07%) and moderately high fat (5.21%) characterize the unfermented OC utilized in this study, which is regarded as a dependable energy source and antioxidants for poultry nutrition. It also has a low ash level (4.41%) (Table 2). However, because of its difficulty in digestion, its usage as chicken feed is limited due to its greater proportion of CF (45.25%), with 75.96% NDF, 66.48% ADF, and 40.54% ADL. Low protein (5.07%) and moderately high fat (5.21%) characterize the unfermented OC utilized in this study, positioning it as a potential energy source and antioxidant reservoir for poultry nutrition, with its relatively low protein content reflecting the limited protein accumulation during olive fruit development [36]. The moderate fat content, attributed to residual olive oil post-extraction, contains beneficial unsaturated fatty acids and phenolic compounds with antioxidant properties [37], while the low ash content (4.41%) indicates minimal mineral accumulation, aligning with findings from the authors of [38] who reported ash values of 3.8%–7.2%. However, OC’s utilization in poultry feed faces significant limitations due to its high CF content (45.25%), characterized by substantial proportions of NDF (75.96%), ADF (66.48%), and ADL (40.54%), exceeding values reported by Sayehban et al. [39] who found CF levels of 38%–42% in Iranian OC samples. The high fiber content, particularly the lignified components, creates a physiological barrier to nutrient accessibility since poultry lack the necessary enzymatic machinery to break down complex cell wall structures effectively [40], with the elevated ADF fraction binding to nitrogen further compromising protein availability. These findings align closely with Neifar et al. [41], who documented protein levels of 4.9%–5.5% and CF ranging from 43% to 47% in Tunisian OC, and Chebaibi et al. [25], who reported similar values (protein: 5.2 ± 0.3%; CF: 44.8 ± 1.2%) in Moroccan varieties, suggesting a relatively stable nutritional profile across Mediterranean regions despite variations in olive varieties and processing methods.
| Content | Value |
|---|---|
| Ash (%) | 4.41 |
| Crude protein (%) | 5.07 |
| Crude fibers (%) | 45.25 |
| Ether extract (%) | 5.21 |
| Nitrogen-free extract (%) | 40.06 |
| NDF (hemicellulose) (%) | 75.96 |
| ADF (hemicellulose) (%) | 66.48 |
| ADL (lignin) (%) | 40.54 |
| Cellulose (%) | 25.95 |
| Gross energy (cal/kg) | 4613 |
3.2. Selection of the Most Promising Isolate
The challenge in this study is to isolate microorganisms with degradation capability of the complex fibers in the OC like lignin, cellulose, and hemicellulose and increase its protein content to allow poultry to digest. Based on this, four well-grown microbial isolates were recovered from OC, including two bacteria, one yeast, and one fungal isolate. Previous research reported the microbiome of OC including bacteria, yeast, and fungi [1]. These four isolates were able to grow on OC under SSF, and they were screened for valorizing OC by degrading CFs and increasing its protein content.
Microbial fermentation had a positive impact on the composition of OC, as demonstrated by the data shown in Table 3. The NFAO4 isolate produced the most encouraging findings in terms of a 1.49-fold increase in protein content, a 1.25-fold increase in fat content, a 1.03-fold increase in GE, and a 7.38% decrease in CF content. An increase in fungal biomass could be the cause of this rise in protein content. Additionally, extracellular fungal enzymes are secreted into the substrate to change the fiber components into monosaccharides [42]. Also, NFAO4 isolate decreased the hemicellulose, cellulose, and lignin percent. These could be attributed to the ability of NFAO4 to oxidize lignin by means of enzymes like lignin peroxidase and the release of hemicellulolytic enzymes [43]. Our findings concur with those of [25] that use different fungi to improve the protein content in OC. Consequently, microbial bioconversion improved the quality of OC to be used as a feedstock under SSF which could be a useful replacement for chemical and physical treatment [44].
| Analyses | Crude olive cake | NFAO1 | NFAO2 | NFAO3 | NFAO4 |
|---|---|---|---|---|---|
| Ash (%) | 4.41 | 6.42 | 5.02 | 5.80 | 5.90 |
| Crude protein (%) | 5.07 | 5.7 | 5.91 | 6.2 | 6.53 |
| Crude fibers (%) | 45.25 | 41.91 | 40.21 | 38.92 | 35.18 |
| Ether extract (%) | 5.21 | 6.53 | 5.95 | 5.63 | 6.50 |
| Nitrogen-free extract (%) | 40.06 | 43.02 | 45.91 | 45.36 | 46.89 |
| NDF (hemicellulose) (%) | 75.96 | 72.31 | 68.27 | 66.75 | 69.62 |
| ADF (hemicellulose) (%) | 66.48 | 59.97 | 62.92 | 56.60 | 64.93 |
| ADL (lignin) (%) | 40.54 | 33.57 | 36.59 | 32.34 | 39.37 |
| Cellulose (%) | 25.95 | 26.40 | 26.33 | 23.38 | 25.55 |
| Gross energy (cal/kg) | 4613 | 4663 | 4838 | 4778 | 4762 |
3.3. Identification of NFAO4 Isolate as the Most Promising Strain Using ITS Sequencing
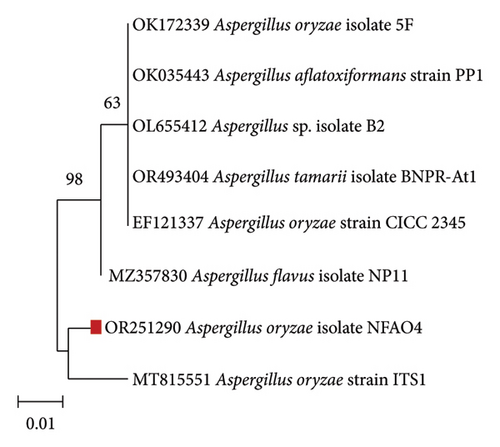
The ITS sequence of the NFAO4 isolate revealed that it was identified as A. oryzae with 97.35% similarity. The ITS sequences were uploaded to GenBank with the assigned accession number OR251290, and the neighbor-joining phylogenetic tree was constructed (Figure 1) to reveal the relatedness of the NFAO4 strain with its neighbors. The most significant class of microorganisms for SSF is the filamentous fungus [45]. Filamentous fungi as multicellular microorganisms can colonize and utilize the SSF substrates compared with unicellular microorganisms. Aspergillus sp. is one of the most significant genera of filamentous fungus that has been documented [46]. Gutiérrez-Correa et al. [44] reported A. oryzae, which is used to treat OC to improve its nutritional value for ruminant’s feed.
3.4. Studying the Factors Affecting OC Valorization by the Selected Isolate
To increase the nutritional value of the OC as a feedstuff, the fermentation conditions of the OC were optimized using A. oryzae NFAO4 strain by assessing the effect of various parameters such as nitrogen source, pH, incubation period, incubation temperature, and inoculum size. The summarized data in Figure 2 showed that the parameters were beef extract, pH 6, incubation for 14 days, incubation at 28°C, and a 3% inoculum size. These factors improved the nutritional value of OC as demonstrated by low CF and high protein content. The CFs of the fermented OC decreased down to 29.01 compared to 45.25 for untreated OC. Moreover, the CP increased to 8.51 compared with 5.07.
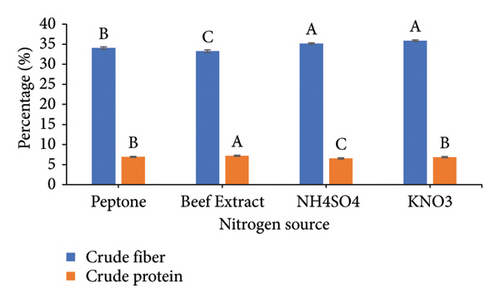
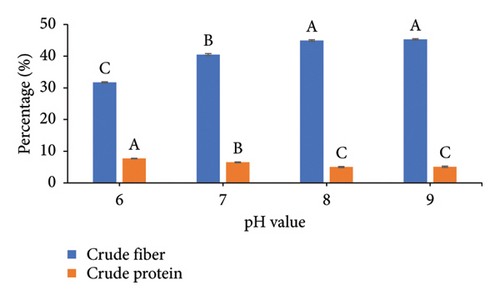
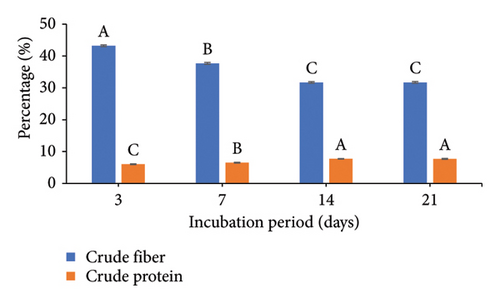
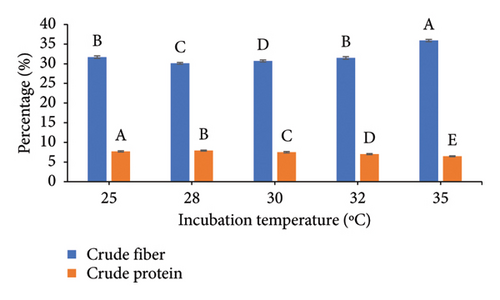

The successful implementation of SSF technology hinges critically on three key parameters: process optimization, microbial strain selection, and substrate characteristics. Economic viability and consistent availability drive substrate selection, making agro-industrial residues particularly attractive due to their abundance and low cost [7, 47]. In the context of protein enrichment, nitrogen source selection plays a pivotal role in the fermentation process. Our findings demonstrate that beef extract, serving as an organic nitrogen source, enhanced both fiber degradation and protein accumulation in OC compared to alternative sources. This observation aligns with recent studies by Liu et al. [26], who reported similar enhancement effects using organic nitrogen supplementation during fungal fermentation. The pH preference in our study corresponds to the well-documented acidophilic nature of fungi, particularly exemplified by Aspergillus nidulans which demonstrates optimal enzyme production at pH 6.0 under SSF conditions [48]. The fermentation duration optimization revealed peak efficiency at 14 days, with no significant improvements observed at 21 days. This plateau effect can be mechanistically explained by the proteolytic activity of Aspergillus oryzae NFAO4 strain during extended fermentation periods. Our findings are supported by the authors of [49], who observed maximum protein content in TOC at 25 days, after which protein levels declined due to continued enzymatic degradation. The correlation between fermentation duration and protein content underscores the importance of timing optimization in SSF processes to maximize protein enrichment while preventing degradative losses.
Temperature regulation stands as a critical determinant in fungal SSF, with even minor thermal fluctuations significantly impacting enzymatic synthesis and metabolic activities [51]. Our study identified 28°C as the optimal temperature for maximizing both protein enrichment and fiber degradation in OC. This finding aligns mechanistically with the work of Maurya et al. [32], who demonstrated peak lignocellulosic degradation at 30°C, with notable efficiency decline at elevated temperatures. This temperature sensitivity can be attributed to the thermal stability of fungal enzymes and their catalytic efficiency within specific temperature ranges. The relationship between inoculum size and fermentation efficiency revealed an optimal threshold at 3%, where protein content peaked and CF content decreased significantly. Increasing inoculum concentration beyond this point yielded no additional protein enrichment, consistent with observations by the authors of [49]. This plateau effect can be explained by the fundamental microbial competition for available nutrients and oxygen at higher inoculum densities. The mechanism involves accelerated substrate consumption and rapid oxygen depletion in densely populated cultures, leading to reduced metabolic efficiency and biomass production. This competition-based limitation emphasizes the importance of optimizing inoculum size to achieve maximum substrate conversion efficiency while maintaining adequate nutrient and oxygen availability for optimal fungal growth and protein synthesis.
3.5. Statistical Design of Optimization of CF Degradation in OC by the Selected Isolate
| Run | Fermentation time (A, days) | pH (B) | Fermentation temp. (C, °C) | Inoculum size (D, %) | Moisture content (E, %) | Crude fiber % | |
|---|---|---|---|---|---|---|---|
| Observed | Predicted | ||||||
| 1 | 21 | 5 | 30 | 4 | 50 | 32 | 31.67 |
| 2 | 21 | 7 | 30 | 2 | 30 | 28.2 | 28.25 |
| 3 | 21 | 5 | 25 | 2 | 50 | 31 | 30.28 |
| 4 | 30.6489 | 6 | 27.5 | 3 | 40 | 33 | 32.69 |
| 5 | 21 | 5 | 30 | 2 | 30 | 30.15 | 30.00 |
| 6 | 14 | 6 | 21.554 | 3 | 40 | 33.8 | 34.24 |
| 7 | 7 | 7 | 25 | 2 | 30 | 33.9 | 33.93 |
| 8 | 21 | 7 | 25 | 2 | 50 | 33 | 34.04 |
| 9 | 7 | 7 | 25 | 4 | 50 | 31.95 | 31.49 |
| 10 | 7 | 5 | 30 | 4 | 30 | 33.2 | 32.87 |
| 11 | 21 | 7 | 30 | 2 | 50 | 32 | 31.36 |
| 12 | 14 | 6 | 33.446 | 3 | 40 | 32.2 | 31.42 |
| 13 | 14 | 6 | 27.5 | 3 | 40 | 29 | 29.78 |
| 14 | 14 | 6 | 27.5 | 3 | 40 | 31.6 | 29.78 |
| 15 | 7 | 5 | 25 | 4 | 50 | 28.8 | 28.36 |
| 16 | 21 | 5 | 25 | 4 | 50 | 30.6 | 29.96 |
| 17 | 7 | 7 | 30 | 4 | 30 | 31.5 | 30.50 |
| 18 | 7 | 5 | 25 | 2 | 30 | 33.8 | 32.94 |
| 19 | 7 | 7 | 30 | 2 | 30 | 28.15 | 29.84 |
| 20 | 14 | 6 | 27.5 | 3 | 40 | 31.2 | 29.78 |
| 21 | 7 | 7 | 30 | 2 | 50 | 30.8 | 30.09 |
| 22 | 7 | 7 | 25 | 2 | 50 | 32.6 | 32.30 |
| 23 | 7 | 7 | 30 | 4 | 50 | 30.1 | 30.64 |
| 24 | 21 | 7 | 30 | 4 | 50 | 31.9 | 32.06 |
| 25 | 21 | 7 | 25 | 4 | 30 | 33 | 32.25 |
| 26 | 21 | 5 | 30 | 4 | 30 | 30.9 | 31.15 |
| 27 | 14 | 6 | 27.5 | 3 | 40 | 28.2 | 29.78 |
| 28 | 14 | 6 | 27.5 | 3 | 16.2159 | 32.3 | 31.89 |
| 29 | 21 | 5 | 25 | 2 | 30 | 30.7 | 31.52 |
| 30 | 7 | 7 | 25 | 4 | 30 | 32.9 | 33.23 |
| 31 | 7 | 5 | 30 | 4 | 50 | 29.7 | 30.53 |
| 32 | 21 | 5 | 25 | 4 | 30 | 30.8 | 31.31 |
| 33 | 14 | 6 | 27.5 | 3 | 40 | 29.4 | 29.78 |
| 34 | 14 | 8.37841 | 27.5 | 3 | 40 | 31.5 | 31.50 |
| 35 | 7 | 5 | 30 | 2 | 30 | 31.8 | 31.87 |
| 36 | 14 | 6 | 27.5 | 3 | 40 | 31.2 | 29.78 |
| 37 | −2.6489 | 6 | 27.5 | 3 | 40 | 32.7 | 32.67 |
| 38 | 14 | 6 | 27.5 | 3 | 40 | 28.2 | 29.78 |
| 39 | 14 | 6 | 27.5 | 5.37841 | 40 | 29.9 | 29.88 |
| 40 | 7 | 5 | 25 | 4 | 30 | 31.9 | 32.57 |
| 41 | 21 | 5 | 30 | 2 | 50 | 29.5 | 30.63 |
| 42 | 14 | 6 | 27.5 | 3 | 40 | 29.7 | 29.78 |
| 43 | 21 | 7 | 30 | 4 | 30 | 28.15 | 29.06 |
| 44 | 21 | 7 | 25 | 4 | 50 | 33 | 33.37 |
| 45 | 14 | 3.62159 | 27.5 | 3 | 40 | 30.2 | 29.86 |
| 46 | 7 | 5 | 30 | 2 | 50 | 29.7 | 29.65 |
| 47 | 14 | 6 | 27.5 | 3 | 63.7841 | 30.5 | 30.57 |
| 48 | 14 | 6 | 27.5 | 0.621586 | 40 | 29.8 | 29.48 |
| 49 | 21 | 7 | 25 | 2 | 30 | 33.5 | 32.80 |
| 50 | 7 | 5 | 25 | 2 | 50 | 28.2 | 28.83 |
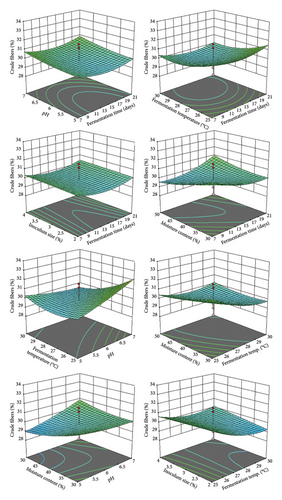
The ANOVA results (Table 5) indicated that the model is significant, with an F value of 5.62. There is only a 0.01% chance that such a large F value could occur due to random noise (p value < 0.05). In this case, all the tested factors (A), fermentation temperature (C), AE, BC, BE, CE, A2, and C2 are significant (Table 5). The lack-of-fit p value was 0.9589, indicating that it was not statistically significant. The predicted R2 (0.4906) is in reasonable agreement with the adjusted one (0.6536). This once further confirms that the current polynomial model is authentic. The recorded adequate precision ratio (Adeq prec = 9.250) suggested a decent signal, suggesting that the existing model may be effectively utilized for navigating the design space. Finally, the quadratic model’s significance is confirmed by the coefficient of variation (CV%) of 3.22, which shows the lowest difference between actual and predicted values. These findings align with the authors of [47], who emphasized the utility of 3D response surface plots in understanding parameter interactions in bioprocesses. The optimized temperature (30°C) corresponds with previous studies on lignocellulosic degradation, while the moderate inoculum size (2%) supports efficient substrate utilization without nutrient competition. The model’s prediction capability and optimization results provide a robust framework for scaling up OC fermentation processes, though further validation studies may be beneficial for industrial applications.
| Source | Sum of squares | df | Mean square | F value | p value |
|---|---|---|---|---|---|
| Model | 112.21 | 20 | 5.61 | 5.62 | < 0.0001 |
| A-fermentation time | 0.0003 | 1 | 0.0003 | 0.0003 | 0.9863 |
| B-pH | 5.19 | 1 | 5.19 | 5.20 | 0.0301 |
| C-fermentation temp | 15.26 | 1 | 15.26 | 15.29 | 0.0005 |
| D-inoculum size | 0.3055 | 1 | 0.3055 | 0.3062 | 0.5843 |
| E-moisture content | 3.31 | 1 | 3.31 | 3.32 | 0.0787 |
| AB | 0.1653 | 1 | 0.1653 | 0.1657 | 0.6870 |
| AC | 0.4278 | 1 | 0.4278 | 0.4287 | 0.5178 |
| AD | 0.0450 | 1 | 0.0450 | 0.0451 | 0.8333 |
| AE | 16.39 | 1 | 16.39 | 16.42 | 0.0003 |
| BC | 18.30 | 1 | 18.30 | 18.34 | 0.0002 |
| BD | 0.2278 | 1 | 0.2278 | 0.2283 | 0.6364 |
| BE | 12.25 | 1 | 12.25 | 12.28 | 0.0015 |
| CD | 3.71 | 1 | 3.71 | 3.72 | 0.0636 |
| CE | 7.03 | 1 | 7.03 | 7.05 | 0.0128 |
| DE | 0.0253 | 1 | 0.0253 | 0.0254 | 0.8746 |
| A2 | 14.55 | 1 | 14.55 | 14.58 | 0.0007 |
| B2 | 1.39 | 1 | 1.39 | 1.39 | 0.2475 |
| C2 | 16.10 | 1 | 16.10 | 16.13 | 0.0004 |
| D2 | 0.0193 | 1 | 0.0193 | 0.0193 | 0.8904 |
| E2 | 3.62 | 1 | 3.62 | 3.63 | 0.0666 |
| Residual | 28.94 | 29 | 0.9979 | ||
| Lack of fit | 15.85 | 22 | 0.7204 | 0.3853 | 0.9589 |
| Pure error | 13.09 | 7 | 1.87 | ||
| Corrected total | 141.15 | 49 |
The optimum conditions (Figure 3) for maximum CF degradation, as determined using 3D plots and numerical optimization in the software, were a fermentation time of 19.48 days, pH 7, fermentation temperature of 30°C, inoculum size of 2%, and moisture content of 30%. 3D graphs are useful for comprehending how independent variables function and how their interactions affect the intended responses [47].
3.6. Biological Evaluation
As shown in Table 6, the TOC recorded a higher GE (4838 cal/kg) than UTOC (4613 cal/kg). Similarly, AME was higher in TOC (2367 cal/kg) compared to UTOC (2226 cal/kg) (Table 3). This is a promising result, as OC was used without any additives for roaster feeding over 48 h. The slower digestion of UTOC, due to insufficient enzymes in the poultry’s digestive tract to break down its high fiber content, delayed gut clearance, reduced feed intake, and prolonged the time needed for the next meal. These improvements are particularly noteworthy given that the feeding trials were conducted with pure OC for 48 h in roasters. The enhanced digestibility can be mechanistically explained by the reduced fiber content in TOC, which addresses a fundamental limitation in poultry digestion. As [52] explained, poultry lack sufficient endogenous enzymes to effectively break down high-fiber materials, leading to slower feed passage rates in UTOC and consequently reduced feed intake due to prolonged gastric emptying time. Conversely, TOC’s reduced fiber content facilitates faster digestion and improved nutrient accessibility, resulting in enhanced GE and AME values. The promising energy utilization results suggest potential applications in poultry nutrition, though further research is warranted to evaluate long-term effects on various production parameters including body weight gain, egg production, and other performance indicators. Additionally, studies examining different inclusion rates and processing conditions could help optimize TOC’s utilization in commercial poultry feed formulations.
| Test material | UTOC | TOC |
|---|---|---|
| GE cal/kg | 4613a | 4838b |
| AME | 2226a | 2367b |
- Nore: The means in each column that have similar letters indicate that there is no significant difference (p < 0.05).
- Abbreviations: TOC, treated olive cake; UTOC, untreated olive cake.
4. Conclusion
Based on the presented results, it can be concluded that the applicability of A. oryzae to increase nutritive value of agro-industrial wastes by using statistical optimization under SSF. Utilizing its natural microbiota, OC was bioconverted to improve its digestibility and nutritional value to be used without additives in broiler feeding. Consequently, there would be a significant reduction in the cost of feeding, an improvement in financial returns, and a reduction in environmental pollutants. The effect of SSF should be considered as a positive contributor to improved economic and environmental conditions of using fermented OC in country feeding.
Conflicts of Interest
The authors declare no conflicts of interest.
Author Contributions
All the authors contributed to the research and writing of the manuscript. Hassan. A. F. Rahmy was responsible for funding acquisition, investigation, formal analysis, and resources. Salma Nour El-Dein was responsible for methodology and original draft. Fatma M. Abosamra was responsible for methodology. Fafy A. Mohammed was responsible for conceptualization, validation, visualization, writing, review, and editing. Abdalla Sayed Mohamed Korayem was responsible for data curation, project administration, formal analysis, and resources.
Funding
This work was supported by the PRIMA Program for Research, Technological Development, and Demonstration of the European Union (grant number: 2013/Call 2020 Section 1 Farming IA) (NEWFEED, https://newfeed-prima.eu/).
Acknowledgments
The authors would like to express their gratitude to the European Union’s PRIMA Program for Research, Technological Development, and Demonstration for funding this research work.
Open Research
Data Availability Statement
The data that support the findings of this study are openly available in Basic Local Alignment Search Tool at https://blast.ncbi.nlm.nih.gov/Blast.cgi?CMD=Web%26PAGE_TYPE=BlastDocs.


