Evolution of Cardiovascular Risk Factors Related to BMI and Metabolic Control in Children and Adolescents With Type 1 Diabetes Mellitus: A Cohort Study
Abstract
Purpose: This study aims to evaluate the evolution of cardiovascular risk factors related to body mass index (BMI) and metabolic control in children and adolescents with type 1 diabetes mellitus (T1DM) in the first year of the COVID-19 pandemic.
Methods: This is a retrospective cohort study of patients aged 2–16 years with a T1DM diagnosis ≥1 year at baseline treated at a diabetes clinic in Rio de Janeiro, Brazil. It was collected the trajectory of BMI-for-age (BMI/A) and height-for-age (H/A), lipid profile, and glycemic control (GC). The statistical analysis used mixed-effects linear regression models for longitudinal analysis. There was a significance level of 5%.
Results: There were a total of 136 patients; 74.3% were aged ≥10 years, and 66.2% had a time since diagnosis ≥5 years. At baseline, there was a predominance of eutrophy (66.2%). Over two-thirds (68.2%) of the patients had a glycated hemoglobin (HbA1c) value greater than the target, 24% high triglycerides (TG), 40.4% high total cholesterol (TC), 22.1% high low-density lipoprotein cholesterol (LDL-c), and 19% high non-high-density lipoprotein cholesterol (HDL-c) levels. BMI/A, TG, TC, and non-HDL-c increased significantly during the follow-up period.
Conclusion: In the first year of the COVID-19 pandemic, there was an increase in BMI/A and a worsening in the lipid profile of children and adolescents with T1DM. These manifestations may contribute to early diabetes complications.
1. Introduction
Type 1 diabetes mellitus (T1DM) is an autoimmune disease in which pancreatic beta cells are destroyed resulting in severe insulin deficiency [1]. The treatment of T1DM is complex and based on four pillars: insulinization, glucose monitoring, adequate energy supply and healthy diet, and physical activity. Because it is a chronic disease, T1DM requires continuous clinical follow-up with a multidisciplinary team composed of specialists trained in the management of diabetes such as nurses, doctors, nutritionists, psychologists, and physical educators. Patients and their families should be advised about the treatment to maintain good glycemic control (GC) and prevent acute and chronic complications [2].
Inadequate GC in patients with T1DM is one of the main factors associated with macro- and microvascular complications, and thus, maintaining a good GC is important for preventing or delaying disease complications such as neuropathies, nephropathy, dyslipidemia, and cardiovascular disease (CVD) [3, 4]. The presence of other risk factors for CVD, such as dyslipidemia, is also frequent in patients with T1DM [3]. Dyslipidemia is the primary cause of atherosclerosis. The atherosclerotic process begins in childhood and is characterized by chronic inflammation of the arterial wall and subsequent plaque formation. Risk factors for the formation of atheromatous plaques in arteries include lifestyle factors (e.g., atherogenic diet, sedentary lifestyle, obesity, and smoking), low levels of high-density lipoprotein cholesterol (HDL-c), high levels of triglycerides (TG) and low-density lipoprotein cholesterol (LDL-c), and diabetes [5]. Children and adolescents with DM have a more atherogenic lipid profile, characterized by an increase in LDL-c and TG and a decrease in HDL-c, which normally occur in response to higher blood glucose levels and insulin resistance (IR) [6].
Research suggests that the more atherogenic lipid profile in these patients is associated with significant weight gain, resulting from inadequate eating habits and a sedentary lifestyle [7]. Thus, patients with T1DM, once associated with thinness at diagnosis due to insulin deficiency, now have a higher prevalence of overweight, reflecting the global obesity epidemic. Excess weight, aging, and high insulin doses increase the risk of CVD in diabetic patients [8].
The outbreak of the novel coronavirus disease 2019 (COVID-19) caused by SARS-CoV-2 virus, declared as global pandemic by the WHO in March 2020, led to the worldwide disruption of the daily activities of the population due to a need for social isolation to slow down the spread of the disease. This disruption resulted in changes in lifestyle habits and eating behaviors that contributed to a rise in overweight and obesity in the general population beyond what was already being observed before the pandemic [9, 10]. Excess weight associated with the COVID-19 pandemic was due to an increase in processed food consumption, sedentary behavior, and screen time, contributing to metabolic changes and complications in individuals with cardiovascular risk diseases like T1DM [11, 12].
Assessing the impact of the COVID-19 pandemic on cardiovascular risk factors in children and adolescents with T1DM, particularly in regard to their nutritional and metabolic status, could inform prevention efforts for CVD. This is crucial as these diseases often go undetected in childhood and early identification of risk factors is necessary to reduce future CVD risk. In addition, it is important to promote healthy growth and development among individuals in this age group, because children and adolescents have specific nutritional needs that may not be met through unhealthy lifestyle habits such as poor diet, which is considered a lifestyle habit and thus modifiable through nutritional education and adequate clinical follow-up.
The literature lacks data on CVD in the pediatric age group, especially on the prevalence of morbidities, mortality, and occurrence of incidents. Few studies [9, 10] have investigated the impact of the COVID-19 pandemic on childhood health, even less in specific populations with chronic diseases such as T1DM. In addition, in determining whether lifestyle changes caused by the pandemic have had health consequences for these patients, our study provides valuable information to help policymakers design and implement public health policies in the future. Additionally, the specific objectives of the study were to describe longitudinally the nutritional status, GC (glycated hemoglobin [HbA1c]), and lipid profile (TG, total cholesterol [TC], LDL-c, HDL-c, and non-HDL-c) and to analyze the effect of sociodemographic (age and sex) and clinical (disease duration) variables on the outcomes (nutritional status, GC, and lipid profile).
2. Materials and Methods
2.1. Study Design
This is a retrospective cohort study of children and adolescents with T1DM treated at the diabetes clinic of the Martagão Gesteira Pediatrics and Puericulture Institute (IPPMG) of the Federal University of Rio de Janeiro (UFRJ), in Rio de Janeiro, Brazil, during the first year of the COVID-19 pandemic (March 2020 to March 2021). The data derived from medical records were collected for five outpatient consultations, namely, 1st consultation, study baseline; 2nd consultation, up to June 2020; 3rd consultation, June to September 2020; 4th consultation, September to December 2020; and 5th consultation, December 2020 to March 2021. Closed data that were not equidistant in time were collected for each patient, representing the trajectory of nutritional status, lipid profile, and GC indicators. Normally, patient care follows a pattern with consultations taking place every 3 months, except in specific cases. During the pandemic, there was no interruption of care; however, safety measures were adopted to preserve the health of patients and health team professionals. The health team is characterized by its multidisciplinary approach, and consultations are held with the presence of the entire team staff, including physicians, nutritionists, psychologists, social workers, and nurses.
2.2. Sample Calculation
To calculate the sample size, it was estimated that to detect a difference of 0.2 mmol/L between two means of HDL-c, considering a standard deviation (SD) of 0.3 and an alpha error of 5%, 111 participants would be needed to achieve a statistical power of 80%. The data for this calculation were based on the study by Donoghue et al. [13]. In addition, sample size was calculated at 41 children and adolescents to provide a statistical power of 80% to detect a difference of 1.1% between two means of HbA1c, considering a SD of 2.0 and an alpha error of 5%. Thus, the largest sample size estimated was considered, that is, 111, and both estimates were idealized based on the original studies.
2.3. Eligibility Criteria
The inclusion criteria were (1) age between 2 (standardization of anthropometric assessment) and 16 years (maximum age for care at the unit’s outpatient clinic) and (2) T1DM diagnosis ≥1 year in March 2020. The exclusion criteria were (3) the presence of other autoimmune diseases such as celiac disease, genetic syndromes, and sickle cell disease.
2.4. Study Variables
2.4.1. Dependent Variables (Outcomes)
The dependent variables were anthropometric indices (body mass index [BMI]-for-age [BMI/A] and height-for-age [H/A]), lipid profile, and GC. These variables were collected for the five consultations held between March 2020 and March 2021.
For the anthropometric evaluation, BMI/A and H/A z-scores were used. BMI (kg/m2) was calculated from body weight, in kilograms (kg), divided by the square of height, in meters (m). The institutional routine provides for the anthropometric assessment of patients by trained personnel. In accordance with the technical standards of the outpatient service, a PL-180 digital scale (Filizola, São Paulo, SP, Brazil) with a maximum capacity of 150 kg and an accuracy of 0.1 kg was used to measure body weight of children from 2 years of age and adolescents. Height was measured using a wall-mounted stadiometer (Tonelli, Criciúma, SC, Brazil) with an accuracy of 0.1 cm. Measurements were taken by trained personnel. Body weight was measured with the individual barefoot, wearing light clothing, free of accessories, standing upright, in the center of the scale platform, erect, looking at a fixed point at eye level, with feet together and arms extended at the side along the body. Height was measured subsequently to weight measurement, with the patient in the same conditions.
Anthropometric indices H/A and BMI/A were evaluated by calculating the z-score for each patient using the growth standards proposed by the WHO (2006–2007) as a reference for classification and recommended by the SISVAN protocol for healthcare (Brazil, 2011) for children 0–5 years and 5–19 years. For the calculations, the WHO Anthro (WHO, 2009) and WHO AnthroPlus (WHO, 2009) software were used for children up to 5 years and for children over 5 years and adolescents, respectively.
The following lipid profile parameters were evaluated: non-HDL-c (mg/dL), TC (mg/dL), LDL-c (mg/dL), TG (mg/dL), and HDL-c (mg/dL). For the assessment of the lipid profile, the fasting lipid panel reference ranges proposed by the 2019 Brazilian Guideline for Dyslipidemia and Atherosclerosis Prevention (Précoma et al., 2019) were considered. Non-HDL-c was calculated by subtracting HDL-c from TC.
GC was evaluated using HbA1c (%). A cutoff point of less than 7.5%, proposed by the American Diabetes Association (ADA, 2021) for all age groups, was used. The endpoint test was used to determine percentage HbA1c on a VITROS 5600, 4600, 5, 1, FS system (Ortho Clinical Diagnostics, Raritan, NJ, USA) according to the outpatient routine at the study institution.
For the analysis of serum lipid concentrations, the colorimetric test was performed using a VITROS 5600, 5, 1FS, 950, 250/350 system (Ortho Clinical Diagnostics). The LDL-c fraction was estimated using the Friedewald equation.
2.4.2. Covariates
Sociodemographic variables, including age (in years and months) and gender (female or male), in addition to the following outpatient follow-up variables were collected: time since T1DM diagnosis (years), total number of consultations in the study period, and insulin regimen (insulin dose/kg of ideal weight/day). Baseline variables were used as covariates, except for the total number of outpatient consultations.
2.5. Statistical Analysis
All analyses were performed using the Stata Data Analysis and Statistical Software version 13.1 (StataCorp LLC, College Station, TX, USA). The level of significance was set at 5%. Categorical variables are expressed as absolute frequency (n) and percentage (%). The normality of continuous variables was checked using the Kolmogorov–Smirnov test, with parametric variables expressed as mean ± SD and nonparametric variables as median and interquartile range (IQR, 25th and 75th percentiles). Comparisons between means were performed using analysis of variance (ANOVA) followed by the Bonferroni post hoc test.
Graphs were constructed to express the prevalence of cardiovascular risk factors related to nutritional and metabolic status (H/A, BMI/A, HbA1c, TG, TC, LDL-c, HDL-c, and non-HDL-c). Differences according to gender and time of consultation were analyzed using the chi-square test for proportions or Fisher’s exact test.
Changes in the trajectories of cardiovascular risk factors related to nutritional status and metabolic control during the study were evaluated using crude and adjusted longitudinal linear mixed-effects (LME) regression models. Each raw model was adjusted using the unstructured covariance matrix and included time-dependent and independent covariates, allowing for the inclusion of data from non equidistant repeated measurements, that is, measurements that were not necessarily obtained on the same day [14, 15]. The time until the deadline was included both as a random effect, because there was a variation in time between consultations, and a fixed one, referring to the baseline, to adjust for general and individual variations in risk factors during follow-up. The remaining covariates, that is, those variables that were collected only once for each participant (baseline) and for which it was not of interest to assess changes over the follow-up, were considered fixed effects.
An adjusted model was developed for each risk factor related to nutritional status (H/A and BMI/A), GC (HbA1c), and lipid profile (TC, LDL-c, TG, non-HDL-c, and HDL-c). Variables with p-value <0.20 in the longitudinal bivariate regression models were tested in the complete model [16]. From this model, variables with p-value ≥0.05 were removed one by one in descending order of p-value. Only the variables with p-value <0.05 were kept in the final adjusted models.
This analysis technique provides a “coefficient” and an “intercept.” The coefficient represents a combined estimate of an “average” trajectory of these factors for the cohort of patients, describing the relationship between its value and the time to (it should be noted that a value that increases as the deadline approaches will therefore have a positive coefficient). The intercept predicts the values of these factors at the time of the deadline [17].
To avoid bias in the research, the information was always systematically checked by the research coordinator and, and the team was periodically trained.
2.6. Ethics Approval
This study was conducted in accordance with the guidelines set out in the Declaration of Helsinki, and all procedures involving human beings were approved by the Research Ethics Committee (CEP), opinion number 4.803.295 O in accordance with the recommendations of resolution 466/12 of the National Health Council and its complementary ones (CNS, 2012). The person responsible for the research signed the Data Use Commitment Term (TCUD).
3. Results
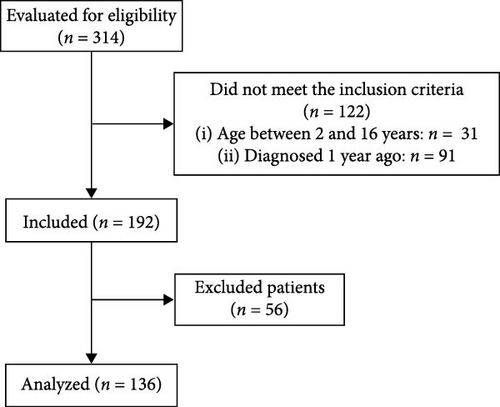
A total of 136 children and adolescents with T1DM were evaluated (Figure 1); most were aged ≥10 years (74.3%; n = 101) and had ≥5 years (66.2%; n = 90) at a time of diagnosis (Table 1). Descriptive statistics, including all data points collected, are summarized in Table 2. The means of cardiovascular risk factors related to nutritional status and metabolic control over the study period (and their variation from baseline to study deadline) was 0.03 (0.06 to −0.02) for H/A, 0.77 (0.65 to 0.81) for BMI/A, 8.06% (8.08% to 7.99%) for HbA1c, 80 mg/dL (71–86 mg/dL) for TG, 171 mg/dL (165–177 mg/dL) for TC, 94 mg/dL (91–97 mg/dL) for LDL-c, 109 mg/dL (103–114 mg/dL) for non-HDL-c, and 61 mg/dL (61–63 mg/dL) for HDL-c. There was a statistically significant difference in mean values between appointments for BMI/A (p-value = 0.048), TG (p-value = 0.015), TC (p-value = 0.033), non-HDL-c (p-value = 0.047), and HDL-c (p-value = 0.032).
| Variable | n (%) |
|---|---|
| Age (years)a | 11.4 ± 3.1 |
| Adolescent (≥10 years) | |
| No | 35 (25.7%) |
| Yes | 101 (74.3%) |
| Gender | |
| Female | 69 (50.7%) |
| Male | 67 (49.3%) |
| Time since diagnosis (years)b | 5.8 (4.2‒8.4) |
| Diagnosis time ≥5.0 years | |
| No | 46 (33.8%) |
| Yes | 90 (66.2%) |
| Number of appointmentsb | 4 (4‒5) |
| Insulin dose (UI/kg of IW/day) | 1.0 ± 0.2 |
- Abbreviation: IW, ideal weight.
- aMean ± standard deviation.
- bMedian (interquartile range, 25th and 75th percentiles).
| Variables | Timea | Observations/n patients | Average | Min | Max | p-Valueb |
|---|---|---|---|---|---|---|
| Height/A (z-score) | Total | 555/135 | 0.03 | −5.34 | 3.17 | ‒ |
| T1 | 135 | 0.06 | −5.34 | 2.62 | 0.978 | |
| T2 | 74 | 0.06 | −2.39 | 3.17 | — | |
| T3 | 114 | 0.09 | −5.22 | 3.03 | — | |
| T4 | 118 | −0.01 | −5.2 | 2.98 | — | |
| T5 | 114 | −0.02 | −5.08 | 2.87 | — | |
| BMI/A (z-score) | Total | 555/135 | 0.77 | −2.57 | 3.97 | ‒ |
| T1 | 135 | 0.65d | −2.44 | 3.81 | 0.048 | |
| T2 | 74 | 0.75 | −1.72 | 3.22 | — | |
| T3 | 114 | 0.88 | −2.57 | 3.81 | — | |
| T4 | 118 | 0.78 | −2.42 | 3.78 | — | |
| T5 | 114 | 0.81 | −2.45 | 3.97 | — | |
| HbA1c (%) | Total | 449/129 | 8.06 | 4.5 | 12.3 | ‒ |
| T1 | 129 | 8.08 | 5.1 | 11.8 | 0.181 | |
| T2 | 47 | 8.0 | 5.1 | 9.7 | — | |
| T3 | 85 | 8.2 | 5.6 | 11.2 | — | |
| T4 | 80 | 8.0 | 5.6 | 12.1 | — | |
| T5 | 108 | 7.99 | 5.0 | 12.3 | — | |
| TG (mg/dL) | Total | 286/104 | 80 | 11 | 301 | ‒ |
| T1 | 104 | 71c,f | 17 | 264 | 0.015 | |
| T2 | 18 | 103 | 53 | 199 | — | |
| T3 | 37 | 82 | 36 | 214 | — | |
| T4 | 43 | 77 | 36 | 281 | — | |
| T5 | 84 | 86 | 11 | 301 | — | |
| Total cholesterol (mg/dL) | Total | 291/104 | 171 | 107 | 308 | ‒ |
| T1 | 104 | 165c | 107 | 268 | 0.033 | |
| T2 | 20 | 188 | 140 | 268 | — | |
| T3 | 38 | 165c,f | 126 | 251 | — | |
| T4 | 45 | 171 | 111 | 261 | — | |
| T5 | 84 | 177 | 113 | 308 | — | |
| LDL-c (mg/dL) | Total | 290/104 | 94 | 35 | 212 | ‒ |
| T1 | 104 | 91 | 49 | 179 | 0.232 | |
| T2 | 20 | 115 | 69 | 179 | — | |
| T3 | 37 | 87 | 46 | 140 | — | |
| T4 | 45 | 94 | 35 | 197 | — | |
| T5 | 84 | 97 | 40 | 212 | — | |
| Non-HDL cholesterol (mg/dL) | Total | 290/104 | 109 | 38 | 251 | ‒ |
| T1 | 104 | 103c,f | 38 | 202 | 0.047 | |
| T2 | 19 | 139 | 100 | 202 | — | |
| T3 | 38 | 101c,f | 40 | 183 | — | |
| T4 | 45 | 109 | 46 | 176 | — | |
| T5 | 84 | 114 | 38 | 251 | — | |
| HDL-c (mg/dL) | Total | 290/104 | 61 | 21 | 106 | ‒ |
| T1 | 104 | 61 | 31 | 98 | 0.032 | |
| T2 | 19 | 51d,e,f | 34 | 77 | — | |
| T3 | 38 | 63 | 39 | 87 | — | |
| T4 | 45 | 62 | 21 | 103 | — | |
| T5 | 84 | 63 | 28 | 106 | — | |
- Abbreviations: BMI, body mass index; HbA1c, glycated hemoglobin; HDL, high-density lipoprotein; LDL, low-density lipoprotein; Max, maximum; Min, minimum; P, percentile; TG, triglycerides.
- aTime (months): T1 = baseline; T2 = 0‒3; T3 = 3‒6; T4 = 6‒9; T5 = 9‒12.
- bComparisons between means were performed using ANOVA followed by the Bonferroni post hoc test.
- cStatistically significant different from T2.
- dStatistically significant different from T3.
- eStatistically significant different from T4.
- fStatistically significant different from T5.
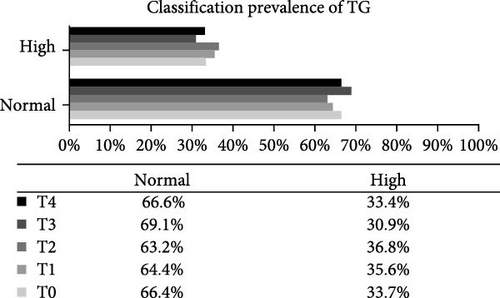
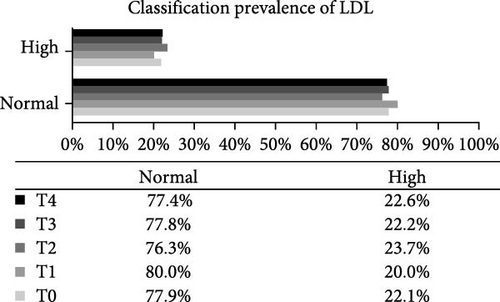
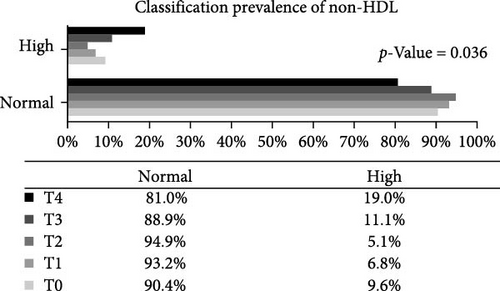
Analysis of the baseline prevalence of cardiovascular risk factors related to the nutritional status of patients revealed that there was a predominance of normal stature (97.8%) and eutrophy (66.2%) as measured by H/A and BMI/A, respectively. In addition, analysis of risk factors related to metabolic control showed that more than two-thirds of the patients (68.2%) had an HbA1c value greater than the desired target (≥7.5%). It is also worth highlighting the prevalence of patients with high levels of TG (24.0%), TC (40.4%), and LDL-c (22.1%), as well as those with low levels of HDL-c (14.4%). Over the study period, there was a statistically significant increase in the prevalence of overweight (p-value = 0.032) and a reduction in the prevalence of eutrophy (p-value = 0.02), and a significant increase in TC levels of patients classified as high TC (p-value = 0.01) and non-HDL-c levels in patients classified as high non-HDL-c (p-value = 0.036) (Figure 2). However, there were no statistically significant differences in prevalence between genders.

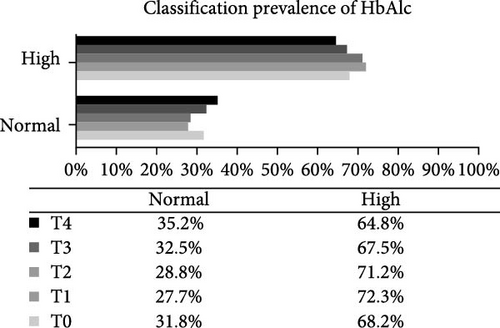

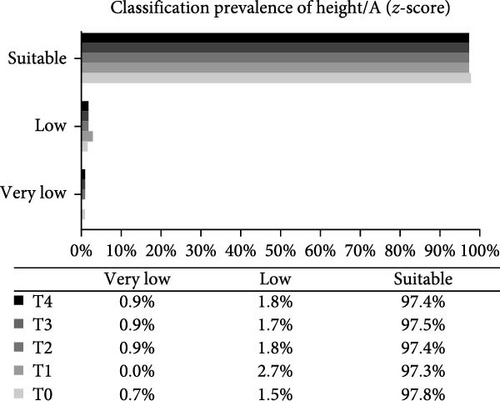
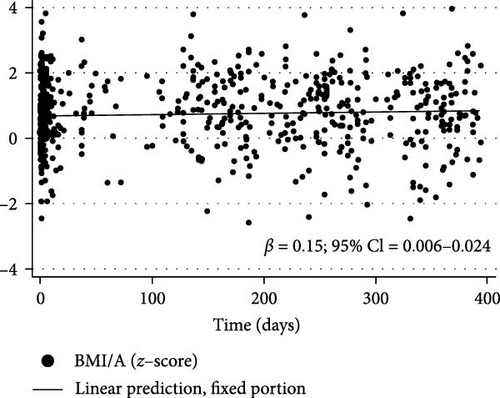
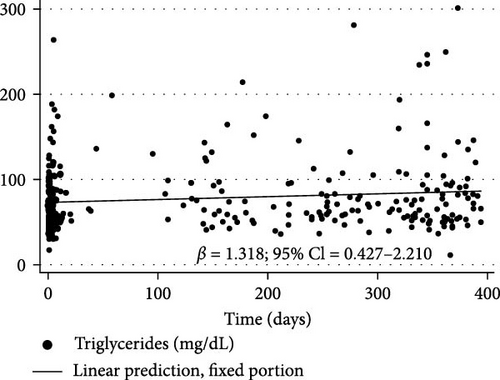
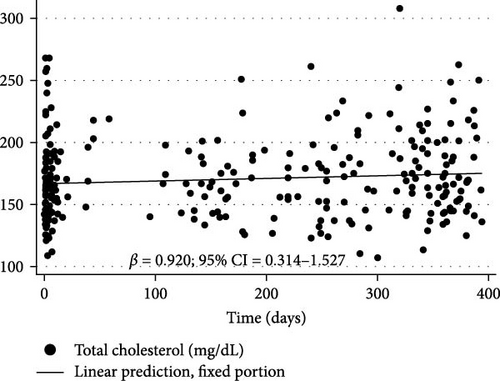
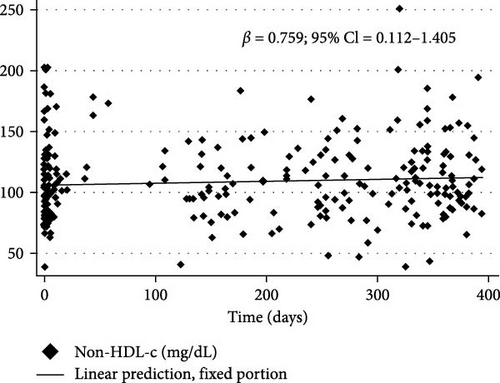
After analysis of the crude LME regression model for cardiovascular risk factors and categorical variables (age, gender, and time since diagnosis) of children and adolescents with T1DM, the candidate variables for the final model, that is, only those variables with p-value <0.05, were selected (Table 3). The final model showed that during the follow-up period, there was a significant increase in the order of ~0.015 per day for BMI/A (p-value = 0.002); 1.318 per day for TG concentration (p-value = 0.004), especially in boys where this increase was roughly 10 times greater (β = 13.951% and 95% confidence interval [CI] = 1.798 to 26.103); 0.92 per day for TC (p-value = 0.003); and 0.759 per day for non-HDL-c concentration (p-value = 0.021) (Table 4).
| Variables | βa | 95% CI | p-Value ∗ |
|---|---|---|---|
| Height/A (z-score) | −0.005 | −0.011 to 0.001 | 0.129 |
| (Age, years) ∗∗ | 0.044 | −0.016 to 0.106 | 0.148 |
| Gender (male/female) ∗∗ | −0.061 | −0.44 to 0.318 | 0.753 |
| Diagnosis time (years) | −0.003 | −0.065 to 0.06 | 0.931 |
| βb | 95% CI | p-Value ∗ | |
| BMI/A (z-score) | 0.014 | 0.006 to 0.024 | 0.002 |
| (Age, years) | −0.038 | −0.096 to 0.018 | 0.286 |
| Gender (male/female) ∗∗ | 0.156 | −0.202 to 0.513 | 0.393 |
| Diagnosis time (years) | −0.043 | −0.101 to 0.016 | 0.156 |
| βc | 95% CI | p-Value ∗ | |
| HbA1c (%) | −0.001 | −0.02 to 0.019 | 0.989 |
| (Age years) | 0.015 | −0.041 to 0.071 | 0.593 |
| Gender (male/female) ∗∗ | −0.003 | −0.031 to 0.015 | 0.133 |
| Diagnosis time (years) | 0.002 | −0.059 to 0.056 | 0.852 |
| βd | 95% CI | p-Value ∗ | |
| TG (mg/dL) | 1.303 | 0.415 to 2.192 | 0.004 |
| (Age, years) | 0.717 | −1.303 to 2.736 | 0.487 |
| Gender (male/female) ∗∗ | 13.951 | 1.798 to 26.103 | 0.024 |
| Diagnosis time (years) | 0.98 | −1.039 to 2.998 | 0.341 |
| βe | 95% CI | p-Value ∗ | |
| Total cholesterol (mg/dL) | 0.92 | 0.314 to 1.527 | 0.003 |
| (Age, years) | −0.646 | −2.247 to 0.955 | 0.429 |
| Gender (male/female) ∗∗ | 2.629 | −7.183 to 12.442 | 0.599 |
| Diagnosis time (years) | 0.393 | −1.994 to 1.208 | 0.63 |
| βf | 95% CI | p-Value ∗ | |
| LDL-c (mg/dL) | 0.308 | −0.246 to 0.863 | 0.276 |
| (Age, years) ∗∗ | −0.741 | −2.104 to 0.621 | 0.286 |
| Gender (male/female) ∗∗ | −1.034 | −9.401 to 7.333 | 0.809 |
| Diagnosis time (years) ∗∗ | −0.166 | −1.522 to 1.2 | 0.817 |
| βg | 95% CI | p-Value ∗ | |
| Non-HDL-c (mg/dL) | 0.759 | 0.112 to 1.405 | 0.021 |
| (Age, years) | −0.12 | −1.668 to 1.428 | 0.879 |
| Gender (male/female) ∗∗ | −5.572 | −15.001 to 3.858 | 0.247 |
| Diagnosis time (years) | 0.309 | −1.235 to 1.853 | 0.695 |
| βh | 95% CI | p-Value ∗ | |
| HDL-c (mg/dL) | −0.301 | −0.052 to 0.025 | 0.098 |
| (Age, years) | −0.117 | −0.878 to 0.644 | 0.763 |
| Gender (male/female) ∗∗ | 1.697 | −2.951 to 6.345 | 0.474 |
| Diagnosis time (years) | −0.45 | −1.208 to 0.308 | 0.244 |
- Abbreviations: β, longitudinal linear regression coefficient; BMI, body mass index; CI, confidence interval; HbA1c, glycated hemoglobin; HDL, high-density lipoprotein; LDL, low-density lipoprotein; TG, triglycerides.
- aβ refers to the crude longitudinal linear mixed-effects regression coefficient for H/A.
- bβ refers to the crude longitudinal linear mixed-effects regression coefficient for BMI/A.
- cβ refers to the crude longitudinal linear mixed-effects regression coefficient for HbA1c.
- dβ refers to the crude longitudinal linear mixed-effects regression coefficient for TG.
- eβ refers to the crude longitudinal linear mixed-effects regression coefficient for TC.
- fβ refers to the crude longitudinal linear mixed-effects regression coefficient for LDL-c.
- gβ refers to the crude longitudinal linear mixed-effects regression coefficient for non-HDL-c.
- hβ refers to the crude longitudinal linear mixed-effects regression coefficient for HDL-c.
- ∗ p-Value refers to the maximum likelihood estimator.
- ∗∗The male gender was considered the exposure with the female gender used as the reference.
| Final model | β | 95% CI | p-Value ∗ | Intercept | |
|---|---|---|---|---|---|
| 1 | BMI/A (z-score) | 0.015 | 0.006‒0.024 | 0.002 | 0.679 |
| 2 | TG (mg/dL) | 1.318 | 0.427‒2.21 | 0.004 | 67.0 |
| Gender (male/female) ∗∗ | 13.951 | 1.798‒26.103 | 0.024 | ||
| 3 | Total cholesterol (mg/dL) | 0.92 | 0.314‒1.527 | 0.003 | 165.07 |
| 4 | Non-HDL-c (mg/dL) | 0.759 | 0.112‒1.405 | 0.021 | 102.079 |
- Note: β refers to the adjusted longitudinal linear mixed-effects regression coefficient.
- Abbreviations: β, longitudinal linear regression coefficient; BMI, body mass index; CI, confidence interval; HDL, high-density lipoprotein; TG, triglycerides.
- ∗ p-Value refers to the maximum likelihood estimator.
- ∗∗In fixed effect categorical variables, the first category was considered the exposure with the second category used as the reference.
Figure 3 shows the changes in BMI/A z-scores (β = 0.015% and 95% CI = 0.006 to 0.024), TG (β = 1.318% and 95% CI = 0.427 to 2.21), TC (β = 0.92% and 95% CI = 0.314 to 1.527), and non-HDL-c (β = 0.759% and 95% CI = 0.112 to 1.405) over the first year of the COVID-19 pandemic in children and adolescents with T1DM as determined by longitudinal LME regression.
4. Discussion
The restrictions imposed during the first year of the COVID-19 pandemic elicited changes in the nutritional status and lipid profile of children and adolescents with T1DM. BMI/A increased throughout the study period, resulting in a significant increase in the prevalence of overweight among these patients. Similar findings were reported by Rifas–Shiman et al. [18] who examined COVID-19 pandemic-related changes in obesity and BMI among children and adolescents with chronic conditions, including diabetes. The authors observed that BMI increased during the pandemic, causing the prevalence of obesity to increase from 23.8%, before the pandemic, to 25.5%. They also found that obesity prevalence increased at a faster rate compared to the prepandemic period among children aged 5 to <13 years and 13 and <18 years, with the largest increases observed among boys aged 5 and <13 years.
A systematic review by Stavridou et al. [11] found that the increase in body weight and BMI/A among children and adolescents during the COVID-19 pandemic was associated with greater consumption of carbohydrates and fast food, reduced physical activity, and mood deterioration. It is important to mention that at the time of the study, children and adolescents were following remote class routines and circulation was reduced, as was the practice of physical activity, especially outdoors.
Rifas–Shiman et al. [18] highlighted the importance of addressing the impact of the pandemic on high-risk populations such as ethnic/racial minorities, low-income individuals, and individuals with chronic conditions, because weight gain in these groups is also affected by social factors such as poverty, racism, and poor healthcare.
It is well established that overweight in patients with diabetes is an additional risk factor for developing cardiovascular complications such as neuropathies, nephropathy, dyslipidemia, and CVD [1, 19]. Because obesity is a multifactorial disease, which involves biological, historical, ecological, political, socioeconomic, psychosocial, and cultural aspects [20], efforts from different sectors of society are needed to combat this global epidemic, while treatment based on behavioral and therapeutic intervention approaches has shown modest success so far. Thus, obesity prevention should be the primary goal and start in childhood to help children avoid future health problems [20].
Some studies that investigated the impact of COVID-19 restrictions on GC in young people with T1DM reported an increase not only in BMI/A but also in blood glucose values during the pandemic [10, 18, 21]. Kofoed and Timm [22] attributed the increase in HbA1c to the lack of face-to-face contacts in the diabetes clinic and the limited possibilities for practicing sports and having a social life outside the family. The authors also found that patients with worse GC before the pandemic improved their HbA1c levels, which may have been due to a more structured daily life, less daily stress, and better and easier contact with parents or legal guardians. The studies of Conejero et al. [2] and Cognigni et al. [23] also reported an improvement in GC, especially in patients with T1DM who had worse GC before the pandemic.
The reduction in outpatient visits in India during the COVID-19 pandemic resulted in a worsening of GC in patients with diabetes, mainly due to inadequate diet, lack of physical activity, and unavailability of insulin and other inputs [24]. Outpatient care in the current study was not suspended during the pandemic, which may explain why GC remained unchanged and there was no increase in HbA1c levels, highlighting the importance of patient follow-up by the multidisciplinary health team. Nevertheless, according to Jannoo and Khan [25], there are no guarantees that adherence to self-care activities alone would result in a good GC, which implies limiting the use of HbA1c as an indicator of good adherence.
Predieri et al. [26] reported that the follow-up of diabetic patients in Italy through teleconsultation combined with parental management contributed to improve GC in children and adolescents with T1DM during COVID-19 lockdown. In contrast, Santana and Liberatore [27] observed that despite promoting the follow-up of Brazilian patients with T1DM during the pandemic, teleconsultation was not efficient in helping patients maintain adequate GC, which may stem from the fact that GC is also influenced by socioeconomic and demographic factors such as gender, race/ethnicity, schooling, and income that put certain individuals at risk [28]. Thus, for these patients to be able to maintain adequate GC, several measures are necessary that depend both on the patient and their family but also on government actions to ensure rights such as access to medication and supplies and quality food in sufficient quantity to meet their nutritional needs.
Male gender is generally associated with worse glycemic levels, which can be attributed to a number of behavioral and cultural factors such as, for example, greater female awareness of the importance of taking care of their own health and the fact that the disease can be considered a sign of weakness [29], leading especially male adolescents to avoid consultations and seeking healthcare. Being of black or brown race/skin color also seems to increase the chance of worse GC [30], reinforcing the existence of ethnic and social disparities in the evolution of diabetes, in addition to the need for a discussion on the identification of barriers possibly related to a worse control of the disease by individuals of black or mixed race/skin color.
Studies show an association between parents with low education level and inadequate GC, highlighting the importance of the educational level in the process of understanding and managing the disease by the patient and caregivers [28, 30]. The ADA (ADA, 2021) [3] recommends that all people with diabetes should participate in diabetes self-management education and receive the necessary support to facilitate knowledge, decision-making, and mastery of skills necessary for diabetes self-care. Generally, parent education is linked to family income, so that the higher the income, the greater the access to health services, including the purchasing of healthcare plans and the use of first-line drugs with fewer side effects [28], which also contributes to better results in the treatment of T1DM. Although not all of these factors were evaluated in the current study, it is worth highlighting the importance of addressing them in future research to gain information that helps in understanding GC-related mechanisms in patients with T1DM.
There was a deterioration in some lipid profile parameters over the study period, including an increase in TG, especially in boys, TC, and non-HDL-c. Of these metabolic parameters, only the prevalence of normal and high TG did not show a statistically significant change at the end of the study. A systematic review and meta-analysis by Wafa et al. [31] found that implementation of lockdowns during the COVID-19 pandemic did not worsen GC in patients with diabetes, which was attributed to better adherence to medication. However, lipid parameters worsened, possibly due to poor dietary practices and physical inactivity during lockdown. Biancalana et al. [32] evaluated the short-term impact of COVID-19 lockdown on metabolic control in patients with type 2 DM in Italy and also found a worsening in the lipid profile, particularly TG, in contrast to the significant increase in the prevalence of high TG and non-HDL-c observed in the current study. Non-HDL-c includes all atherogenic lipoproteins, except HDL-c, and currently, high levels of non-HDL-c are strongly associated with an increased risk of CVD [33, 34].
Patients with diabetes are at greater risk of developing atherosclerosis than is the non-diabetic population[7] because of their more atherogenic lipid profile, which normally occurs in response to increased blood glucose levels and IR [6]. The atherosclerotic process begins in childhood and has been associated with lifestyle factors (e.g., atherogenic diet, sedentary lifestyle, obesity, and smoking), low levels of HDL-c, high levels of TG and LDL-c, and diabetes [5]. Importantly, the changes experienced by children and adolescents with T1DM during the pandemics, including weight gain, inadequate diet, and sedentary lifestyle, contribute to this atherosclerotic process. Thus, cardiovascular risk factors should be monitored since childhood, because CVD starts silently and is responsible for up to 44% of morbidity and mortality among patients with T1DM, generating an estimated cost associated with diabetes of 3 billion dollars per year in the United States alone [3, 34, 35].
In addition to a poor GC, serum level of TG and decreased HDL-c level are described as atherogenic dyslipidemia and are strictly combined with visceral adiposity, which enhances CVD risk [3, 35].
Because the scientific literature on COVID-19 is constantly evolving and only few studies [2, 9] have evaluated the impact of COVID-19 lockdown on the health of children and adolescents with T1DM, these findings can help inform the next steps to face the new challenges in the care of these patients, including future actions that should be taken in similar scenarios in which social isolation measures have to be adopted [34].
This study is one, among few, carried out with Brazilian pediatric patients with DM1 that aimed to investigate potential changes in the nutritional status and metabolic control of Brazilian pediatric patients with T1DM during the first year of the COVID-19 pandemic. The use of medical records is both a strength and a limitation of the study because, on one hand, all the necessary information was readily available and no participants had to be excluded a posteriori and, on the other hand, some additional information that would be of interest for the study such as data on food consumption and physical activity level, family income, and parent education, for example, were unrecorded. In addition, it is based on data from a single center with limited sample size, and short-term nature of the findings warrants cautious interpretation.
5. Conclusions
This study showed that there was an increase in BMI/A and a worsening in the lipid profile of children and adolescents with T1DM during the first year of the COVID-19 pandemic, in addition to an increase in the prevalence of overweight, high TC, and high non-HDL-c, which may contribute to early diabetes-related complications such as CVD. Thus, it is worth highlighting the importance of health actions aimed at preventing overweight and dyslipidemia in pediatric patients with T1DM to also prevent stunted growth and development. In addition, it is worth emphasizing the importance of creating effective public policies aimed at this specific population to guarantee that patients with T1DM have access to adequate and equitable treatment conditions, including but not limited to access to medication and supplies, incentive and support for healthy eating, and encouragement for physical activity.
Conflicts of Interest
The authors declare no conflicts of interest.
Funding
The research was carried out with the support of the Coordination for the Improvement of Higher Education Personnel, Brazil (CAPES) and FAPERJ—Fundação Carlos Chagas Filho de Amparo à Pesquisa do Estado do Rio de Janeiro (Proc. 298725).
Acknowledgments
The authors would like to thank the pediatric hospital where the research was carried out, everyone who participated in data collection and analysis, and the children and adolescents with diabetes who participated in this study and their families. Patricia de Carvalho Padilha would like to thank the National Council for Technological and Scientific Development (CNPq) for their research productivity fellowships.
Open Research
Data Availability Statement
The data are not publicly available due to privacy or ethical restrictions.


