Eicosapentaenoic Acid (EPA) Alleviates LPS-Induced Oxidative Stress via the PPARα–NF-κB Axis
Abstract
Metabolic-endotoxemia, characterized by the translocation of lipopolysaccharide (LPS) from Gram-negative bacteria into the bloodstream, is a key contributor to chronic low-grade inflammation associated with obesity and type 2 diabetes. This condition exacerbates metabolic disruptions by activating Toll-like receptor 4 (TLR4) on macrophages, leading to the release of pro-inflammatory cytokines and subsequent insulin resistance. Eicosapentaenoic acid (EPA; C20:5 (n-3)), an omega-3 polyunsaturated fatty acid, has demonstrated anti-inflammatory and antioxidative properties, but its precise mechanisms of action in mitigating LPS-induced stress remain unclear. This study investigates the pathways through which C20:5 (n-3) alleviates LPS-induced oxidative stress and inflammation in macrophages. C20:5 (n-3) pretreatment significantly reduced LPS-induced inflammatory responses, decreasing IL-1β and IL-6 expression and IL-1β secretion, and lowering the percentage of HLA-DR+ macrophages. C20:5 (n-3) also attenuated ER stress, evidenced by reduced expression of ATF4, DDIT3, HSPA5/GRP78, BIP, and CHOP at both gene and protein levels. Oxidative stress was mitigated, as shown by decreased HIF1α expression, reduced ROS levels, and preservation of mitochondrial membrane potential. Importantly, C20:5 (n-3) increased the expression of PPARα and FABP5 while inhibiting NF-κB activation independently of the TLR4-IRF5 pathway. The protective effects of C20:5 (n-3) was abolished by PPARα inhibition with GW9662, indicating that C20:5 (n-3)’s action is PPARα-dependent. This study highlights the modulatory role of C20:5 (n-3) in alleviating LPS-induced oxidative stress and inflammation in macrophages through activation of the FABP5/PPARα/NF-κB axis, independently of TLR4-IRF5 signaling. These findings reveal a novel mechanism for C20:5 (n-3)’s anti-inflammatory effects and suggest that targeting the FABP5/PPARα pathway may offer therapeutic potential for treating metabolic disorders associated with chronic inflammation.
1. Introduction
Obesity and type 2 diabetes are rapidly emerging as significant global health challenges, frequently co-occurring with other metabolic disorders, including insulin resistance, metabolic syndrome, and cardiovascular disease [1, 2]. A common feature across these conditions is chronic low-grade inflammation, which is partly attributed to increased levels of circulating proinflammatory cytokines. Although the precise triggers of this inflammatory state are not fully understood, the translocation of lipopolysaccharide (LPS) from Gram-negative bacteria into the bloodstream has been suggested as an initiating factor [3]. This process, known as metabolic endotoxemia, is often exacerbated by high-fat diets, which increase plasma LPS levels, promoting inflammation and metabolic disruptions [4]. LPS mainly acts through Toll-like receptor 4 (TLR4) on immune cells (primarily macrophages), where it triggers a cascade of inflammatory mediators such as IL-1β, IL-6, and TNFα. These mediators subsequently drive insulin resistance and metabolic dysfunction [5].
LPS-induced inflammation is known to contribute to endoplasmic reticulum (ER) stress and oxidative stress, both of which are pivotal in the pathogenesis of metabolic diseases. ER stress arises from an accumulation of misfolded proteins in the ER, initiating the unfolded protein response (UPR) to restore cellular homeostasis [6]. Persistent ER stress, however, can lead to cell death through apoptosis. Similarly, oxidative stress, caused by an imbalance between reactive oxygen species (ROS) production and detoxification, damages cellular components, including lipids, proteins, and DNA, and further amplifies inflammatory signaling pathways [7, 8]. Together, the interplay of ER stress, oxidative stress, and inflammation forms a vicious cycle that underpins the progression of obesity and type 2 diabetes.
Omega-3 polyunsaturated fatty acids (PUFAs), especially eicosapentaenoic acid (EPA; C20:5 (n-3)), have demonstrated protective effects against inflammation and oxidative stress [9]. C20:5 (n-3), a 20-carbon chain with five double bonds, is a long-chain omega-3 fatty acid primarily found in fish oil. It enhances lipid and carbohydrate metabolism and exerts anti-inflammatory effects by interacting with several nuclear receptors. C20:5 (n-3) directly modulates inflammation by engaging with peroxisome proliferator-activated receptors (PPARs), which regulate genes involved in lipid metabolism, energy balance, and inflammation [10].
Although fatty acids like C20:5 (n-3) are recognized for their anti-inflammatory properties, the underlying mechanistic pathways remain poorly understood, particularly in the context of LPS-induced endotoxemia. In the present study, we aimed to investigate the mechanistic pathway through which C20:5 (n-3) alleviates LPS-induced oxidative stress, with a focus on the PPARα–NF-κB axis. Using a cell culture model, we examined C20:5 (n-3)’s effects on inflammation, membrane potential, and ROS levels. Our findings indicate that EPA’s anti-inflammatory action requires the activation of PPARα and FABP5 to inhibit NF-κB and is independent of the TLR4-IRF5 pathway. This study provides insights into the potential therapeutic role of C20:5 (n-3) in modulating cellular stress responses associated with obesity and metabolic diseases.
2. Materials and Methods
2.1. Cell Culture
THP-1 human monocytic cells, obtained from the American Type Culture Collection (ATCC), Manassas, VA, USA, were cultured in RPMI-1640 medium (Gibco, Thermo Fisher Scientific, Waltham, MA, USA). The medium was enriched with 10% fetal bovine serum (Gibco, Thermo Fisher Scientific, Waltham, MA, USA), 2 mM L-glutamine (Gibco, Thermo Fisher Scientific, Waltham, MA, USA), 1 mM sodium pyruvate (Gibco, Thermo Fisher Scientific, Waltham, MA, USA), 10 mM HEPES (Gibco, Thermo Fisher Scientific, Waltham, MA, USA), 100 µg/mL Normocin (InvivoGen, San Diego, CA, USA), and antibiotics comprising 50 U/mL penicillin and 50 µg/mL streptomycin (Gibco, Thermo Fisher Scientific, Waltham, MA, USA). The cells were maintained at 37°C in a humidified atmosphere containing 5% CO2.
2.2. Macrophage Differentiation
Before stimulation, THP-1 monocytes were differentiated into macrophages as published previously by AlSaeed et al. [11]. Briefly, cells were exposed to 10 ng/mL phorbol-12-myristate-13-acetate (PMA, Sigma–Aldrich, Merck KGaA, Darmstadt, Germany) for 3 days. This was followed by an additional 3-day resting period in RPMI medium devoid of serum and PMA to ensure the cells were adequately primed for further experiments.
2.3. Cell Stimulation
Monocytes were seeded into 12-well plates (Costar, Corning Incorporated, Corning, NY, USA) at a density of 1 × 10⁶ cells per well, unless noted otherwise. Differentiation into macrophages was done followed the previously outlined protocol of AlSaeed et al. [11]. The cells were then pre-incubated for 24 h at 37°C with either 200 µM C20:5 (n-3) (cis-5,8,11,14,17-Eicosapentaenoic acid (EPA); Cat # E2011, Sigma–Aldrich, Merck KGaA, Darmstadt, Germany) or 24% bovine serum albumin (BSA; Sigma–Aldrich, Merck KGaA, Darmstadt, Germany) which served as the vehicle control for C20:5 (n-3). Posttreatment, the cells were exposed overnight to 10 ng/mL LPS (10 ng/mL; L4391, Sigma–Aldrich, Merck KGaA, Darmstadt, Germany), which was reconstituted in sterile RPMI-1640 medium. To investigate PPARα involvement, cells were pretreated for 1 h with 32 nM GW9662 (Bio-Techne, Tocris Bioscience, Bristol, UK), dissolved in DMSO (Sigma–Aldrich, Merck KGaA, Darmstadt, Germany). An equivalent volume of 0.01% DMSO was used as vehicle control in these experiments. Following GW9662 pretreatment, cells were treated with C20:5 (n-3) or vehicle (24% BSA) for 24 h and then challenged overnight with LPS.
2.4. Preparation of BSA-Fatty Acid Complexes
Complexes of BSA (Sigma–Aldrich, Merck KGaA, Darmstadt, Germany) and fatty acids were prepared using a method adapted from van Harken, Dixon, and Heimberg [12, 13]. Briefly, a 24% (w/v) BSA (Sigma–Aldrich, Merck KGaA, Darmstadt, Germany) solution was prepared by gradually dissolving fatty-acid-free BSA (Cat # A6003, Sigma–Aldrich, Merck KGaA, Darmstadt, Germany) in 150 mM NaCl (Sigma–Aldrich, Merck KGaA, Darmstadt, Germany), adjusting the final pH to 7.4 with 5M sodium hydroxide (NaOH; Sigma–Aldrich, Merck KGaA, Darmstadt, Germany). The solution was then filtered through a 0.22 μm filter (Millipore, Merck KGaA, Darmstadt, Germany) under sterile conditions and aliquoted for storage at –20°C until use. To prepare the fatty acid/BSA solution (Sigma–Aldrich, Merck KGaA, Darmstadt, Germany), C20:5 (n-3) (cis-5,8,11,14,17-eicosapentaenoic acid (EPA); Cat # E2011, Sigma–Aldrich, Merck KGaA, Darmstadt, Germany) was added to the 24% BSA (Sigma–Aldrich, Merck KGaA, Darmstadt, Germany) solution to a final concentration of 10 mM. This mixture was gently heated and stirred on a hot plate until an emulsion formed. The emulsion was then stored at –20°C until needed.
2.5. Flow Cytometry Analysis
2.5.1. Staining of Cell-Surface Markers
Monocytic cells were seeded in 24-well plates at 0.5 x 10⁶ cells/well. Cells were transformed into macrophages and pretreated as previously described. To detach macrophages, cells were harvested by gentle pipetting in ice-cold phosphate-buffered saline (PBS) 1x PBS (Sigma–Aldrich, Merck KGaA, Darmstadt, Germany) supplemented with 0.5 mM disodium ethylenediaminetetraacetic acid (EDTA; Sigma–Aldrich, Merck KGaA, Darmstadt, Germany). Harvested cells were then resuspended in FACS staining buffer that was prepared in-house using PBS (1x; Gibco, Thermo Fisher Scientific, Waltham, MA, USA) supplemented with 1% BSA (Sigma–Aldrich, Merck KGaA, Darmstadt, Germany), 2 mM disodium EDTA (Sigma–Aldrich, Merck KGaA, Darmstadt, Germany), and 0.05% sodium azide (Sigma–Aldrich, Merck KGaA, Darmstadt, Germany). The solution was filter-sterilized using a 0.22 μm membrane filter (Millipore, Merck KGaA, Darmstadt, Germany) and stored at 4°C until use. Cells were blocked with 20 µg human IgG (Sigma–Aldrich, Merck KGaA, Darmstadt, Germany) for 30 min on ice, followed by three washes and resuspended in 100 µL of FACS buffer and incubated with anti-CD11b PE-Cy7 (Cat # 557743; BD Pharmingen, San Jose, CA, USA) and anti-HLA-DR PerCP-Cy5.5 (Cat # 560652; BD Pharmingen, San Jose, CA, USA) or appropriate isotype control antibodies (Cat # 558055; BD Phosflow, Cat # 559529; BD Phosflow, Cat # 560542; BD Pharmingen, or Cat # 560817; BD Phosflow, San Jose, CA, USA) on ice for 30 min.
Cells were washed three times with FACS buffer to remove nonspecific binding, then resuspended in FACS buffer for analysis on a FACSCanto (BD Biosciences, San Jose, CA, USA) flow cytometer. Data analysis was performed using BD FACSDiva Software 8 (BD Biosciences, San Jose, CA, USA) or FlowJo software (FlowJo, Ashland, OR, USA). Unstained cells were used to define gating, and median fluorescence intensity (MFI) was measured. The gating strategy is summarized in the Supporting Information 1: Figure S1A.
2.5.2. Staining of Intracellular Markers
For intracellular staining, cells were incubated with fixation/permeabilization buffer (Cat # 00-5523-00, eBioscience, Thermo Fisher Scientific, San Diego, CA, USA) for 20 min at 4°C, followed by washing with Perm Wash Buffer (BD Biosciences, San Jose, CA, USA). Cells were then stained with antihuman IRF5 Alexa Fluor 488 (Cat # IC4508G; R&D Systems, Minneapolis, MN, USA) and anti-NF-κB p65 (pS529)-PE (Cat # 558423; BD Biosciences, San Jose, CA, USA) or mouse anti-human HIF1α Alexa Fluor 647 (Cat # 565924; BD Biosciences, San Jose, CA, USA) at the recommended concentrations according to the manufacturer’s instructions.
Samples were acquired on a BD FACSCanto (BD Biosciences, San Jose, CA, USA) flow cytometer, and data analysis was performed using BD FACSDiva Software 8 (BD Biosciences, San Jose, CA, USA) or FlowJo software (FlowJo, Ashland, OR, USA). Unstained cells were used to define gating, and MFI was measured. The gating strategy is summarized in Supporting Information 1: Figure S1B.
2.5.3. Analysis of Intracellular Reactive Oxygen Species by Flow Cytometry
To assess intracellular ROS levels, we used the cell-permeable fluorogenic probe 2′, 7′-dichlorodihydrofluorescein diacetate (DCFH-DA/KP06003; Bioquochem, Asturias, Spain). This probe enters cells, and it is converted by intracellular not specific esterases into highly fluorescent 2′, 7′-dichlorofluorescein (DCF) upon reaction with ROS, serving as an indicator of intracellular oxidative stress. The assay was performed following the manufacturer’s instructions. Briefly, THP-1 transformed macrophages were preincubated with 10 µM DCFH-DA (Bioquochem, Asturias, Spain) at 37°C for 30 min. Cultures were then pretreated with 200 µM C20:5 (n-3) (cis-5,8,11,14,17-eicosapentaenoic acid (EPA); Cat # E2011, Sigma–Aldrich, Merck KGaA, Darmstadt, Germany) and/or 10 μM GW9662 (PPARα antagonist, Bio-Techne, Tocris Bioscience, Bristol, UK) or 50 μM tert-butyl hydroperoxide (TBHP; Sigma–Aldrich, Merck KGaA, Darmstadt, Germany) solution serving as a positive control, followed by 10 ng/mL LPS from E. coli O111:B4 (LPS; Cat # L4391, Sigma–Aldrich, Merck KGaA, Darmstadt, Germany) stimulation. After 4 h of incubation, cells were harvested, rinsed three times with PBS 1x PBS (Gibco, Thermo Fisher Scientific, Waltham, MA, USA). DCF fluorescence was measured by flow cytometry using excitation/emission wavelengths of 488 nm/525 nm, respectively. For each sample, 10,000 events were recorded using the BD FACSCanto (BD Biosciences, San Jose, CA, USA). Data analysis was conducted to quantify ROS levels as a measure of oxidative stress in different treatment groups.
See Supporting Information 2: Figure S2 for comparative analysis of vehicle controls
2.5.4. Measurement of Mitochondrial Membrane Potential With JC-1
Changes in mitochondrial membrane potential were assessed using 5,5′, 6,6′-tetrachloro-1,1′, 3,3′-tetraethyl-benzimidazolcarbocyanine iodide (JC-1; Cat # T3168, Thermo Fisher Scientific, Waltham, MA, USA). JC-1 emits either green or red fluorescence depending on the mitochondrial membrane potential: green fluorescence (monomers) indicates depolarized mitochondria (low membrane potential), while red fluorescence (aggregates) reflects polarized mitochondria (high membrane potential) [14]. In this context, the term “polarized” refers to the maintenance of a high electrochemical gradient across the inner mitochondrial membrane, where the matrix side remains negatively charged relative to the intermembrane space, a condition essential for ATP production. This gradient typically ranges between −150 and −180 mV. In contrast, “depolarized” mitochondria exhibit a loss or reduction of this membrane potential, reflecting impaired mitochondrial function. This terminology is well established and widely accepted in mitochondrial biology and is commonly used in JC-1-based assays to distinguish between healthy and dysfunctional mitochondria.THP-1 transformed macrophages were pretreated with 200 µM C20:5 (n-3) (cis-5,8,11,14,17-eicosapentaenoic acid (EPA); Cat # E2011, Sigma–Aldrich, Merck KGaA, Darmstadt, Germany) and/or 10 μM GW9662 (PPARα antagonist, Bio-Techne, Tocris Bioscience, Bristol, UK) followed by stimulation with 10 ng/mL LPS from E. coli O111:B4 (LPS; Cat # L4391, Sigma–Aldrich, Merck KGaA, Darmstadt, Germany) as per experimental design. After 24 h of incubation, cells were harvested by ice cold 1x PBS (Gibco, Thermo Fisher Scientific, Waltham, MA, USA) supplemented with 0.5 mM EDTA (Sigma–Aldrich, Merck KGaA, Darmstadt, Germany). Cells were centrifugated at 300x g for 5 min and washed twice with prewarmed 1x PBS (Gibco, Thermo Fisher Scientific, Waltham, MA, USA). Cells were then resuspended in 2 µM JC-1 (Thermo Fisher Scientific, Waltham, MA, USA) and incubated at 37°C for 20 min in the dark. Following incubation, cells were washed twice with 1x PBS (Gibco, Thermo Fisher Scientific, Waltham, MA, USA) to remove excess dye and resuspended in 500 mL 1x PBS (Gibco, Thermo Fisher Scientific, Waltham, MA, USA) for analysis. JC-1 fluorescence was measured using a FACSCanto II flow cytometer (BD Biosciences, San Jose, CA, USA) with laser excitation at 488 nm. Emissions were detected at two wavelengths: green fluorescence at 530/30 nm for JC-1 monomers (depolarized mitochondria) and red fluorescence at 585/42 nm for JC-1 aggregates (polarized mitochondria). For each sample, at least 10,000 events were recorded. Data were analyzed using FlowJo software (FlowJo, Ashland, OR, USA). The mitochondrial membrane potential was expressed as the ratio of red (aggregates) to green (monomers) fluorescence intensity, where a higher ratio reflects preserved mitochondrial membrane potential, and a lower ratio indicates mitochondrial depolarization.
See Supporting Information 2: Figure S2 for comparative analysis of vehicle controls.
2.6. Quantitative Real-Time Polymerase Chain Reaction
Total RNA was isolated using the RNeasy Mini Kit (Qiagen, Valencia, CA, USA) following the manufacturer’s protocol. The quality and quantity of the isolated RNA were assessed using a NanoDrop spectrophotometer (Applied Biosystems, Thermo Fisher Scientific, Waltham, MA, USA) by measuring the absorbance ratios at 260/280 and 260/230 nm. A 260/280 ratio of ~ 2.0 was considered indicative of high RNA purity, and a 260/230 ratio above 1.8 reflected low levels of contaminants such as phenol or guanidine. Only samples meeting these quality criteria were used for downstream applications. Complementary DNA (cDNA) was synthesized from 1 μg of RNA using the High-Capacity cDNA Reverse Transcription Kit Applied Biosystems, Thermo Fisher Scientific, Waltham, MA, USA). Quantitative real-time polymerase chain reaction (qRT-PCR) was carried out on the 7500 Fast Real-Time PCR System Applied Biosystems, Thermo Fisher Scientific, Waltham, MA, USA) using the TaqMan Gene Expression Master Mix Applied Biosystems, Thermo Fisher Scientific, Waltham, MA, USA). Each reaction utilized 1000 ng of cDNA and TaqMan Gene Expression Assay reagents (Applied Biosystems, Thermo Fisher Scientific, Waltham, MA, USA), as detailed in Table 1. Threshold cycle (Ct) values were normalized to GAPDH, and the ∆∆Ct method was employed to calculate relative mRNA levels compared to the control. Relative gene expression was presented as fold change, with the control set to 1. Data are shown as mean ± SEM, and statistical analysis was conducted with significance determined at p < 0.05.
| Reagent or resources | Source | Identifier |
|---|---|---|
| IL-1 b (human) | ThermoFisher | Hs01555410_m1 |
| IL-6 (human) | ThermoFisher | Hs00174131_m1 |
| TNF (human) | ThermoFisher | Hs01113624_g1 |
| ATF4 (human) | ThermoFisher | Hs00909569_g1 |
| DDIT3 (human) | ThermoFisher | Hs00358796_g1 |
| HSPA5 (human) | ThermoFisher | Hs00607129_gH |
| PPARa (human) | ThermoFisher | Hs00947536_m1 |
| PPARd (human) | ThermoFisher | Hs04187066_g1 |
| PPARg (human) | ThermoFisher | Hs01115513_m1 |
| HIF1a (human) | ThermoFisher | Hs00153153_m1 |
| FABP4 (human) | ThermoFisher | Hs01086177_m1 |
| FABP5 (human) | ThermoFisher | Hs02339439_g1 |
| IRF4 (human) | ThermoFisher | Hs00180031_m1 |
| IRF5 (human) | ThermoFisher | Hs00158114_m1 |
| GAPDH (human) (VIC-Tamara) | Applied biosystems ThermoFisher | 4310884E |
2.7. Western Blot Analysis of Protein Expression
Treated cell cultures were lysed using RIPA buffer (Thermo Fisher Scientific, Waltham, MA, USA)) supplemented with a protease and phosphatase inhibitor cocktail (Thermo Fisher Scientific, Waltham, MA, USA) to safeguard against protein degradation. The lysates were centrifuged at 14,000 x g for 15 min at 4°C to eliminate debris. Protein concentration was determined using the Bradford assay (Bio-Rad Laboratories, Hercules, CA, USA), and equal amounts of protein (12.5 µg per sample) were resolved on a 10% SDS-PAGE gel. Gels were run using pre-made 10 × running buffer (Bio-Rad Laboratories, Hercules, CA, USA), diluted to 1 × in double-distilled water (ddH2O).
Proteins were transferred onto PVDF membranes (MilliporeSigma, Burlington, MA, USA) using a wet transfer system with 10× Tris-Glycine transfer buffer (Bio-Rad Laboratories, Hercules, CA, USA), also diluted to 1× in ddH2O, using the Mini Trans-Blot Cell (Bio-Rad). Membranes were blocked for 1 h at room temperature using either Blotto A or Blotto B (ChemCruz, Santa Cruz Biotechnology, Dallas, TX, USA), depending on the target Blotto A was used for total protein detection, while Blotto B was used for phosphoprotein targets.
After blocking, membranes were incubated overnight at 4°C with primary antibodies specific to the proteins of interest (Table 2). β-Actin was used as a loading control. The following day, membranes were washed with Tris-buffered saline (TBST) (with 0.1% Tween-20; Sigma–Aldrich, Merck KGaA, Darmstadt, Germany) and incubated with HRP-conjugated secondary antibodies (Cell Signaling Technology, Danvers, MA, USA) for 1 h at room temperature. Protein bands were visualized using an ECL detection reagent (Thermo Fisher Scientific, Waltham, MA, USA) and imaged using a ChemiDoc Imaging System (Bio-Rad Laboratories, Hercules, CA, USA). Densitometric analysis was performed using ImageJ software (National Institutes of Health, Bethesda, MD, USA), and protein expression levels were normalized to β-Actin. Full immunoblot images are provided in the supporting PowerPoint file (Supporting Information 1: WB Immunoblots).
| Name (western blot) | Species | Company | Refrence/Catalog number |
|---|---|---|---|
| BiP (C50B12) | Rabbit mAb | Cell signaling technology | 3177 |
| CHOP (L63F7) | Mouse mAb | Cell signaling technology | 2,895S |
| β-Actin (8H10D10) | Mouse mAb | Cell signaling technology | 3,700S |
| PPARα (phospho s12) | Rabbit pAb | abcam | ab3484 |
| FABP4 (D25B3) (XP) | Rabbit mAb | Cell signaling technology | 3,544S |
| FABP5 (D1A7T) | Rabbit mAb | Cell signaling technology | 39,926S |
2.8. Measurement of AP-1/NF-κB Activity
THP-1 XBlue monocytes (InvivoGen, San Diego, CA, USA) were used in this study. These cells are stably transfected with a reporter construct encoding secreted embryonic alkaline phosphatase (SEAP) under the control of a promoter responsive to AP-1 and NF-κB transcription factors. Upon NF-κB activation, SEAP is secreted into the culture supernatant, allowing quantitative assessment of pathway activation. Cells were pretreated following the protocol described by Haider et al. [15]. Following stimulation, SEAP levels were measured in the supernatants after 3 4 h of incubation with Quanti-Blue solution (InvivoGen, San Diego, CA, USA) at room temperature. Absorbance was read at 650 nm using a microplate reader (BioTek Instruments, Winooski, VT, USA).
2.9. Sandwich Enzyme-Linked Immunosorbent Assay
Secreted IL-1β protein concentrations were quantified in the media of THP-1-treated cell cultures using sandwich enzyme-linked immunosorbent assay (ELISA) in accordance with the manufacturer’s instructions (R&D systems, Minneapolis, MN, USA, Cat # DY279) and as previously published Al-Rashed et al. [16].
2.10. Statistical Analysis
Statistical analysis was performed using GraphPad Prism software (La Jolla, CA, USA). Data are shown as the mean ± (SEM), unless otherwise indicated. Parametric data were analyzed by one-way ANOVA followed by Tukey’s post hoc multiple comparisons test. For all analyses, data from a minimum of three replicates were used for statistical calculation. A p value of 0.05 was considered statistically significant. ns = nonsignificant, ∗p < 0.05, ∗∗p < 0.01, ∗∗∗p < 0.001, and ∗∗∗∗p < 0.0001.
3. Results
3.1. C20: 5 (n-3) Downregulates LPS-Induced Inflammatory Response and ER Stress
The anti-inflammatory properties of omega-3 fatty acids have been well documented in numerous studies. However, despite the variety of omega-3 family members, their specific effects on inflammatory outcomes remain partially unclear, with some demonstrating more potent effects in mitigating inflammation than others. One proposed mechanism is that these fatty acids alleviate ER stress, thereby reducing the inflammatory response.
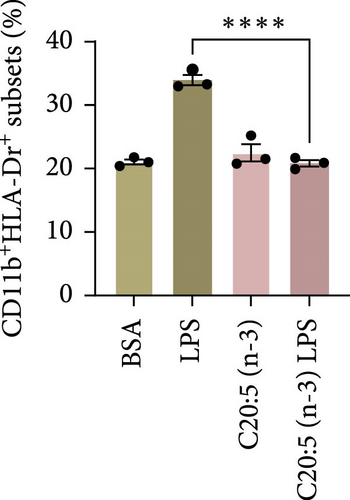
To test this hypothesis and further understand the underlying mechanisms, we utilized a THP-1-derived macrophage model. The cells were pre-incubated with 200 µM of C20:5 (n-3) and subsequently stimulated with 10 ng/mL of LPS. As expected, pretreatment with EPA significantly reduced the percentage of HLA-DR+ macrophage subsets compared to cells exposed only to LPS (Figure 1A,B) verifying this anti-inflammatory property.

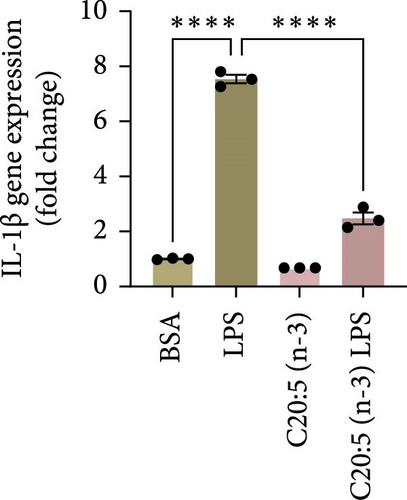
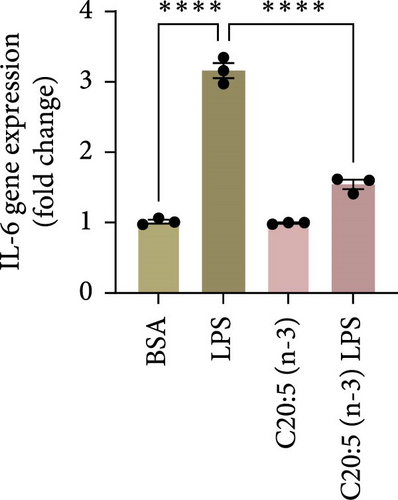
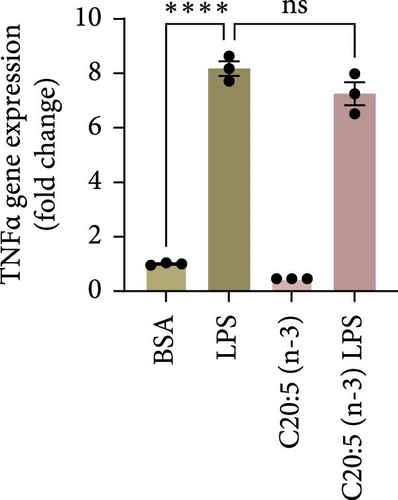
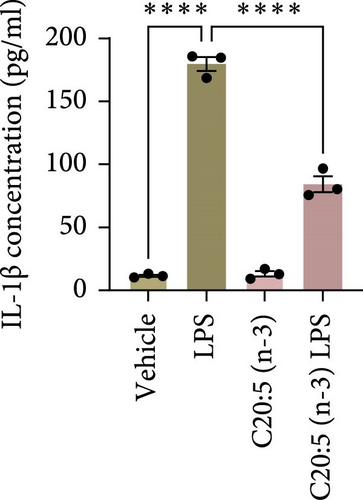
This effect was also observed at the gene level, where C20:5 (n-3) pretreatment significantly downregulated the gene expression of proinflammatory cytokines IL-1β and IL-6 (Figure 1C,D). Although a reduction in TNF-α gene expression was observed, it did not reach statistical significance (Figure 1E). Furthermore, we tested the secretion profile of these proinflammatory cytokines in the media. As expected, a significant reduction was seen in IL-1β in cells that were pretreated with C20:5 (n-3) (Figure 1F). These results indicate that C20:5 (n-3) effectively mitigates LPS-induced inflammatory responses.
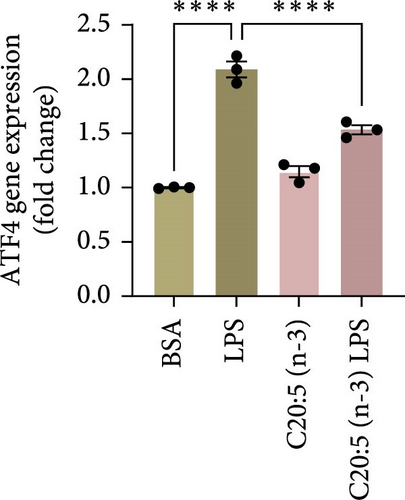
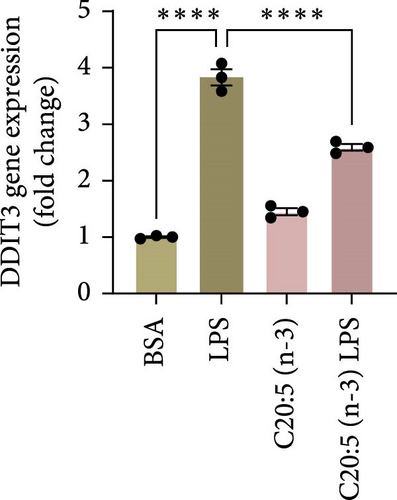
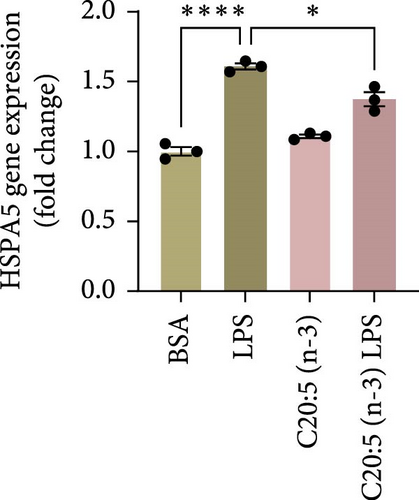
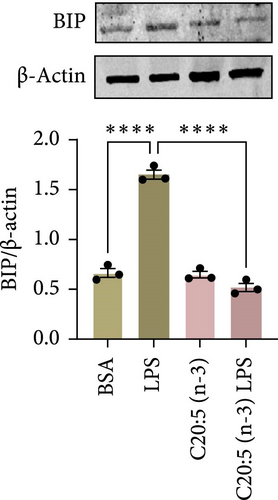
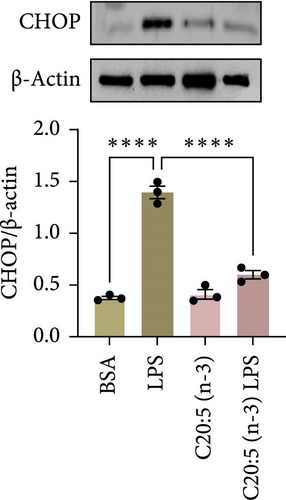
Previous studies have demonstrated that LPS induces ER stress [17]. In our model, C20:5 (n-3) pretreatment significantly reduced the expression of key ER stress markers, including ATF4, DDIT3, and HPAS5/GRP78 at the gene level (Figure 1G–I). This reduction in ER stress was further confirmed at the protein level, as evidenced by decreased expression of BIP, a chaperone associated with HPAS5, and CHOP, a protein marker for DDIT3 (Figure 1J,K). Altogether, these findings suggest that C20:5 (n-3) attenuates both the inflammatory response and ER stress induced by LPS.
3.2. C20:5 (n-3) Downregulates LPS-Induced Oxidative Stress
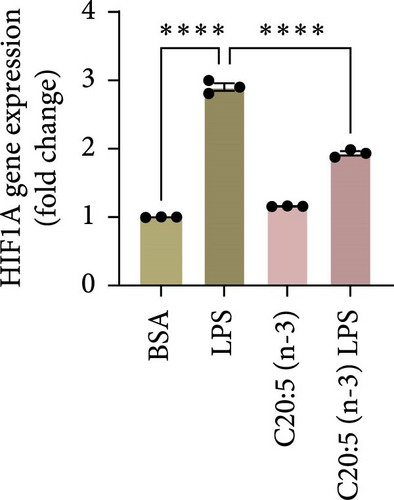
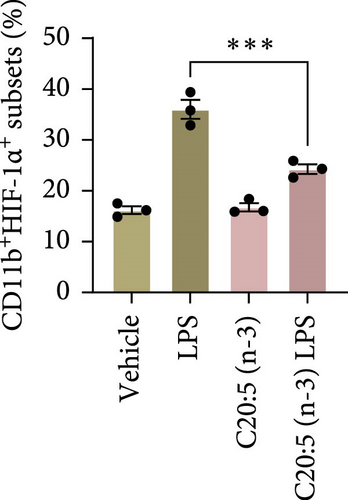
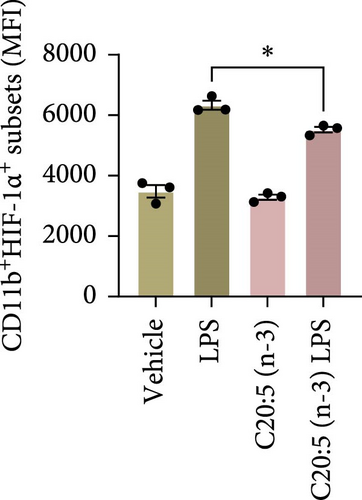
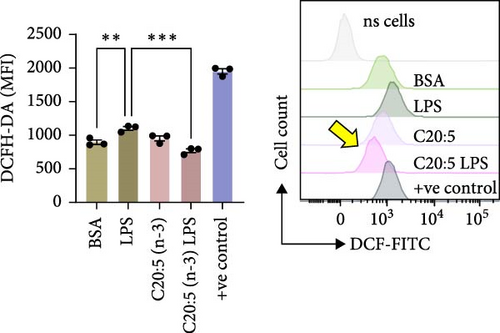
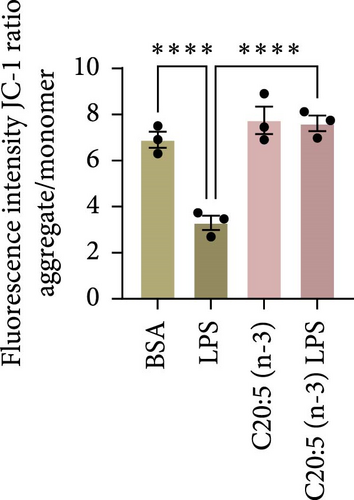
To further explore the mechanisms by which C20:5 (n-3) mitigates cellular stress, we examined its impact on oxidative stress, a well-known contributor to ER stress and inflammation. Given the role of HIF1α in promoting oxidative stress during inflammatory conditions, we first assessed its gene expression, suggesting that C20:5 (n-3) might mitigate oxidative stress through modulation of this pathway. As expected, LPS stimulation showed significant upregulation in HIF1A gene expression, indicating an induction of oxidative stress similar to our previous observations where pretreatment with C20:5 (n-3) prior to LPS stimulation significantly reduced this upregulation (Figure 2A). To complement the gene expression findings, we additionally evaluated HIF1α protein levels by flow cytometry. Macrophages were gated on CD11b+ subsets, and intracellular HIF1α expression was measured. The dot plot (Figure 2B) and bar graph (Figure 2C) show a notable increase in the percentage of CD11b+HIF1α+ cells upon LPS treatment, which was markedly reduced by C20:5 (n-3) pretreatment. Furthermore, quantification of HIF1α MFI within CD11b+HIF1α+ cells (Figure 2D) revealed a significant reduction in HIF1α protein expression following C20:5 (n-3) exposure, corroborating our transcript-level findings. To further verify this observation, we conducted a functional analysis for ROS production using a flow cytometric analysis of DCFH-DA. Consistent with a reduction in HIF1α expression, ROS levels were markedly reduced following C20:5 (n-3) treatment (Figure 2E). This indicates that C20:5 (n-3) effectively alleviates oxidative stress, potentially through HIF1α downregulation and related pathways. Furthermore, since mitochondrial dysfunction is a major source of ROS production, we further examined the effect of C20:5 (n-3) on mitochondrial membrane potential using a JC-1 assay. Compared with the LPS-treated group, pretreatment with C20 : 5 (n-3) preserved mitochondrial membrane potential as indicated by a stable aggregate to monomers ratio (Figure 2F,G), suggesting that C20:5 (n-3) prevents mitochondrial depolarization under LPS-induced stress conditions. Collectively, the observed data underscore the multifaceted protective role of C20:5 (n-3) in cellular stress responses, likely mediated through its impact on mitochondrial integrity and oxidative stress regulation.


3.3. C20:5 (n-3) Modulates FABP5/PPARα/NF-κβ Signaling Independently of the TLR4-IRF5 Pathway
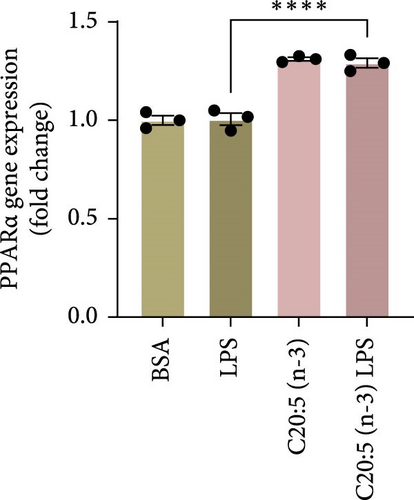
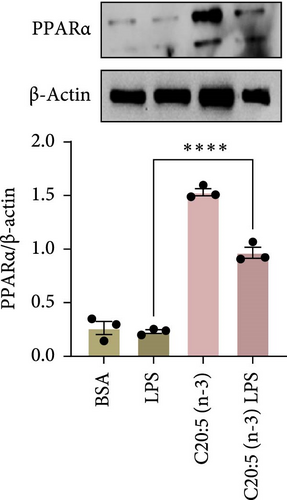
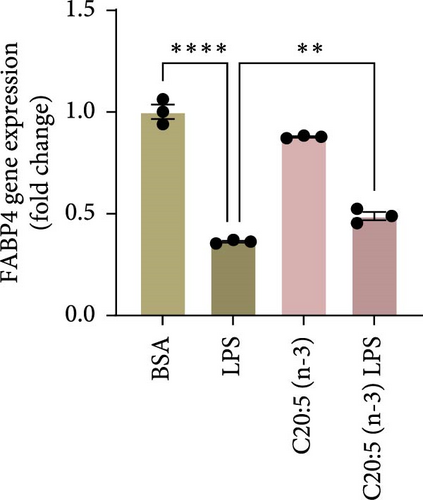
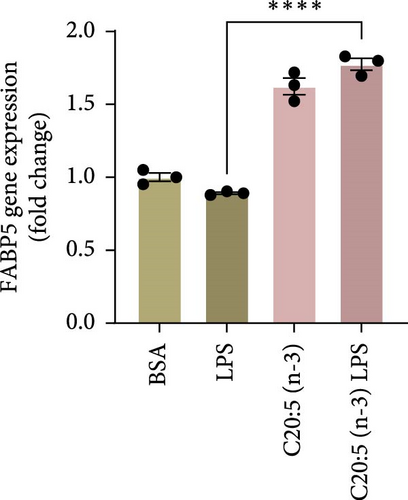
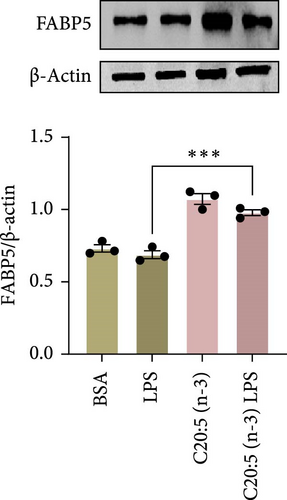
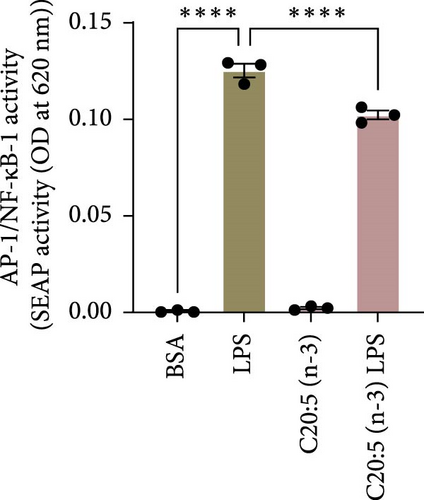
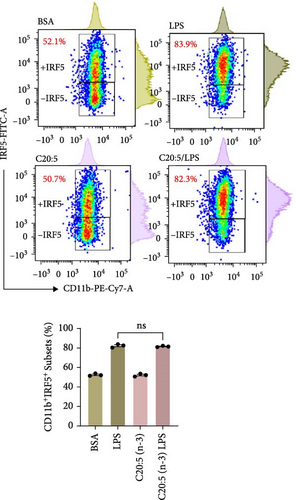
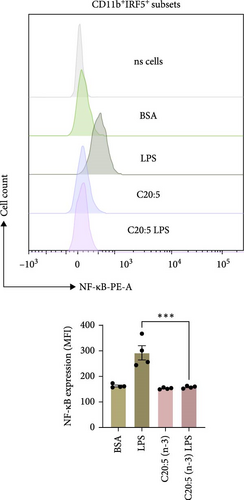
To further elucidate the molecular mechanisms underlying the protective effects of C20:5 (n-3), we focused on key modulators involved in lipid metabolism and inflammation. Specifically, we investigated the expression of PPARα, IRF5, and FABP4/5 given their role in mitochondrial function, oxidative stress, and inflammation. PPARα, a nuclear receptor that regulates mitochondrial fatty acid oxidation and energy homeostasis, was significantly reduced by LPS treatment. Interestingly, C20:5 (n-3) elevated PPARα expression at both gene and protein levels (Figure 3A,B, respectively). This observation suggests a key role in re-establishing mitochondrial function and metabolic homeostasis in the presence of inflammatory stimuli such as LPS. Fatty acids (FA), including C20:5 (n-3), are known ligands for PPARs. Their subsequent binding can impact their activity. During this process, FA requires the initial interaction with fatty acid-binding proteins (FABP), which act as chaperones to transport ligands to PPARs. While no significant effect was observed on FABP4 expression when compared to LPS-treated cells, C20:5 (n-3) induced a marked increase in FABP5 at both gene and protein levels (Figure 3C–E). This observation indicates that C20:5 (n-3) might exert its protective effects through this specific pathway, facilitating its interaction with PPARα to promote fatty acid oxidation and anti-inflammatory responses. Given that IRF5 is a key transcription factor activated downstream of Toll-like receptor 4 (TLR4) signaling, we explored its role in modulating the inflammatory response through the activation of the NF-κβ pathway. At the gene level, the expression of IRF5 was abolished under C20:5 (n-3) pretreatment (Figure 3F). Subsequently, C20:5 (n-3) pretreatment significantly reduced NF-κβ activation as demonstrated in THP-1 -NF-κβ reporter cells, where we observed a notable reduction in NF-κβ expression (Figure 3G). To further understand this dynamic and to validate the inhibitory effect of C20:5 (n-3) on the IRF5/NF-κβ pathway, we conducted flow cytometric analysis. Interestingly, while there was no significant change in the percentage of IRF5+ subsets, we observed a significant reduction in NF-κβ MFI within these cells, indicating that C20:5 (n-3)’s primary mode of action may not directly inhibit IRF5 expression but instead suppress NF-κβ activation downstream of the TLR4-IRF5 axis (Figure 3H). Together, these results highlight the capacity of C20:5 (n-3) to modulate NFκβ through the FABP5/PPARα/NF-κβ axis independently of TLR4/IRF5.
3.4. PPARα Inhibition Abrogates C20:5 (n-3)’s Effect on LPS Stress and Inflammation
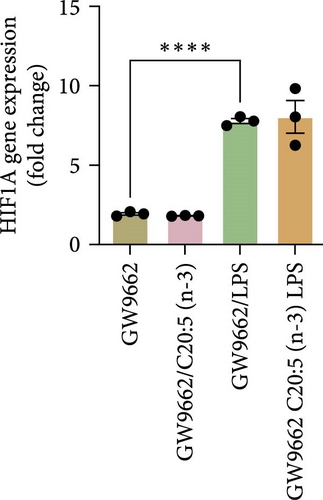
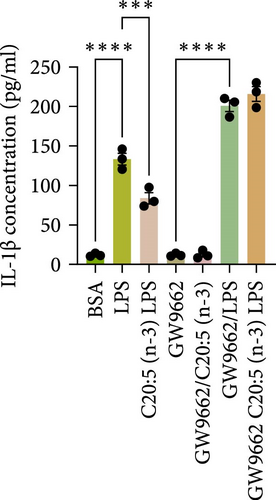
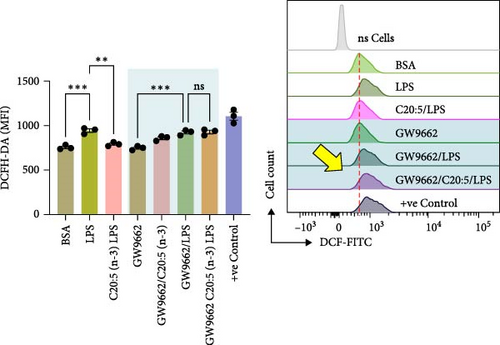
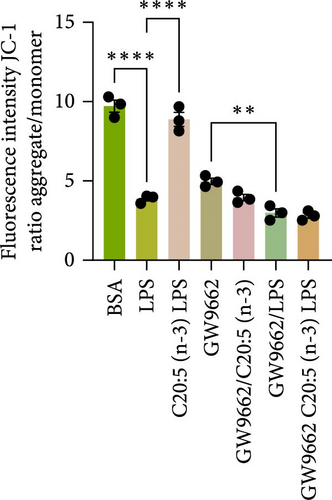
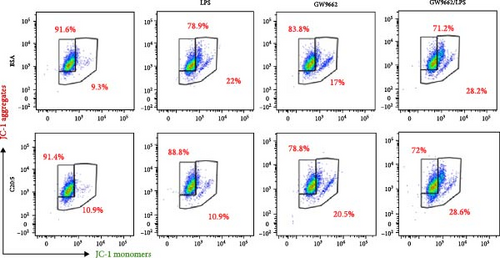
To interrogate the mechanistic role of PPARα in mediating the protective effects of the omega-3 fatty acid C20:5 (n-3), we pretreated macrophages with GW9662, a pharmacological PPARα antagonist, prior to C20:5 (n-3) exposure and subsequent LPS stimulation. Under PPARα inhibition, it became evident that C20:5 (n-3)’s ability to mitigate oxidative stress and subsequent ER stress was significantly diminished, as observed in the expression of HIF1A (Figure 4A). This loss of function was also noted in ER stress genes, including DDIT3, ATF4, and HSPA5, which were elevated to levels comparable to those seen with LPS stimulation alone (Figures 4B–D). This outcome was further substantiated by the expression of BIP protein, a critical marker of ER stress (Figure 4E), and an elevation of the proinflammatory marker IL-1β in the media, with no significant impact observed in C20:5 (n-3)-treated cells under PPARα inhibition (Figure 4F). Additionally, both functional assays for ROS production (Figure 4G) and mitochondrial depolarization (Figures 4H and I) showed no significant protection in C20:5 (n-3)-treated cells under PPARα inhibition, as the differences between C20:5 (n-3)-treated and untreated groups were not statistically significant. These observations indicate that the protective effects of C20:5 (n-3) were nullified by PPARα inhibition.
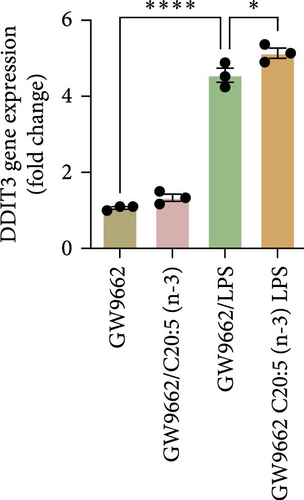
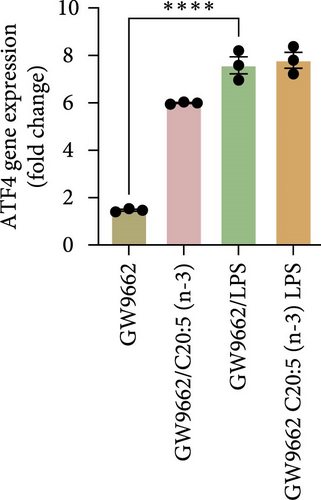
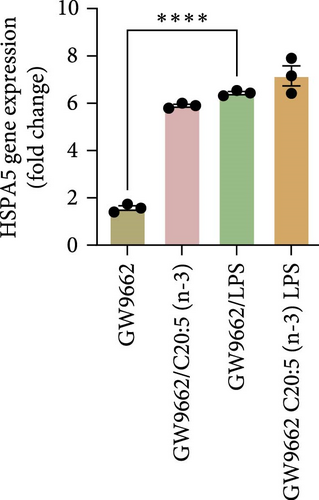
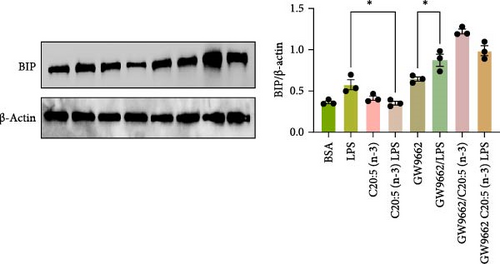
Collectively, these findings demonstrate that PPARα activation is essential for C20:5 (n-3) to exert its protective effects against LPS-induced oxidative and ER stress. The loss of C20:5 (n-3)’s beneficial effects in the presence of PPARα inhibition highlights the critical role of PPARα in modulating cellular responses to inflammatory and stress stimuli.
4. Discussion
Our study demonstrates that C20:5 (n-3) alleviates LPS-induced oxidative stress and inflammation through a mechanism involving the PPARα–NF-κB axis, with a pivotal role for FABP5 as a chaperone in facilitating C20:5 (n-3)’s binding to PPARα. These findings contribute to a growing body of research on the anti-inflammatory and cytoprotective effects of PUFAs in inflammatory and metabolic disorders, offering new insights into the precise molecular pathways involved.
The association between high-fat diets, increased circulating LPS levels, and chronic low-grade inflammation is well-established, with elevated LPS levels contributing to the development of obesity and insulin resistance through TLR4-mediated signaling pathways [8, 18]. LPS-induced inflammation not only promotes insulin resistance but also induces ER stress and oxidative stress, both of which play critical roles in the pathogenesis of metabolic diseases [19, 20]. ER stress arises from the accumulation of misfolded proteins, activating the UPR, which, when unresolved, can lead to apoptosis [21]. In our model, C20:5 (n-3) pretreatment significantly reduced the expression of ER stress markers, such as ATF4, DDIT3, and HSPA5, suggesting that C20:5 (n-3) can attenuate LPS-induced ER stress and restore cellular homeostasis. These findings align with previous studies highlighting omega-3 PUFAs’ ability to reduce ER stress, which is known to contribute to the progression of obesity-related metabolic inflammation [22, 23].
Oxidative stress is another key factor exacerbating inflammation in metabolic disorders, as excessive ROS production can damage cellular components and activate inflammatory signaling pathways, including NF-κB [24]. In this study, C20:5 (n-3) significantly reduced ROS levels and preserved mitochondrial membrane potential, as shown by a stable aggregates-to-monomers ratio in the JC-1 assay, indicating that C20:5 (n-3) prevents mitochondrial dysfunction (Supporting Information 3: Figure S3), a major source of ROS production during inflammatory conditions [25]. Our findings align with the work of An et al. [26], who demonstrated that long-term omega-3 fatty acids supplementation mitigated tubulointerstitial injury in animals with chronic renal disease by reducing oxidative stress, inflammation, and fibrosis. Furthermore, we observed a reduction in HIF1α expression following C20:5 (n-3) treatment, which likely contributes to the decrease in ROS production. HIF1α is known to be upregulated during hypoxic and inflammatory conditions, promoting oxidative stress [27]. C20:5 (n-3)’s downregulation of HIF1α suggests a potential pathway by which it mitigates oxidative stress and maintains cellular integrity under inflammatory stress.
One interesting observation in our study is the essential role of PPARα and FABP5 in mediating C20:5 (n-3)’s protective effects. PPARα, a nuclear receptor involved in lipid metabolism and anti-inflammatory responses, has been previously associated with the beneficial effects of omega-3 fatty acids in metabolic health [28]. However, our study highlights a specific role for PPARα in modulating the inflammatory response to LPS, which has not been widely explored. We demonstrated that C20:5 (n-3) increases PPARα expression and requires its activation to exert anti-inflammatory and cytoprotective effects. This finding is supported by studies showing that PPARα activation is crucial in reducing ER stress and inflammation in obesity models [29]. The addition of FABP5 as a key mediator in this pathway provides further insight, in that FABP5 serves as a chaperone for long-chain fatty acids, facilitating their transport to PPARs [30]. The observed increase in FABP5 expression following C20:5 (n-3) treatment suggests that C20:5 (n-3) relies on this chaperone’s function to effectively activate PPARα, thereby enhancing its anti-inflammatory properties.
Interestingly, our data show that C20:5 (n-3)’s effects on NF-κB are independent of the TLR4-IRF5 pathway. Although IRF5 is an essential downstream component of TLR4 signaling in the activation of NF-κB [31], C20:5 (n-3)’s reduction of NF-κB activation occurred without significant alteration in IRF5+ subsets. This suggests that C20:5 (n-3) might inhibit NF-κB activation through a pathway distinct from canonical TLR4-IRF5 signaling. Recent studies have indicated that PPARα can directly interfere with NF-κB activity, offering an alternative route for C20:5 (n-3)’s anti-inflammatory effects [32]. Our findings contribute to this understanding by demonstrating that C20:5 (n-3)’s anti-inflammatory action can bypass TLR4 signaling, instead relying on FABP5/PPARα to inhibit NF-κB. Previous reports have shown that C20:5 (n-3) activates GPR120/FFAR4 and PPARγ, resulting in anti-inflammatory responses in adipocytes and macrophages [33, 34]. However, our data suggest that in the context of acute LPS stimulation, C20:5 (n-3) exerts its protective effects through upregulation of PPARα and FABP5 rather than through these canonical pathways. Notably, C20:5 (n-3) did not induce FABP4 expression, which is typically regulated by PPARγ, and its effect on inflammation was preserved independently of TLR4–IRF5 signaling. These results highlight a novel and potentially stimulus-specific pathway, wherein C20:5 (n-3) targets mitochondrial function and oxidative stress through the FABP5–PPARα–NF-κB axis. We propose that future studies directly comparing the contribution of PPARγ, PPARα, and GPR120 under identical inflammatory stimuli would provide further mechanistic clarity and potentially enable targeted therapeutic modulation of these pathways.
While our findings demonstrate a clear reduction in inflammatory responses following C20:5 (n-3) treatment, we acknowledge the relevance of assessing macrophage polarization status. Although C20:5 (n-3) has been implicated in promoting M2-like phenotypes in primary macrophages, our use of PMA-differentiated THP-1 macrophages presents a known limitation in this context. These cells, despite undergoing a 3-day resting period post-differentiation, exhibit a baseline M1-like transcriptional profile and respond poorly to M2-polarizing stimuli such as IL-4 consistent with previous reports [35, 36]. As such, we did not include M2 marker analysis to avoid drawing misleading conclusions from a system that does not accurately Model M2 transition. Future studies employing primary human macrophages or monocyte-derived macrophages (MDMs) will be critical to validate whether C20:5 (n-3)’s anti-inflammatory effects extend to functional M1-to-M2 switching under more physiologically relevant conditions.
To further confirm the role of PPARα in C20:5 (n-3)’s protective effects, we employed GW9662, a selective PPARα antagonist, to inhibit PPARα activity. Under PPARα inhibition, C20:5 (n-3)’s effects on ER stress, oxidative stress, and cytokine production were significantly reduced, indicating that PPARα activation is indeed necessary for C20:5 (n-3)’s anti-inflammatory and cytoprotective actions. Additionally, the functional assays revealed that C20:5 (n-3)’s ability to reduce ROS production and maintain mitochondrial membrane potential was abolished with PPARα inhibition, further confirming the receptor’s role in regulating mitochondrial and oxidative stress responses.
Overall, our study provides a mechanistic framework for C20:5 (n-3)’s protective effects in LPS-induced cellular stress, emphasizing the roles of PPARα and FABP5 in modulating the NF-κB pathway independently of TLR4-IRF5 signaling (Figure 5).
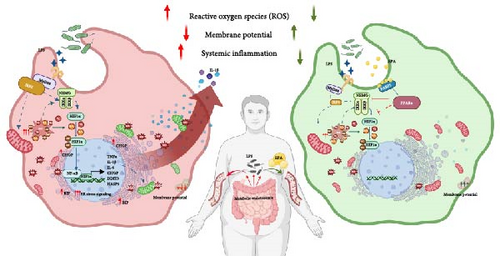
These findings suggest that targeting the FABP5/PPARα axis may offer a therapeutic strategy for mitigating inflammation and cellular stress linked to obesity and metabolic disorders. Given the demonstrated benefits of dietary EPA intake in reducing cardiovascular and metabolic risks, future studies should further investigate its therapeutic potential, alongside other PPARα agonists, in clinical models of metabolic endotoxemia. Exploring interactions between EPA and cellular stress pathways may also reveal novel approaches for managing chronic inflammation and oxidative stress in metabolic diseases.
Disclosure
The funders had no role in study design; data collection, analysis, or interpretation; manuscript writing; or the decision to submit the paper for publication.
Conflicts of Interest
The authors declare no conflicts of interest.
Author Contributions
Haya AlAbduljader conducted experiments, data curation, analyzed data, interpreted the results, and participated in writing the original draft of the manuscript. Halemah AlSaeed and Ameenah Sulaiman participated in conducting experiments, data collection, data analysis, data interpretation and wrote original draft of the manuscript. Amenah Alrabeea and Mohammed J. A. Haider participated in study designing, data interpretation, wrote original draft of the manuscript, review & editing manuscript. Fahd Al-Mulla participated in the study designing, data interpretation, review & editing manuscript. Rasheed Ahmad conceived the idea, participated in study designing, interpreted the results, acquired funds, reviewed & edited manuscript. Fatema Al-Rashed conceived the idea, acquired funds, designed study, interpreted the results, verified data, wrote the manuscript. All authors contributed to reviewing the paper and all authors have read and approved the final version for submission.
Funding
This work was supported by the Kuwait Foundation for the Advancement of Sciences (KFAS), Grant No. RA CB-2019-002 (F.A.R.).
Acknowledgments
An earlier version of this manuscript was made publicly available as a preprint on bioRxiv [37]. The authors acknowledge the availability of this preliminary version under the DOI: 10.1101/2025.03.17.643636v1.
Supporting Information
Additional supporting information can be found online in the Supporting Information section.
Open Research
Data Availability Statement
The data supporting the findings of this study are available from the corresponding author upon reasonable request.


