Optimization of K-Shaped Metal Sealing Ring for Subsea Tubing Hanger Based on Response Surface Method
Abstract
The K-shaped metal sealing ring of the subsea tubing hanger is a crucial sealing component ensuring wellhead sealing. Optimizing its structure can enhance the sealing performance of the tubing hanger and improve the reliability of subsea wellhead equipment. Considering the numerous structural parameters of the K-shaped metal sealing ring and the significant differences in their impact on sealing performance, a multifactor analysis method was applied to conduct a sensitivity analysis of the sealing performance. The results indicated that the outer contact width, inner lip width, and inner radius of the groove mouth are the three primary design variables affecting the sealing performance of the K-shaped sealing ring. Taking these three structural parameters as design variables, with the objectives of improving the contact stress and contact width of the seal ring and reducing the equivalent contact stress, a multiobjective optimization model for the K-shaped seal ring was established. To address the issue of low optimization efficiency due to the need for repeated finite element calculations during the optimization process, quadratic response surface models are established for the sealing performance indicators of the K-shaped seal ring, which were then used as the optimization objective functions to enhance the optimization efficiency. Then, the optimized K-shaped seal ring structure was ultimately obtained. A comparison of the sealing performance of the sealing ring before and after optimization revealed that the contact stress of the optimized K-shaped seal ring increased by 6.44%, the effective contact width increased by 7.04%, and the maximum equivalent stress decreased by 14.54%. These results validate the effectiveness of the proposed method.
1. Introduction
Subsea oil and gas extraction is one of the important ways of increasing oil and gas production in China, and it is also an effective way to solve the energy crisis. As a key wellhead equipment in the subsea oil and gas production system, the sealing performance of the tubing hanger affects the production of wells directly [1, 2]. Once a leak occurs, it will lead to an outflow of oil and gas from the pipeline, causing environmental pollution and economic losses. At present, the research on metal sealing rings mainly focuses on analyzing the metal sealing mechanism and performance characteristics and proposing the main factors affecting the sealing performance of metal sealing rings [3]. Zhao et al. [4] analyzed the X-shaped metal sealing ring of the wellhead connector, obtained the variation law of contact stress under actual working conditions, and confirmed that the structural parameters of the metal sealing ring are the main factors affecting its variation law. Considering the effects of crack on the sealing performance of a C-shaped metal ring on a subsea connector, Wang et al. [5] used the finite element (FE) method to study the influence of crack parameters on the sealing performance of the sealing ring, and the maximum allowable crack width is obtained. Zhang [6] used single factor analysis method to study the influence of a U-shaped metal sealing ring on contact stress and equivalent stress under different initial interference, working pressure, and working temperature. Liu [7] used FE method to compare the sealing performance of the O-shaped structure and Y-shaped structure under high-pressure working conditions, studied the sealing characteristics of the Y-shaped sealing ring under environmental pressure changes, and optimized the structure of the Y-shaped sealing ring. Considering the structural axisymmetric characteristics of the C-shaped metal sealing ring applied in subsea tubing hanger, Wang et al. [8] decomposed the sealing ring into the cantilever beam model and the simply supported beam model, then a theoretical model of the contact stress was derived combining with the Hertz contact theory, and the sealing performance is investigated according to key parameters, such as the initial interference and internal oil pressure. To solve the low optimization efficiency problem caused by the contact nonlinearity during sealing performance analysis using the FE method, an appropriate response surface model (RSM) is usually selected to predict the sealing performance index under different design variables [9], such as structure parameters and load conditions, and an appropriate optimization algorithm is used to obtain the optimum design variables [10–12]. Otherwise, some improved optimization algorithms are applied to improve the optimization efficiency, and the relevant research results indicate that this method is also feasible [3, 13].
Due to its excellent sealing performance, K-shaped metal sealing ring is widely used in tubing hanger in recent years as a type of new sealing structure [14]. However, its structure is more complex compared to other traditional metal sealing rings, which means that there are more factors and design variables that need to be considered during the analysis of the sealing performance and the optimization of the sealing structure. To this point, a parametric FE model of a K-shaped metal ring is established in this paper, and a 7-factor 3-level design of the experiment is adapted to obtain the main structure parameters on sealing performance. Then, RSMs are established to reduce the simulation computational cost, and an optimized sealing ring structure is obtained by using a multiobjective optimization method.
2. Sealing Mechanism and FE Model of K-Shaped Sealing Ring for Tubing Hanger
2.1. Sealing Mechanism of K-Shaped Sealing Ring
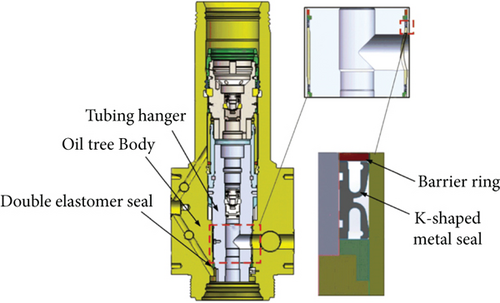
The sealing ring is one of the core structures of the tubing hanger, which usually adopts a dual sealing form of metal sealing and double elastomer sealing. Taking the K-shaped metal sealing ring of the subsea wellhead tubing hanger with a design pressure of 10,000 psi (69 MPa) as an example, the specific structure is shown in Figure 1. The K-shaped metal sealing ring is symmetrically distributed on both sides of the oil outlet of the tubing hanger. Its inner and outer sides form an initial seal with the tubing hanger and the Christmas tree body through an interference fit [15]. During the working condition, when oil and gas enter the completion string and flow through the tubing, the resulting oil and gas pressure acts on the inner side of the K-shaped sealing ring lip, which causes plastic deformation on the contact area, forming a contact zone with sufficient contact width to block the flow of fluid at the bottom of the well [14].
2.2. FEM Model of K-Shaped Sealing Ring
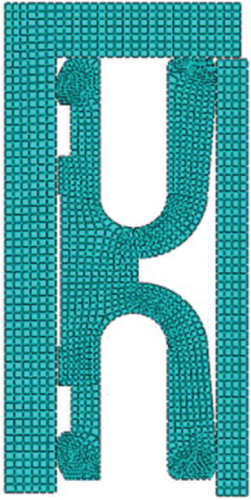
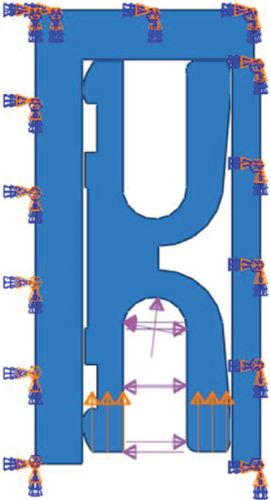
In order to improve the simulation efficiency in the FE method, the sealing component is simplified to a two-dimensional axisymmetric model considering the axial symmetry of the K-shaped sealing ring, and the working load also has obvious axisymmetric characteristics [16]. The K-shaped sealing ring material is selected from the nickel-based high-temperature alloy Inconel718, which has the characteristics of high-temperature resistance, corrosion resistance, and high strength [17]. Its elastic modulus is 203 GPa, Poisson’s ratio is 0.3, density is 8190 kg/m3, yield strength is 1030 MPa, and tensile strength is 1270 MPa [18]. According to the sealing mechanism of the K-shaped sealing ring, three pairs of contact pairs are set up in the model, namely, the contact pair between the inner side of the sealing ring and the outer side of the tubing hanger, the contact pair between the outer side of the sealing ring and the inner side of the Christmas tree, and the contact pair between the upper part of the sealing ring and the upper retaining ring. In order to simulate the sealing effect of oil and gas pressure on the sealing ring under working conditions and consider the influence of the pretightening force on sealing performance during the installation process of the sealing ring, the barrier ring, tubing hanger, and Christmas tree are fixed with an initial interference of 0.3 mm and a lower inner pressure of 69 MPa based on the pre tightening force and the maximum internal pressure during the actual installation process. In order to reduce computational complexity, this paper adopts a two-dimensional plane model instead of the time-consuming three-dimensional model to establish a FE model of the sealing structure, considering the symmetry of the sealing structure and its internal load. The global grid size of the sealing ring is determined to be 0.1 mm, and for the tubing hanger, Christmas tree body, and upper retaining ring, it is determined to be 0.5 mm considering both calculation accuracy and calculation time. Finally, the FE model loading boundary conditions of the K-shaped metal sealing ring are shown in Figure 2.
2.3. Simulation Results of the K-Shaped Sealing Ring
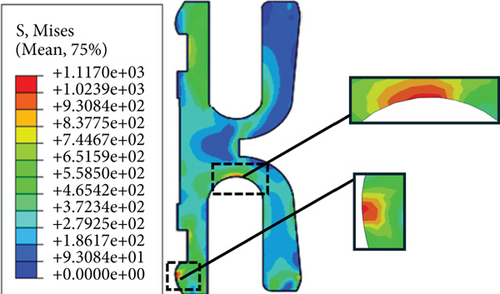
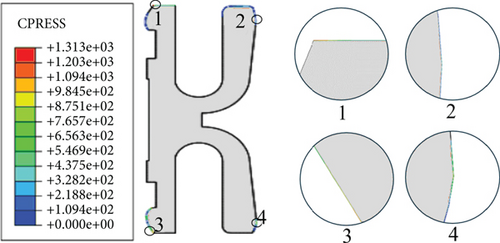
The established FE model of the K-shaped sealing ring is used to obtain the simulation results of its equivalent stress and contact pressure under working conditions for the K-shaped sealing ring, as shown in Figures 3 and 4, respectively. As it should be, the contact width also can be calculated based on the distributions of the contact stress. In Figure 4, the maximum equivalent stress of the sealing ring is 1117 MPa when the medium pressure is 69 MPa and the initial interference is 0.3 mm, which is less than the tensile strength of the material (1270 MPa), so no damage will occur, and the maximum equivalent stress occurs on the inner contact lip surface and the bottom of the U-shaped groove. As can be seen from Figure 4, the maximum contact stress occurs at the top left position (marked No. 1) of the sealing ring. Under the working condition, the maximum contact stress of the sealing ring is 1313 MPa, which is much greater than three times the medium pressure, meeting the airtight sealing requirements of oil and gas pipelines [17].
3. Sensitivity Analysis of Structural Parameters on Sealing Performance for K-Shaped Sealing Ring
3.1. Structural Parameters of K-Shaped Sealing Ring
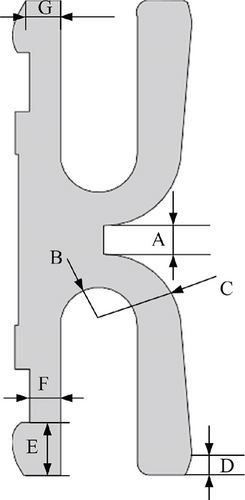
According to the simulation results in Figure 3, the maximum equivalent stress of the sealing ring occurs on the inner contact lip surface and the root of the lower U-shaped groove. Therefore, the upper and lower groove gaps A, the inner radius of the groove mouth B, and the outer arc radius C of the sealing ring are taken as three design variables to guarantee the strength of the sealing ring. From the analysis of the contact stress simulation of the sealing ring in Figure 4, the contact stress on the top and inner sides of the seal ring is relatively large. Combined with the structural characteristics of the K-shaped metal seal ring, the outer contact width D, the inner lip width of the sealing ring E, the root length F, and the left upper contact length G are taken as four design variables to guarantee the sealing performance of the sealing ring. Finally, a parametric model of the K-shaped sealing ring containing seven design variables is established as shown in Figure 5.
3.2. Orthogonal Experimental Design
The parameter value range is determined by setting the initial value of each variable as the center and fluctuating up and down by 50% as the upper and lower limits of the corresponding variable. According to the number of design variables and their value ranges of the K-shaped metal seal ring in Table 1, an orthogonal test table L18 (37) with 7 factors and 3 levels is generated based on the Box–Behnken experimental design method [19], and a total of 18 tests are conducted. The maximum contact stress σ and effective contact length l of the sealing ring contact surface are selected as the sealing performance indicators. Then, the FE model established in Section 1 is adopted to obtain the sealing performance indicators in different combinations of design variables under working conditions, and the orthogonal test design scheme and test results can be obtained; the specific results are shown in Table 2.
| Level | Factors | ||||||
|---|---|---|---|---|---|---|---|
| A (mm) | B (mm) | C (mm) | D (mm) | E (mm) | F (mm) | G (mm) | |
| 1 | 1.0 | 1.3 | 2.7 | 0.7 | 2.1 | 1.4 | 1.1 |
| 2 | 1.5 | 1.8 | 3.2 | 1.2 | 2.6 | 1.9 | 1.6 |
| 3 | 2.5 | 2.3 | 3.7 | 1.7 | 3.1 | 2.4 | 2.1 |
| No. | A (mm) | B (mm) | C (mm) | D (mm) | E (mm) | F (mm) | G (mm) | σ (MPa) | l (mm) |
|---|---|---|---|---|---|---|---|---|---|
| 1 | 1.0 | 1.3 | 2.7 | 0.7 | 2.1 | 1.5 | 1.1 | 1157.25 | 3.95 |
| 2 | 1.0 | 1.8 | 3.2 | 1.2 | 2.6 | 1.9 | 1.6 | 1234.18 | 4.02 |
| 3 | 1.0 | 2.3 | 3.7 | 1.7 | 3.1 | 2.4 | 2.1 | 1171.06 | 3.23 |
| 4 | 1.5 | 1.3 | 2.7 | 1.2 | 2.6 | 2.4 | 2.1 | 1268.01 | 3.86 |
| 5 | 1.5 | 1.8 | 3.2 | 1.7 | 3.1 | 1.4 | 1.1 | 1256.25 | 3.75 |
| 6 | 1.5 | 2.3 | 3.7 | 0.7 | 2.1 | 1.9 | 1.6 | 1222.04 | 4.27 |
| 7 | 2.5 | 1.3 | 2.7 | 0.7 | 3.1 | 1.9 | 2.1 | 1222.11 | 3.25 |
| 8 | 2.5 | 1.8 | 3.7 | 1.2 | 2.1 | 2.4 | 1.1 | 1238.02 | 3.92 |
| 9 | 2.5 | 2.3 | 3.2 | 1.7 | 2.6 | 1.4 | 1.6 | 1256.56 | 3.49 |
| 10 | 1.0 | 1.3 | 3.7 | 1.7 | 2.6 | 1.9 | 1.1 | 1313.11 | 3.81 |
| 11 | 1.0 | 1.8 | 2.7 | 0.7 | 3.1 | 2.4 | 1.6 | 1155.88 | 3.72 |
| 12 | 1.0 | 2.3 | 3.2 | 1.2 | 2.1 | 1.4 | 2.1 | 1164.61 | 3.98 |
| 13 | 1.5 | 1.3 | 3.2 | 1.7 | 2.1 | 2.4 | 1.6 | 1221.13 | 4.04 |
| 14 | 1.5 | 1.8 | 3.7 | 0.7 | 2.6 | 1.4 | 2.1 | 1141.92 | 3.46 |
| 15 | 1.5 | 2.3 | 2.7 | 1.2 | 3.1 | 1.9 | 1.1 | 1175.30 | 3.79 |
| 16 | 2.5 | 1.3 | 3.7 | 1.2 | 3.1 | 1.4 | 2.1 | 1227.35 | 4.66 |
| 17 | 2.5 | 1.8 | 2.7 | 1.7 | 2.1 | 1.9 | 1.6 | 1140.63 | 3.93 |
| 18 | 2.5 | 2.3 | 3.2 | 0.7 | 2.6 | 2.4 | 1.1 | 1180.77 | 3.29 |
3.3. Range Analysis
The test results presented in Table 2 are analyzed using the range analysis method to determine the sequence of the impact of structural parameters on sealing performance, and the sensitivity analysis results of the structural parameters of the sealing ring on sealing performance can be obtained. In the analysis of range, the range analysis results R can be obtained by calculating the average value of the same value under each column of experimental conditions. The larger the R value, the greater the impact of the factor on the sealing performance indicators; naturally, the column with the largest range value is the most significant factor [20]. Table 3 shows the range analysis results of the maximum contact stress σ of the lip of the K-shaped metal seal structure for various design variables.
| Factor | A | B | C | D | E | F | G |
|---|---|---|---|---|---|---|---|
| k1 | 1191.35 | 1234.83 | 1186.53 | 1180 | 1190.64 | 1200.66 | 1220.15 |
| k2 | 1214.11 | 1194.51 | 1218.91 | 1217.94 | 1232.42 | 1217.90 | 1205.07 |
| k3 | 1210.94 | 1195.05 | 1218.95 | 1226.46 | 1201.33 | 1205.84 | 1199.18 |
| Range R | 14.76 | 40.32 | 32.41 | 46.46 | 41.78 | 17.74 | 20.97 |
As shown in Table 3, the maximum influence on the sealing performance is the outer contact width of the sealing ring D, with a maximum range value of 46.46. This is followed by the inner contact width E, the inner radius size B of the groove mouth, and the outer arc radius C. Other structural dimensions have a relatively small influence on the contact stress. Therefore, by comparing the range of each factor, the sequence of the influence of each factor on the contact stress can be obtained as follows: D > E > B > C > G > F > A.
The range analysis results of design variables on the effective contact width l on both sides of the sealing ring are illustrated in Table 4.
| Factor | A | B | C | D | E | F | G |
|---|---|---|---|---|---|---|---|
| k1 | 3.79 | 3.93 | 3.75 | 3.66 | 4.02 | 3.88 | 3.75 |
| k2 | 3.86 | 3.80 | 3.76 | 4.04 | 3.66 | 3.85 | 3.91 |
| k3 | 3.76 | 3.68 | 3.89 | 3.71 | 3.73 | 3.68 | 3.74 |
| Range R | 0.10 | 0.25 | 0.14 | 0.38 | 0.36 | 0.21 | 0.17 |
From the analysis of Table 4, the design variable with the largest range value of effective contact length is the outer contact width D, with a maximum value of 0.38, followed by the inner lip width of the sealing ring E and the inner radius of the groove mouth B. Other structural dimensions have relatively little influence on the effective contact length. Therefore, by comparing the range of each factor, the sequence of the influence of each factor on the effective contact width can be obtained as follows: D > E > B > F > G > C > A. Finally, the outer contact width of the sealing ring D, the inner lip width of the sealing ring E, and the inner radius of the groove mouth B are selected as the three most important influencing factors based on the analysis results of the range obtained from Tables 3 and 4.
4. Structural Optimization of K-Shaped Metal Sealing Ring
4.1. Optimization Model
4.2. RSMs for Sealing Performance Indicators of Sealing Rings
4.2.1. Design of Experiment
In order to reduce the time consumption of the sealing performance analysis using the FE method, a response surface is proposed to establish RSMs to predict the sealing performance indicators under different design variables rapidly, considering the variable dimension and nonlinearity degree of the sealing performance of the sealing structure [3, 21]. In the modeling of the response surface, the inner lip width of the sealing ring E, the outer contact width of the sealing ring D, and the inner radius of the groove mouth B are used as the input design factors, denoted as x1, x2, and x3, respectively. The three factors of the experimental input are analyzed at three levels based on the Box–Behnken experiment design method. All the sealing performance indicators of each group of schemes, including the maximum contact stress σ, maximum equivalent stress σmax, and effective contact width l, can be obtained by using the FE model, and all the results of 17 orthogonal experimental design schemes and simulation tests are shown in Table 5.
| No. | x1 (mm) | x2 (mm) | x3 (mm) | σ (MPa) | l (mm) | σmax (MPa) |
|---|---|---|---|---|---|---|
| 1 | 3.1 | 0.7 | 1.8 | 1019.15 | 4.20 | 1103.39 |
| 2 | 3.1 | 1.2 | 1.3 | 1022.04 | 5.16 | 1064.58 |
| 3 | 2.6 | 0.7 | 1.3 | 1054.09 | 3.30 | 1306.49 |
| 4 | 2.1 | 1.7 | 1.8 | 1470.97 | 4.08 | 983.49 |
| 5 | 2.6 | 1.2 | 1.8 | 1312.18 | 4.26 | 1117.30 |
| 6 | 2.6 | 1.2 | 1.8 | 1312.18 | 4.26 | 1117.30 |
| 7 | 2.6 | 1.2 | 1.8 | 1312.18 | 4.26 | 1117.30 |
| 8 | 3.1 | 1.7 | 1.8 | 1165.05 | 6.02 | 948.91 |
| 9 | 3.1 | 0.7 | 2.3 | 1190.32 | 5.16 | 1056.09 |
| 10 | 2.6 | 1.7 | 1.3 | 1182.12 | 5.25 | 974.81 |
| 11 | 2.1 | 1.7 | 1.8 | 1361.60 | 2.55 | 1250.02 |
| 12 | 2.1 | 1.2 | 1.3 | 1337.11 | 3.15 | 1203.88 |
| 13 | 2.6 | 0.7 | 2.3 | 1307.43 | 4.26 | 1118.81 |
| 14 | 2.6 | 1.2 | 1.8 | 1312.18 | 4.26 | 1117.30 |
| 15 | 2.6 | 1.2 | 1.8 | 1312.18 | 4.26 | 1117.30 |
| 16 | 2.6 | 1.7 | 2.3 | 1374.02 | 5.25 | 1081.41 |
| 17 | 2.1 | 1.2 | 2.3 | 1294.99 | 4.09 | 1249.61 |
4.2.2. RSMs
The magnitude of the coefficients in the regression model equation reflects the impact of the design variables on the performance indicator. Substituting the values of the design variables of the K-shaped metal seal ring into Equations (2)–(4), the predicted values of the contact pressure σ, effective contact width l, and maximum equivalent stress σmax of the sealing ring can be obtained. At last, the RSMs of the maximum contact stress σ, effective contact width l, and maximum equivalent stress σmax are illustrated in Figures 6, 7, and 8 based on Equation (2)–(4).
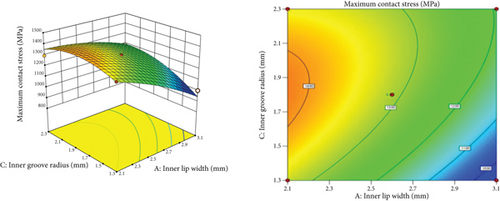
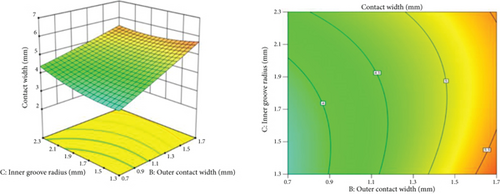
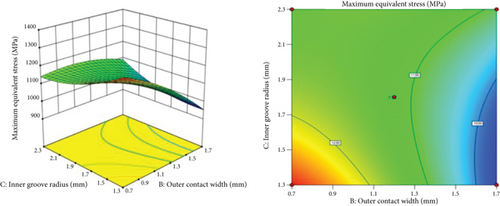
It can be seen from Figure 6 that the maximum contact stress decreases as the width of the inner lip increases, and a larger contact stress can be obtained when the inner lip width is taken to be larger. From the analysis of Figure 7, the effective contact width increases with the increase of the outer contact width, and a larger effective contact width of the seal ring can be obtained by taking a larger value for the outer contact width. According to the analysis of Figure 8, the maximum equivalent stress decreases with the increase of the outer contact width and increases with the decrease of the inner notch radius value. These results indicate that a larger value should be used for the outer contact width and a smaller value should be used for the inner lip width during the structural optimization of the K-shaped sealing ring. Furthermore, from the analysis of the trends of the response value changes, the interaction between the inner lip width and the contact pressure is more pronounced when the radius of the inner slot varies between 1.5 and 2.1 mm, and the interaction between the outer contact width and equivalent stress is more pronounced when the radius varies between 1.3 and 1.7 mm. These can provide a basis for the determination of the value ranges of design variables.
4.2.3. Evaluation of Prediction Performance of RSMs
In the modeling of a RSM, poor prediction accuracy of the final response model will occur due to deviations in the simulation results or insufficient sample size. Therefore, in order to ensure the prediction accuracy of the established RSM, it is necessary to evaluate the prediction performance of the obtained regression models. In this paper, the F-value test, coefficient of variation (cv), and multiple correlation coefficient methods are used for the evaluation of the prediction performance of RSMs [18]. Herein, the F-value test results of the three RSMs are illustrated in Tables 6, 7, and 8 separately.
| Sources of the variation | F value | p value (prob > F) | |
|---|---|---|---|
| Model | 15.36 | 0.0008 | Significant |
| x1 | 78.42 | 0.0001 | |
| x2 | 16.54 | 0.0048 | |
| x3 | 19.40 | 0.0031 | |
| x1x2 | 0.1776 | 0.6861 | |
| x1x3 | 7.02 | 0.0329 | |
| x2x3 | 0.0173 | 0.8989 | |
| 2.64 | 0.1484 | ||
| 1.24 | 0.3024 | ||
| 11.46 | 0.0117 |
| Sources of the variation | F value | p value (prob > F) | |
|---|---|---|---|
| Model | 57.09 | < 0.0001 | Significant |
| x1 | 290.03 | < 0.0001 | |
| x2 | 197.77 | < 0.0001 | |
| x3 | 3.90 | 0.0887 | |
| x1x2 | 1.47 | 0.2653 | |
| x1x3 | 0.0347 | 0.8575 | |
| x2x3 | 8.88 | 0.0205 | |
| 6.41 | 0.0391 | ||
| 5.04 | 0.0596 | ||
| 1.01 | 0.3491 |
| Sources of the variation | F -value | p value (prob > F) | |
|---|---|---|---|
| Model | 23.41 | 0.0002 | Significant |
| x1 | 47.23 | 0.0002 | |
| x2 | 110.21 | < 0.0001 | |
| x3 | 0.3418 | 0.5772 | |
| x1x2 | 4.57 | 0.0699 | |
| x1x3 | 1.05 | 0.3406 | |
| x2x3 | 30.81 | 0.0009 | |
| 0.7592 | 0.4125 | ||
| 7.09 | 0.0323 | ||
| 8.42 | 0.0229 |
As shown in Table 6, the F value of the model is 15.36, and the corresponding p value is 0.0008. It can be concluded that the obtained RSM is significant, which means that the model is only 0.08% likely to be affected by other factors. If the p value of a certain item is less than or equal to 0.05, it indicates that the corresponding factor also has good significance. From the analysis of Table 6, it can be concluded that the regression model of the maximum contact stress on the sealing surface is significant for the interaction of the inner lip width of the sealing ring x1, the outer contact width of the sealing ring x2, the inner radius of the groove mouth x3, and the interaction of the inner lip width itself x1x3 for the sealing ring. In order to substantiate the fitting accuracy of the maximum contact stress RSM, the leave-one-out cross-validation method is applied to obtain the R2 value based on the data set illustrated in Table 5, and the mean R2 value is 0.943. It demonstrates that the fitting accuracy of the established maximum contact stress RSM meets the requirements of the accuracy.
As shown in Table 7, the F value of the model is 57.09, and its corresponding p value is less than 0.0001, indicating that the regression model is highly significant, meaning that there is only a small probability of being affected by other factors. For the items with a p value less than or equal to 0.05 in the model, it indicates that the corresponding factors have a significant impact on the indicator. From the analysis of Table 7, it can be found that the interaction of the inner lip width of the sealing ring x1, the outer contact width of the sealing ring x2, and the outer contact width itself x2x3 have a significant impact on the regression model of the effective contact width. In order to substantiate the fitting accuracy of the effective contact width RSM, the leave-one-out cross-validation method is applied to obtain the R2 value based on the data set illustrated in Table 5, and the mean R2 value is 0.971. It demonstrates that the fitting accuracy of the established effective contact width RSM meets the requirements of the accuracy. And the fitted RSM can reflect the effective contact width of the seal effectively.
As shown in Table 8, the F value of the model is 23.41, and its corresponding p value is 0.0002, which means that there is only a small probability of being affected by other factors. It can be concluded that the regression model of the maximum equivalent stress on the sealing surface is significant for the interaction of the interaction between the inner lip width x1, the effective outer contact width x2, and the interaction of the inner lip width itself x2x3 for the sealing ring. Nevertheless, the inner radius of the groove mouth has a relatively small impact on the maximum equivalent stress of the sealing ring. Similarly, in order to substantiate the fitting accuracy of the maximum equivalent stress RSM, the leave-one-out cross-validation method is applied to obtain the R2 value based on the data set illustrated in Table 5, and the mean R2 value is 0.945. It demonstrates that the fitting accuracy of the established maximum equivalent stress RSM meets the requirements of the accuracy. Then, the cv value and multiple correlation coefficient results of the three RSMs are included in Table 9.
| RSMs | F value | Coefficient of variation | Multiple correlation coefficient |
|---|---|---|---|
| Maximum contact stress | 0.0008 | 3.47% | 0.9518 |
| Effective contact width | < 0.0001 | 3.76% | 0.9866 |
| Maximum equivalent stress | 0.0002 | 2.38% | 0.9678 |
According to the fitting performance indicators of the RSMs in Table 9, the cv value of the maximum contact stress, effective contact length, and maximum equivalent stress model of the sealing ring are relatively small, which are 3.47%, 3.76%, and 2.38%, respectively. This indicates that the three fitting models can predict the sealing performance indicators well, and the error between the predicted values and the true values is relatively small. The multiple correlation coefficients of the three models are 0.9518, 0.9866, and 0.9678, all greater than 0.9, indicating that the predicted values of the response surfaces for the three target parameter values are very close to the values simulated by the FE model.
4.3. Structural Optimization
4.3.1. Multiobjective Optimization
In order to reduce the time consumption of the optimization process, the established RSMs are used as the objective functions in Equation (1) correspondingly, and the optimization module in the optimization software Design-Expert13.0 is used to search an optimal combinations of design variables of metal sealing ring. At last, 30 sets of optimized values and corresponding structural parameters are obtained, as shown in Table 10.
| No. | x1 (mm) | x2 (mm) | x3 (mm) | σ (MPa) | l (mm) | σmax (MPa) | Expected value |
|---|---|---|---|---|---|---|---|
| 1 | 2.263 | 1.700 | 1.578 | 1395.351 | 4.600 | 976.338 | 0.725 |
| 2 | 2.263 | 1.700 | 1.581 | 1395.749 | 4.500 | 976.568 | 0.716 |
| 3 | 2.264 | 1.700 | 1.584 | 1396.308 | 4.500 | 976.895 | 0.716 |
| 4 | 2.261 | 1.700 | 1.567 | 1393.785 | 4.500 | 975.478 | 0.716 |
| 5 | 2.260 | 1.700 | 1.562 | 1392.970 | 4.500 | 975.053 | 0.716 |
| 6 | 2.266 | 1.700 | 1.601 | 1398.562 | 4.500 | 978.307 | 0.716 |
| 7 | 2.262 | 1.700 | 1.573 | 1394.485 | 4.500 | 976.093 | 0.716 |
| 8 | 2.258 | 1.700 | 1.550 | 1391.134 | 4.500 | 974.167 | 0.716 |
| 9 | 2.255 | 1.700 | 1.531 | 1388.089 | 4.500 | 972.794 | 0.716 |
| 10 | 2.267 | 1.698 | 1.596 | 1397.682 | 4.500 | 978.579 | 0.715 |
| 11 | 2.256 | 1.700 | 1.521 | 1385.606 | 4.508 | 971.977 | 0.715 |
| 12 | 2.252 | 1.700 | 1.511 | 1384.513 | 4.500 | 971.408 | 0.715 |
| 13 | 2.276 | 1.700 | 1.569 | 1390.788 | 4.540 | 975.169 | 0.715 |
| 14 | 2.280 | 1.686 | 1.575 | 1391.025 | 4.548 | 975.553 | 0.715 |
| 15 | 2.267 | 1.696 | 1.587 | 1395.922 | 4.500 | 978.690 | 0.714 |
| 16 | 2.245 | 1.700 | 1.474 | 1377.704 | 4.500 | 969.241 | 0.713 |
| 17 | 2.280 | 1.700 | 1.703 | 1409.993 | 4.500 | 989.005 | 0.711 |
| 18 | 2.241 | 1.700 | 1.449 | 1372.727 | 4.500 | 967.990 | 0.711 |
| 19 | 2.276 | 1.689 | 1.604 | 1396.848 | 4.500 | 982.819 | 0.710 |
| 20 | 2.282 | 1.700 | 1.715 | 1411.000 | 4.500 | 990.427 | 0.710 |
| 21 | 2.322 | 1.700 | 1.683 | 1399.432 | 4.615 | 984.977 | 0.710 |
| 22 | 2.422 | 1.700 | 1.736 | 1385.030 | 4.847 | 986.690 | 0.699 |
| 23 | 2.433 | 1.700 | 1.598 | 1359.342 | 4.923 | 971.567 | 0.699 |
| 24 | 2.433 | 1.700 | 1.730 | 1381.865 | 4.876 | 985.446 | 0.698 |
| 25 | 2.299 | 1.669 | 1.635 | 1396.481 | 4.500 | 993.607 | 0.698 |
| 26 | 2.482 | 1.700 | 1.750 | 1373.270 | 4.985 | 985.151 | 0.693 |
| 27 | 2.473 | 1.700 | 1.771 | 1377.939 | 4.959 | 988.456 | 0.693 |
| 28 | 2.580 | 1.700 | 1.794 | 1355.412 | 5.193 | 984.689 | 0.683 |
| 29 | 2.263 | 1.700 | 1.300 | 1323.308 | 4.641 | 963.510 | 0.682 |
| 30 | 2.329 | 1.645 | 1.713 | 1400.272 | 4.500 | 1009.345 | 0.682 |
Table 10 shows the search results of the optimization process; the larger the expected value, the better the effect of the optimization result corresponding to a column. Therefore, the optimization result with the highest expected value is selected as the final optimum solution, and the first set of parameters is selected as the final optimization result shown in Table 10.
4.3.2. Optimization Results and Discussion
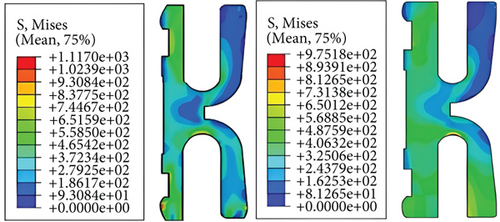
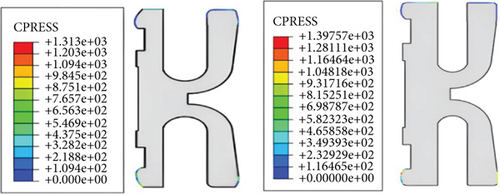
In order to validate the effectiveness of the optimization solution, the sealing performance indicators are simulated based on the optimization structure to compare with the initial structure. Figure 9 shows the comparison of the equivalent stress distributions of the K-shaped sealing ring before and after optimization. It can be seen that the maximum equivalent stress before optimization is located at the inner and outer lips and inner slots, with a maximum value of 1117 MPa. Then, the stress at the inner and outer sides is transferred to a larger area, eliminating the phenomenon of stress concentration at this location after optimization. The maximum equivalent stress is only distributed at the inner notch, with a maximum value of 975.18 MPa, and it does not exceed the yield strength of the material. Figure 10 shows the comparison of the contact stress distributions of the K-shaped sealing ring before and after optimization. It can be seen that the contact stress on the inner and outer sealing lips has increased significantly after optimization, with a stress value much greater than three times the medium pressure (69 MPa), meeting the sealing performance requirements. To display the optimization effect more intuitively, specific values of the design variables and sealing performance indicators before and after optimization are presented in Table 11.
| Items | x1 (mm) | x2 (mm) | x3 (mm) | σ (MPa) | l (mm) | σmax (MPa) |
|---|---|---|---|---|---|---|
| Initial structure | 2.600 | 1.200 | 1.800 | 1313.0 | 4.26 | 1117.0 |
| Optimized | 2.263 | 1.700 | 1.578 | 1397.57 | 4.56 | 975.18 |
From the analysis of Table 10, after optimization, the maximum contact stress increased by 84.57 MPa, an increase of 6.44% compared to before optimization; the effective contact length increased by 0.3 mm, an increase of 7.04% compared to before optimization; and the maximum equivalent stress decreased by 141.82 MPa, a decrease of 14.54% compared to before optimization. To sum up, after optimization, the maximum equivalent stress decreases significantly, and the maximum contact stress and effective contact width increase, proving that the optimized structure is more reasonable, the contact stress of the sealing surface lip is more uniform, and the sealing performance of the metal sealing structure is improved. It also validates the effectiveness of the proposed method in optimizing the sealing performance of the metal sealing structure of subsea tubing hanger.
5. Conclusions
- 1.
Sensitivity analysis method is applied to obtain the primary and secondary relationships between structural parameters affecting the sealing performance of a K-shaped metal sealing ring, and three significant structural parameters, namely, the inner width of the sealing ring, the outer contact width of the sealing ring, and the inner radius of the groove mouth, are identified as design variables of the sealing ring structure optimization.
- 2.
RSMs of the sealing performance indicators are established by using the secondary response surface method considering the interaction between parameters on the sealing performance. Besides, the evaluation results of the RSMs’ prediction performance indicate that the secondary response surface method can fit the sealing performance indicators accurately.
- 3.
An optimization model is established to obtain the optimum design variables of the K-shaped sealing ring, in which the established sealing performance RSMs are applied as the objective functions to reduce the optimization time consumption. Then, optimum design variables are obtained by using an optimization algorithm finally. And the comparison of the sealing performance before and after optimization indicates that the optimum structure can increase the maximum contact stress by 6.44%, increase the effective contact length by 7.04%, and reduce the maximum equivalent stress by 14.54%. The effectiveness of the proposed method is validated.
Disclosure
All the authors declare that they agree to be accountable for the content and conclusions of the article. There are no persons or third-party services involved in the research or manuscript preparation who are not listed as authors and have not been acknowledged.
Conflicts of Interest
The authors declare no conflicts of interest.
Author Contributions
Conceptualization, W.Z.; methodology, H.X.; software, H.Z.; validation, Y.F.; formal analysis, H.Z.; investigation, Y.F.; data curation, L.L.; H.X. and H.Z. wrote the manuscript; W.Z. polished the language.
Funding
The author gratefully acknowledges the financial support of the Natural Science Basic Research Plan in Shaanxi Province of China (grant numbers: 2025-JC-YB-1941, 2023-YBGY-068, and 2023-YBGY-155). The Opening Project of Material Corrosion and Protection Key (grant number: 2022CL27).
Acknowledgments
The author gratefully acknowledges the financial support of the Natural Science Basic Research Plan in Shaanxi Province of China (grant number: 2025-JC-YB-1941, 2023-YBGY-068, and 2023-YBGY-155). The Opening Project of Material Corrosion and Protection Key (grant number: 2022CL27). No AI software has been used to prepare the manuscript—as a whole or in part.
Open Research
Data Availability Statement
The data that support the findings of this study are available from the corresponding author upon reasonable request.


