Maternal Phylogeny and Genetic Structure of Wild Sheep/Argali (Bovidae, Ruminantia) Populations in China
Abstract
Argali, also known as wild sheep (Ovis ammon), is a prominent alpine mammal found in Central Asia. It is of conservation concern globally and domestically in China. Our study aims to unveil the genetic diversity and phylogenetic relationships among argali populations in China using the mitochondrial cytochrome b (Cytb) and control region (CR) sequences. We noninvasively collected a total of 77 fecal or tissue samples from various locations within Xinjiang, covering most of its range. Consequently, we identified 22 distinct haplotypic sequences for Cytb (1140 bp) and 36 for CR (1107–1260 bp). In our phylogenetic analyses, all sequences from China and abroad were grouped into 10 different clades, labeled as clade A through clade J. The network clustering pattern was consistent with the phylogenetic topology. The genetic distance and genetic divergence between clades ranged from 1.21% to 9.25% and from 0.30 to 0.94, respectively. Our analysis of molecular variation (AMOVA) analysis also revealed that more than 70% of the variation was accounted for among the clades. The genetic differentiation between populations was positively corelated with geography distances (r = 0.472, p < 0.01). We observed significant differences in genetic diversity among the various populations. The mismatch distribution analysis showed a multimodal distribution for all clades. Fu’s Fs and Tajima’s D values were not statistically significant. In conclusion, we genetically identified 10 matrilineal populations, which may represent subspecies of argali population, eight of which were in China. The demographic history analyses suggest that the population size of all argali evolutionary populations remained relatively stable. Nonetheless, some populations need special attention due to their low level of genetic diversity.
1. Introduction
Argali, Ovis ammon, has the biggest body size among the wild sheep, weighing 65–185 kg, reaching 50–120 cm in shoulder height and 150–189 cm in body length [1]. This animal dwells in the high mountains and hills, mostly in mountain grassland, alpine meadows, and subalpine meadow grasslands. Globally, its habitat ranges from Russian Siberia and Mongolia on the north to Nepal and southwest China on the south, from the Mongolian Plateau on the east to the Nulato mountains in Uzbekistan on the west, with an altitude range of 400 m – 5000 m. Due to mountainous distribution, as a primary consumer on the food cycle, it not only enhances the biodiversity of mountainous ecosystems by foraging on the vegetation, [4] but is also one of the key preys of endangered predators, such as snow leopards (Panthera uncia), wolves (Canis lupus), and lynxes (Lynx lynx), associating with their population fluctuation [5, 6]. Therefore, argali has an important ecological service function and is indispensable in the mountainous ecosystem with great ecological value.
Nowadays, although the argali current population is locally stable or increasing in size in specific regions, it is globally decreasing [7] because of poaching, husbandry development, mining industry, fencing, and climate change [8–11]. Argali is hence listed as Near Threatened (NT) by the International Union for Conservation of Nature (IUCN) Red List of Threatened Species since the 2020 latest evaluation. In China, the argali geographic populations have been given a different protection priority. For instance, the Xizang argali population (Ovis hodgsoni) is a National Class I key protected population, while the others are National Class II key protected [12].
Subspecies is the most basic and commonly used classification of the argali. The widespread distribution allows argali populations to adapt to different living environments, leading to different morphological features and genetic differences between different geographic populations [13], resulting in disputable intraspecific classification, identifying four to nine subspecies [14, 15]. To the best of our knowledge, the latest investigation of the phylogenetic relationship between populations of O. ammon based on genome-wide SNP and mitogenome analyses by Dotsev et al. [2] revealed four clusters of five subspecies—Altai argali (O. a. ammon), Gobi argali (O. a. darwini), Pamir argali (O. a. polii), Tian Shan argali (O. a. karelini), and Kyzylkum argali (O. a. severtzovi). Besides, gene flow and long-distance migration were evident between some populations.
However, despite China being the primary habitat for argali, there is a scarcity of samples from this region. Additionally, the classification and distribution of argali within China has been a subject of dispute. For instance, while Fedosenko et al. [14] identified nine subspecies, other researchers have proposed additional subspecies, such as Lopnur argali (O. a. adametzi), Ili argali (O. a. littledalei), Junggar argali (O. a. sairensis), Dalai Lama argali (O. a. dalailamae), Kashgar argali (O. a. humei), and Hoten argali (O. a. hetianensis) based on differences in distribution areas, external morphological features, and skull morphology [13, 16]. Furthermore, Gao et al. [17] described 10 subspecies, including O. a. ammon in the Altay Mountains, O. a. sairensis in the western Junggar Basin, O. a. darwini on the Chinese–Mongolian border, O. a. littledalei in the northern Tianshan, O. a. karelini in the southern Tian Shan (north starts from Akqi), O. a. adamelzi in the Kuluk Mountains (northeast of Lop Nur Lake), O. a. polii in the Pamir, western Kunlun Mountains, and southern Tianshan (south of Akqi), and O. a. dalailamae in the eastern Kunlun and Arjin Mountains. In recent years, the China Animal Scientific Database 2023 version has proposed seven subspecies of argali, including O. a. ammon (Altai/Zhi-Ming subspecies) in the Altay Mountains of Xinjiang, O. a. hodgsoni (Xizang subspecies) in southwest Gansu, Qinghai, western Sichuan, and Xizang/Tibet, O. a. polii (Pamir subspecies) in the Pamir plateau of Xinjiang, O. a. collium (Middle Asia/Kazak subspecies) in northwest Xinjiang, O. a. karelini (Tian-Shan subspecies) in the Tianshan Mountains of Xinjiang, O. a. jubata (Hua-Bei subspecies) in central Inner Mongolia, and O. a. darwini (Gobi/Inner Mongolia subspecies) in south Inner Mongolia, northwest Gansu, and south Xinjiang [54]. However, the Convention on International Trade in Endangered Species of Wild Fauna and Flora (CITES, http://www.cites.org.cn/citesgy/fl/202302/t20230227734178.html) in 2023 have proposed nine distinct species of argali while the National Grassland and Forestry Administration and National Park Administration (https://www.forestry.gov.cn/search/97044) in 2021 six species, both elevating the previously mentioned subspecies to the species level.
Recently, molecular genetic studies have refined the taxonomy of animals. Different mitochondrial markers were used to clarify phylogenetic relationships in ungulate species [22, 23, 52]. So far, molecular genetic studies of the argali population outside of China [2, 18–21] have been conducted. The mountainous habitat, desolate distribution, low level of population density, as well as a high degree of vigilance of this animal hindered the collection of genetic samples for genetic studies in China [3]. As such, we overcame these difficulties and carried out noninvasive sample collection for more than 2 years. Here, we aim to investigate genetic diversity and the phylogenetic relationship between populations of O. ammon in Xinjiang, China, based on two mitochondrial genetic markers, hoping to provide a baseline for scientific classification and effective conservation.
2. Materials and Methods
2.1. Samples
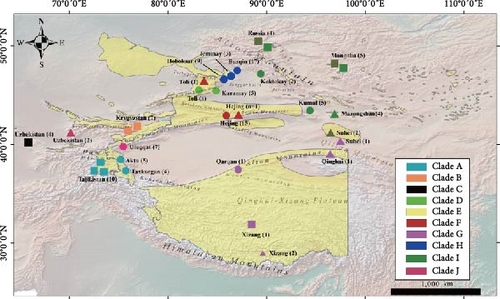
We collected a total of 77 samples from 12 different geographic localities in Xinjiang, China, from July 2022 to January 2024. The sample size for different localities ranges from 1 to 17 (Figure 1 and Table 1). Most of the samples were feces; a few dried skin or tissue samples from naturally dead individuals were also taken. One tissue sample was provided by the Altun Mountain National Nature Reserve. In the field, to ensure the individual identity of fecal samples, we followed the methods described by Wang et al. [22] and Abduriyim et al. [23]. All the fecal samples were placed in a 50 mL collection tube with absolute ethanol, while dried skin and tissue samples were put into a plastic sealable bag, then shifted to laboratory preservation at −80°C.
| Locality | Subspecies | Clade | Gene | N | Hn | S | Hd | π |
|---|---|---|---|---|---|---|---|---|
| Aktu | O. a. polli | A | Cytb | 5 | 3 | 2 | 0.800 ± 0.164 | 0.00088 ± 0.00024 |
| — | — | CR | 5 | 5 | 14 | 1.000 ± 0.126 | 0.00585 ± 0.00113 | |
| — | — | Cytb + CR | 5 | 5 | 16 | 1.000 ± 0.126 | 0.00331 ± 0.00186 | |
| Taxkorgan | — | — | Cytb | 4 | 3 | 3 | 0.833 ± 0.222 | 0.00161 ± 0.00046 |
| — | — | CR | 4 | 3 | 25 | 0.833 ± 0.222 | 0.01234 ± 0.00401 | |
| — | — | Cytb + CR | 4 | 4 | 28 | 1.000 ± 0.177 | 0.00686 ± 0.00212 | |
| Toli | O. a. littledalei | D | Cytb | 4 | 1 | 0 | — | — |
| — | — | CR | 4 | 3 | 5 | 0.833 ± 0.222 | 0.00244 ± 0.00102 | |
| — | — | Cytb + CR | 4 | 3 | 5 | 0.833 ± 0.222 | 0.00119 ± 0.00050 | |
| Karamay | — | — | Cytb | 5 | 1 | 0 | — | — |
| — | — | CR | 5 | 3 | 16 | 0.700 ± 0.218 | 0.00804 ± 0.00242 | |
| — | — | Cytb + CR | 5 | 3 | 16 | 0.700 ± 0.218 | 0.00394 ± 0.00118 | |
| Hejing | O. a. adametzi | F | Cytb | 15 | 3 | 2 | 0.362 ± 0.145 | 0.00033 ± 0.00014 |
| — | — | CR | 15 | 3 | 7 | 0.448 ± 0.134 | 0.00181 ± 0.00059 | |
| — | — | Cytb + CR | 15 | 4 | 9 | 0.467 ± 0.148 | 0.00107 ± 0.00035 | |
| Qarqan | O. a. hodgsoni | G | Cytb | 1 | 1 | 0 | — | — |
| — | — | CR | 1 | 1 | 0 | — | — | |
| — | — | Cytb + CR | 1 | 1 | 0 | — | — | |
| Burqin | O. a. sairensis | H | Cytb | 17 | 2 | 6 | 0.118 ± 0.101 | 0.00062 ± 0.00053 |
| — | — | CR | 17 | 3 | 2 | 0.324 ± 0.136 | 0.00031 ± 0.00014 | |
| — | — | Cytb + CR | 17 | 4 | 8 | 0.419 ± 0.141 | 0.00047 ± 0.00027 | |
| Hoboksar | — | — | Cytb | 9 | 3 | 2 | 0.556 ± 0.165 | 0.00078 ± 0.00024 |
| — | — | CR | 9 | 5 | 13 | 0.861 ± 0.087 | 0.00472 ± 0.00102 | |
| — | — | Cytb + CR | 9 | 5 | 15 | 0.861 ± 0.087 | 0.00271 ± 0.00059 | |
| Jeminay | — | — | Cytb | 3 | 1 | 0 | — | — |
| — | — | CR | 3 | 1 | 0 | — | — | |
| — | — | Cytb + CR | 3 | 1 | 0 | — | — | |
| Humul | O. a. ammon | I | Cytb | 5 | 3 | 8 | 0.800 ± 0.164 | 0.00386 ± 0.00096 |
| — | — | CR | 5 | 4 | 16 | 0.900 ± 0.161 | 0.00768 ± 0.00207 | |
| — | — | Cytb + CR | 5 | 5 | 24 | 1.000 ± 0.126 | 0.00573 ± 0.00144 | |
| Koktokay | — | — | Cytb | 2 | 2 | 8 | 1.000 ± 0.500 | 0.00702 ± 0.00351 |
| — | — | CR | 2 | 2 | 2 | 1.000 ± 0.500 | 0.00183 ± 0.00091 | |
| — | — | Cytb + CR | 2 | 2 | 10 | 1.000 ± 0.500 | 0.00448 ± 0.00332 | |
| Ulugqat | O. a. nigrimontana | J | Cytb | 7 | 3 | 36 | 0.524 ± 0.209 | 0.00902 ± 0.00600 |
| — | — | CR | 7 | 6 | 20 | 0.952 ± 0.096 | 0.00534 ± 0.00144 | |
| — | — | Cytb + CR | 7 | 6 | 56 | 0.857 ± 0.137 | 0.00691 ± 0.00309 | |
| Total | — | — | Cytb | 77 | 22 | 75 | 0.902 ± 0.021 | 0.01024 ± 0.00122 |
| — | — | CR | 77 | 36 | 156 | 0.929 ± 0.020 | 0.02709 ± 0.00141 | |
| — | — | Cytb + CR | 77 | 42 | 231 | 0.935 ± 0.019 | 0.01848 ± 0.00121 |
- Note: The letters N, Hn, S, Hd and π denote sample size, number of haplotypes, segregating sits, haplotype diversity and nucleotide diversity (sample size corrected), respectively.
2.2. Laboratory Works
The total genomic DNA was extracted from fecal samples using either a Stool DNA Isolation Kit version 1.1 (Foregene, Chengdu, China) or a TIANamp Stool DNA Kit (DP328; Tiangen, Beijing, China) according to the manufacturer’s manuals. And those from dried skin and tissue samples were extracted using a TIANamp Genomic DNA Kit (DP304; Tiangen), following its instructions. DNA extracts were run on gel electrophoresis, prior to measuring concentration and purity by the Thermo Nanodrop 1000, then stored at 4°C for later use.
To obtain the full length of the mitochondrial cytochrome b (Cytb) and control region (CR) genes, we, based on mitogenome sequences of argali [2], designed primer pairs that amplify longer than their actual length. The Cytb-F (5′-CATCATTCTCACATGGAATC-3′) and Cytb-R (5′-GCTTCTTCCTTGAGTCTTG-3′) were synthesized to amplify 1301 bp product covering Cytb, while D-loop-F (5′-CCCCACCATCAACACCCAAAGCTGA-3′) and D-loop-R (5′-CCTGAAGTAGGAACCAGATG-3′) were synthesized to amplify 1421 bp product covering CR. The PCR amplification in a total volume of 25 mL was carried out, containing 40–140 ng of DNA template, 5 pmol of each primer, and 12 μL of a 2 × Taq PCR mix kit, adding up to the final volume with double-distilled water. And the PCR reaction conditions for both Cytb and CR sequence amplification were pre-denaturation at 94°C for 4 min, following 35 cycles of 94°C for 1 min, 54°C for 30 sec, and 72°C for 45 sec, and final extension at 72°C for 5 min. The PCR products were then run on a 3% gel electrophoresis to check for positive amplification, then sent for sequencing commercially.
2.3. Data Analyses
The obtained raw sequence data were checked and edited manually using SeqMan and MEGA version 6.0 [24], then aligned with MEGA version 6.0 using MUSCLE with default settings, and BLAST searched at NCBI to confirm their gene identity, then used for downstream analyses.
Genetic diversity indices, including segregating sites (S), number of haplotypes (Hn), haplotype diversity (Hd), and nucleotide diversity (π), as well as the genetic differentiation index FST and genetic distance, were calculated with DnaSP version 5.10.01 [25]. A hierarchical analysis of molecular variation (AMOVA; [26]) with the significance of variance components determined by means of 10,000 random permutations was conducted with Arlequin version 3.11 [27]. Arlequin also was used to conduct neutral tests (Tajima’s D test and Fu’s Fs test with the significance level <0.05) to test if the population/s have experienced population size expansion in history. DnaSP version 5.10.01 [25] was used for progressive mismatch analysis of different clades.
The phylogenetic relationship analyses of haplotypes were performed using maximum likelihood and Bayesian inference with IQtree version1.6.8 [28] and MrBayes version 3.1.2 [29], respectively. Prior to constructing a Bayesian tree, the best-fit model (invgamma+GTR_Gamma) for analytical sequences was selected with Kakusan version 4 [30]. Then two of the four Markov chains (one cold and three heated) run independently over 10,000,000 generations, sampling once every 1000 generations. The first 25% of trees were discarded as burn-in after checking the convergence of parameter values for two runs in Tracer version1.7.2 [31]. Then a phylogenetic tree was visualized in FigTree version 1.4.4 (http://tree.bio.ed.ac.uk/software/figtree/) to edit and check consensus. In addition, the mutational relationships amongst haplotypes were visualized with a median-joining network [32] constructed with PopART version 1.7 (http://popart.otago.ac.nz).
In the phylogenetic and network analyses, we also included sequences from mainly Dotsev et al. [2] and Wu et al. [3]. Namely, we retrieved Cytb and CR sequences from the whole mitogenome of O. a. ammon, O. a. darwini, O. a. polii, O. a. karelini, and O. a. severtzovi sampled outside of China [2]; and only the CR of O. a. ammon, O. a. dalai-lamae, O. a. danwini, O. a. hodgsoni, O. a. sairensis, and O. a. adametzi sampled from Xinjinag, Xizang, Gansu, and Qinghai provinces in China, and that of O. a. servertzovi and O. a. nigrimontana sampled from Uzbekistan [3]. Because the datasets from these two studies and this study were different, we used the CR dataset from all three studies and the Cytb + CR dataset from Dotsev et al. [2] and this study. Sequences with uncertain origins were excluded from genetic diversity and genetic stucture analyses.
We performed the Mantel test of correlations between genetic and geographical distance matrices using the Vegan package in R version 4.3.3 software (www.r-project.org), visualizing the results with ggplot2 and geom_smooth in R software. The between geographic populations mean genetic distances based on Cytb+CR sequences were calculated in MEGA, while the geographic distance was calculated in ArcGIS using the physical distances (km) between sampling sites.
To further evaluate the subspecies, delimitation for Argali populations, we applied Nei’s net nucleotide divergence (dA) and percent diagnosable (PD) of Cytb+CR dataset [33–35]. The dA between clades revealed in the phylogenetic and network analyses were calculated based on the Cytb + CR sequences in DNAsp version 5.0. According to the method described in Archer et al. [34], we used the Random Forest model to estimate the PD for each subspecies comparison, which was implemented in the randomForest package [36] in R version 4.3.3 software. This model effectively leverages the predictive power of all variable sites while generating an internally validated classifier. Each tree in the forest is constructed using a random subset of sequences designated as the training set for that tree. The sequences not included in the training set are reserved for cross-validation to assess the tree’s prediction accuracy. For a detailed description, refer to Archer et al. [34].
3. Results
3.1. Sequence Variation And Genetic Diversity
Out of 77 full-length Cytb (1140 bp) and CR (1107–1260 bp) sequences, we were able to identify 23 and 37 distinct (haplotypic) sequences, respectively. By concatenating the Cytb and CR sequences (2247–2400 bp), we were able to construct 42 haplotypes (Table 1). After aligning all obtained sequences using the Muscle algorithm in MEGA, we discovered that several sequences were longer than others, with the extra portions located in the middle of the CR sequence. These regions were identified as insertions [37], which were not included in the nucleotide diversity calculations. In Ulugqat, we found six haplotypes (Haps 66–71 in the phylogenetic trees) with a 77-bp insertion at sites 1430–1506, and haplotype 71 also had a 76-bp insertion at sites 1283–1358. Additionally, we discovered 75-bp insertions at sites 1431–1505 in Hap 58 (from Qarqan), Haps 38–40 (Burqin), and Hap 46 (Hoboksar) in the CR. The inserted positions and sequences were shown in Supporting Figure S1.
Significant differences in genetic diversity were observed among the various populations. The Burqin and Hejing populations had a Hd of 0.419 and 0.467, respectively, and a nucleotide diversity of 0.00047 and 0.00107 at Cytb + CR. These numbers suggest a lower level of genetic variation compared to the rest of the populations. In contrast, the Aktu, Kumul, and Karamay populations exhibited a high level of genetic diversity (Table 1).
The clade F, O. a. adametzi, was shown to have a moderate degree of nucleotide diversity (0.01754 and 0.00106) and a low level of Hd (0.574 and 0.467 at both CR and Cytb + CR, respectively) among the various clades. On the other hand, clade H, O. a. sairensis, exhibited a high-level of genetic diversity in terms of Hn and nucleotide diversity at both CR and Cytb + CR (Table 1).
3.2. Genetic Divergence
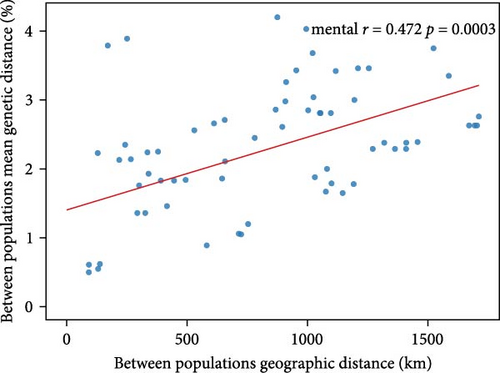
We calculated the genetic distance and FST values between different clades. The genetic distances ranged from 1.21% (between clades B and C) to 4.61% (between clades G and I) for Cytb + CR and from 2.49% to 9.25% for CR only. The FST values varied from 0.53 (between clades E and G) to 0.94 (between clades C and F) for Cytb + CR and from 0.31 to 0.86 (between clades D and C) for CR (see Table 2), indicating relatively high genetic differentiation. The mental test analysis indicated that genetic difference among populations was weakly correlated (r = 0.472, p < 0.01) with geographic distance (Figure 2).
| A | B | C | D | E | F | G | H | I | J | |
|---|---|---|---|---|---|---|---|---|---|---|
| A | — | 0.57/0.61 | 0.77/0.76 | 0.72/0.68 | 0.62/0.52 | 0.80/0.67 | 0.62/0.51 | 0.80/0.77 | 0.72/0.64 | 0.84/0.74 |
| B | 1.27/2.88 | — | 0.75/0.76 | 0.73/0.71 | 0.60/0.49 | 0.78/0.61 | 0.63/0.50 | 0.80/0.78 | 0.71/0.62 | 0.84/0.75 |
| C | 1.43/3.25 | 1.21/2.49 | — | 0.88/0.86 | 0.74/0.60 | 0.94/0.76 | 0.70/0.58 | 0.90/0.88 | 0.79/0.65 | 0.89/0.79 |
| D | 1.79/3.78 | 1.76/3.55 | 2.23/4.70 | — | 0.60/0.45 | 0.85/0.68 | 0.64/0.48 | 0.83/0.77 | 0.75/0.64 | 0.87/0.78 |
| E | 2.27/5.74 | 2.13/5.05 | 2.47/5.61 | 2.05/4.81 | — | 0.66/0.44 | 0.53/0.30 | 0.68/0.48 | 0.62/0.38 | 0.78/0.57 |
| F | 1.74/4.65 | 1.40/3.52 | 1.69/4.22 | 1.84/4.48 | 1.90/5.33 | — | 0.68/0.48 | 0.88/0.69 | 0.76/0.52 | 0.89/0.56 |
| G | 3.28/7.58 | 3.24/7.05 | 3.37/7.53 | 3.23/6.77 | 3.26/7.33 | 3.10/7.56 | — | 0.60/0.52 | 0.71/0.41 | 0.71/0.56 |
| H | 2.32/4.37 | 2.08/3.67 | 2.22/3.85 | 2.22/3.80 | 2.38/4.69 | 1.84/3.91 | 3.38/7.00 | — | 0.52/0.41 | 0.86/0.74 |
| I | 2.47/5.24 | 2.24/4.51 | 2.06/3.84 | 2.48/4.91 | 2.57/5.37 | 1.87/4.40 | 3.34/7.25 | 1.15/2.59 | — | 0.80/0.59 |
| J | 4.17/6.53 | 4.08/6.05 | 3.86/5.50 | 4.40/7.37 | 4.40/7.37 | 3.87/6.33 | 4.61/9.25 | 3.86/5.26 | 3.38/5.51 | — |
The results of the AMOVA analysis, based on the CR sequences, revealed that 47.42% of the total variation was attributed to differences between clades or evolutionary populations, while only 26.62% was due to geographic population differences. However, when the analysis was based on both the Cytb and CR sequences, almost two-thirds of the genetic variation (70.93%) was found among clades, with a decrease in within-population divergence to 17.95% (Table 3).
| Gene | Source of variation | d.f. | Sum of squares | Variance components | Percentage of variance |
|---|---|---|---|---|---|
| Cytb+CR | Among clades | 9 | 1939.121 | 18.30054 Va | 70.93 |
| Among geographic populations within clades | 9 | 168.066 | 2.86799 Vb | 11.12 | |
| Within geographic populations | 92 | 426.183 | 4.63242 Vc | 17.95 | |
| Total | 110 | 2533.369 | 25.80096 | — | |
| CR | Among clades | 8 | 1231.842 | 10.16153 Va | 47.42 |
| Among geographic populations within clades | 16 | 395.978 | 5.56163 Vb | 25.96 | |
| Within geographic populations | 83 | 473.486 | 5.70465 Vc | 26.62 | |
| Total | 107 | 2101.306 | — | — | |
3.3. Phylogeny
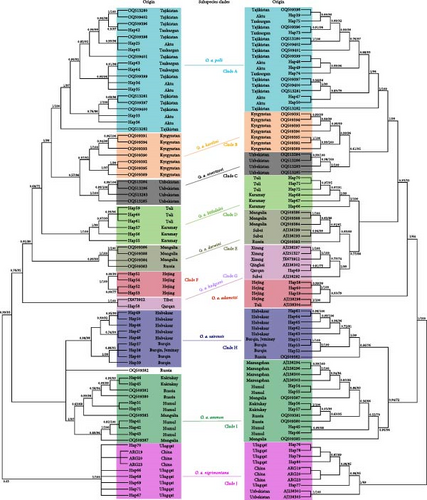
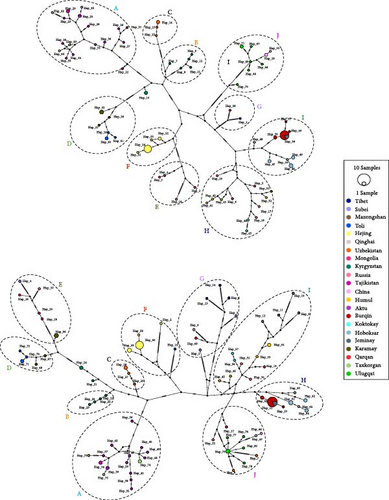
In our phylogenetic analyses, we utilized the CR and Cytb + CR datasets. Upon examination, we found that all sequences in both datasets consistently formed into 10 distinct clades, which we have designated as clade A through clade J (Figure 3). Our samples from Xinjiang were scattered into clades A, D, F, G, H, I, and J. Clade A includes samples from Taxkorgan, Aktu, and Tajikistan, representing subspecies of O. a. polii. Clade D comprises samples from Toli and Karamay, while clade F comprises samples from Hejing alone, representing subspecies of O. a. littledalei and O. a. adametzi, respectively. Samples from Burqin, Hoboksar, and Jeminay form clade H, representing subspecies O. a. sairensis, while samples from Koktokay, Kumul, as well as Gansu, Mongolia, and Russia form clade I, representing subspecies O. a. darwini and/or O. a. ammon. As expected, a sample from Qarqan was grouped with Tibetan samples and an O. a. dalailamae sample from Gansu formed clade G, representing subspecies O. a. hodgsoni. Interestingly, forming a basal clade J, samples from Ulugqat were clustered with samples of O. a. nigrimontana from Uzbekistan (Figure 3). The clustering pattern of haplotypes in the network analyses was consistent with the topology of the phylogenetic trees (Figure 4).
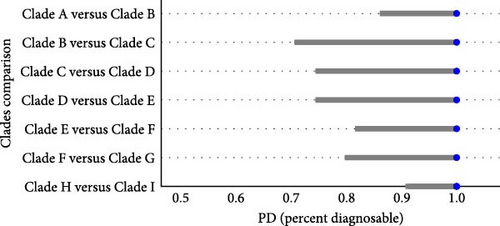
Based on the guideline of Taylor et al. [35] and Archer et al. [34], the dA ranging from 0.004 to 0.02 and PD > 80% are regarded as the boundary for considering a population as a subspecies. In our results, the dA values among the clades A–J ranged from 0.00558 to 0.03426 (Table 4). The smallest dA value was observed between clades I and H, while the largest dA value was between clades D and J. The Random Forest analyses showed that the diagnosability estimates for all comparisons were 100% and the 95% confidence intervals (CI) was at a range 0.7151–0.914 to 1 (Figure 5).
| A | B | C | D | E | F | G | H | I | J | |
|---|---|---|---|---|---|---|---|---|---|---|
| A | — | — | — | — | — | — | — | — | — | — |
| B | 0.00648 | — | — | — | — | — | — | — | — | — |
| C | 0.00900 | 0.00897 | — | — | — | — | — | — | — | — |
| D | 0.01195 | 0.01213 | 0.01802 | — | — | — | — | — | — | — |
| E | 0.01312 | 0.01253 | 0.01779 | 0.01228 | — | — | — | — | — | — |
| F | 0.01292 | 0.01058 | 0.01518 | 0.01532 | 0.01116 | — | — | — | — | — |
| G | 0.01734 | 0.01826 | 0.02156 | 0.01857 | 0.01573 | 0.01728 | — | — | — | — |
| H | 0.01711 | 0.01565 | 0.01565 | 0.01794 | 0.01476 | 0.01582 | 0.01815 | — | — | — |
| I | 0.01695 | 0.01550 | 0.01632 | 0.01740 | 0.01478 | 0.01351 | 0.01646 | 0.00558 | — | — |
| J | 0.03119 | 0.03068 | 0.03064 | 0.03426 | 0.03023 | 0.03019 | 0.02763 | 0.03035 | 0.02745 | — |
3.4. Population Demographic History
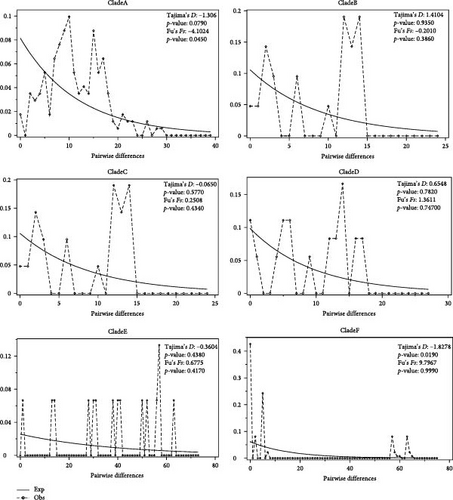
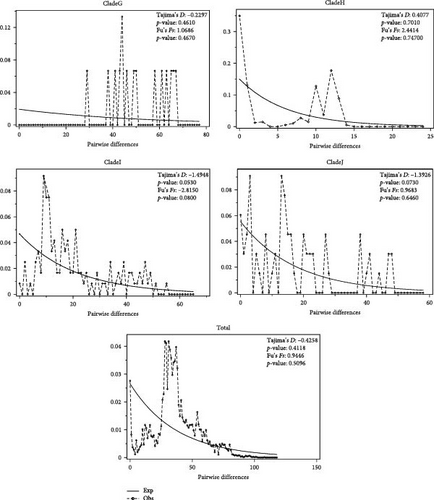
The detection of population expansion was performed at the clade/evolutionary population level. The mismatch distribution analysis of different clades of mtDNA CR was shown in Figure 6. Fu’s Fs and Tajima’s D neural tests were used to detect population expansion. The overall mismatch distribution showed a multimodal distribution and had a nonsignificant Fu’s Fs value and Tajima’s D value for all of the clades, except for Tajima’s D of the clade F (Tajima’s D = −1.8278, p = 0.0190). These results suggest that there was no population expansion and that the population size of all O. ammon evolutionary populations remained relatively stable.
4. Discussion
4.1. Phylogeny and Interspecific Classification
In our analyses, we identified 10 monophyletic clades consecutively named A–J (Figure 3). This is consistent with network analyses results (Figure 4), and the genetic divergence among clades were high (Tables 2 and 3). Our dA and PD estimates (Table 4 and Figure 5) for clade comparison were well within the range of subspecies delimitation [34, 35]. Considering the morphological, ecological niches and distributional range difference between populations [13], we reach the conclusion that these clades represent different subspecies of Argali.
Based on mitochondrial Cytb and CR, we obtained similar results to those of a recent study that used genomic SNP and mitogenomic data [2]. This study found that O. a. ammon and O. a. darwini formed two separate clades, but including samples from both subspecies. This is consistent with previous studies in Mongolia [18, 19], as well as our own findings (Figures 3 and 4). Morphologically, these two subspecies have distinct features, supporting their subspecies rank [13, 38]. Our study also found that samples from Kumul and Koktokay in Xinjiang and Mazongshan in Gansu province belonged to clade I, which is believed to represent O. a. ammon [16, 17]. Similarly, two haplotypes from Subei in Gansu province, three from Mongolia, and one from Russia formed clade E, known as O. a. darwini. These results suggest a wide distribution for these two subspecific populations, even highly likely overlapping in some areas. This also indicates a potential gene flow between the two subspecies. However, the nuclear genomic SNP [2] and mtDNA ND5 [21] analyses placed them in the same cluster, contradicting the previous results. Geist [38] argues that earlier taxonomic studies may have been flawed due to inadequate understanding of seasonal and age-related pelages, as well as invalid taxonomic criteria. Therefore, the subspecific status of these two populations should be further confirmed using comprehensive approaches, such as combining morphology, genome biology, and ecology.
Meanwhile, Dotsev et al. [2] based on genomic data confirmed that O. a. polli, O. a. karelini, and O. a. severtzovi each formed their own monophyletic clades. Our results for these three subspecies align with their findings. Additionally, we also observed monophyletic clades for O. a. littledalei, O. a. adametzi, O. a. sairensis, O. a. hodgsoni, and O. a. nigrimontana. The network clustering results (Figure 4) were consistent with their phylogenetic topologies (Figure 3). The genetic distances and FST values of genetic divergence between these subspecies were higher than those of the previous three subspecies (Table 2, [2]). The morphological characteristics of each of these populations have been deemed sufficient to classify them as distinct subspecies [16, 17, 38]. Combining with the result of dA (Table 4) and PD with Random Forests (Figure 5), our results support the designation of these populations as separate subspecies.
Shi et al. [16], Gao et al. [17], and Zhao et al. [39] have identified the argali population from Altyn-Tagh Mountain and eastern Kunlun Mountain as a subspecies of O. a. dalai-lamae (known as Aerjinshan yazhong in Chinese). However, Abutalip and Feng [13] refer to this population as O. a. hodgsoni, which is considered a synonym for O. a. dalai-lamae. Our phylogenetic tree (Figure 3) and network (Figure 4) analyses show that one sample from Qarqan, located in Altyn-Tagh Mountain, is closely related to argali samples from Qinghai and Xizang provinces [3], supporting the notion of Abutalip and Feng [13]. This allowed us to conclude that morphologically and genetically, argali populations in the Qinghai-Xizang plateau, for example, Tibetan argali, Gansu argali, and Aerjinshan argali, belong to the same subspecies, O. a. hodgsoni, rather than two different subspecies [37].
One sample of Toli from Wu et al. [3] was identified as belonging to O. a. sairensis, but it was found to be clustered with samples of Hejing (also include one CR sequence from Wu et al. [3]), forming a distinct clade F (Figures 3 and 4), which is Lopnur argali O. a. adametzi [17]. Therefore, we have concerns about the accuracy of this sample’s origin, as it is possible that it may have been mislabeled or misidentified. This happened in taxonomic studies of argali, as language barriers and errors in labeling or data have been known to occur [38].
The evolutionary history of argali dates back to 1.72 million years ago [40], when it diverged from O. orientalis/vigne somewhere in Central Asia [3]. Interestingly, populations of argali in close geographic proximity have shown significant divergence, resulting in the formation of distinct subspecies (see Figures 3, 4 and Tables 2, 3). Abutalip and Feng [13] argue that the topography of the distribution area for argali have not been a barrier to genetic exchange between populations. One possible explanation for this is that female argali tend to remain at their natal sites, a behavior known as philopatry. This pattern has also been observed in the matrilineal genetics of other alpine species, such as Capra sibirica [22], where male-biased dispersal has been suggested ([55], under review). Similar to C. sibirica, argali is polygynous, with males usually being larger than females at maturity and competing for females to mate, leading to male dispersal from their natal area. In other words, females tend to stay at their natal sites, causing maternal divergence but facilitating genetic exchange from neighboring populations by males. This is evidenced by gene flow from O. vignei to O. a. severtzovi, which occurred in a sympatric zone and was associated with migrations of males [2].
4.2. Distribution of Argali Subspecies in China
In China, argali populations are mainly distributed in grasslands, deserts, and mountains areas, such as the Tianshan Mountains, Altai Mountains, Kunlun Mountains, Pamir plateau, Qinghai–Tibet Plateau, inner Mongolia Plateau, Junggar basin, and Lop Nur [1]. In this study, we analyzed argali samples from 16 localities in China, including 12 newly collected samples from Xinjiang (Figure 1). Although the identification of some subspecies was consistent among several authors, their distributional ranges somehow were disputed [16, 17, 39]. Genetically, we identified eight subspecies in China, among which seven were in Xinjiang, except from O. a. darwini (Figures 1, 3–5, 7, and Table 4). Based on our current samples and genetic results, as well as previous reports on distribution and classification [3, 16, 17, 39], including information from the IUCN [7], we attempted to designate the range of different subspecies in Chinese territory (Figure 7). However, the boundaries between populations are approximate and require further investigation for confirmation.
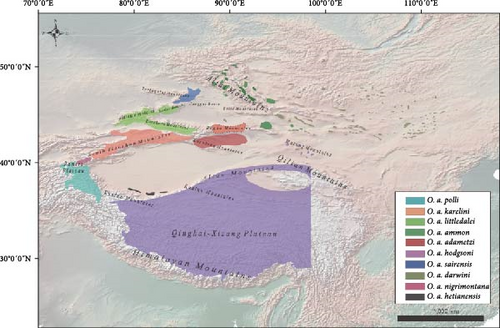
Low levels of genetic variation (Figures 3 and 4) were found in samples collected from Qarqan in the western Altun Mountains, Langkazi in the southern Himalayas of Xizang, Subei in Gansu Province in the Qilian Mountains, and Dulan in Qinghai Province in the southeast corner of the Qaidam Basin [3]. This suggests that O. a. hodgsoni has a high dispersal capacity and is likely widespread throughout the Qinghai–Xizang Plateau. Besides the Mazong Mountains may serve as a sympatric zone for the distribution of O. a. hodgsoni and O. a. darwini. This is supported by the presence of O. a. hodgsoni in the samples from Subei, Gansu Province (Figures 3 and 4).
O. a. karelini are distributed in the south Tian Shan Mountains (from southeastern Kazakhstan and eastern Kyrgyzstan eastward to Urumqi in Xinjiang) and Bogda Mountain range [41]. Based on our current results, argali populations from southeast Kyrgyzstan to west of Hejing are likely the subspecies O. a. karelini in China. The populations in the Bogda Mountain (the dashed area in the Figure 7), though, need to be studied to confirm their subspecies identity.
The authors, both in domestic and international, less disagree about the classification and distributional range of O. a. polli. This subspecies is found in large numbers in the Pamir Plateau, the Hindu Kush Mountains, the Karakoram and the Kunlun Mountains at an altitude of about 4000 m [11, 9, 42]. Boundaries with the Tianshan argali (O. a. karelini) to the northeast are unclear, and their phenotypes are hardly distinguishable. Conservatively estimating in cases, we believe that the Pamir area in the south of the Tianshan Mountains is the habitat of O. a. polli.
The Argali population in the Burqin region has previously been classified as the Junggar subspecies, O. a. sairensis [16, 43]. According to previous studies, the distribution area of the Junggar subspecies ranges from the south of the Kekesen hills in Burqin county and the Mayil hills to the south of Baerluke hills in Yumin county, as well as the basin near the mountains [16, 44]. In our results, the distribution range of the Junggar subspecies within China is just likely in the low hills and basins near Burqin, Hoboksar, and Jeminay (Figure 7). Considering from the geographic perspective, the argali population in the Tarbagatay Mountain range in Kazakhstan may belong to this subspecies, but it requires further investigation for confirmation.
Shi et al. [16] identified the argali sheep in the Alatau, Borohoro, and the east of the Bogda Mountains and west of Kumul as a distinct subspecies, O. a. littledalei. Taking the distributional range by Shi et al. [16] and Zhao et al. [39] into account, we assume that both the Baerluke and the northern Tianshan Mountains are possibly O. a. littledalei’s distributional areas (Figure 7).
The argali found in the Gurenguoleng area of Hejing was previously believed to be O. a. karelini [53]. However, based on our results it was revealed that it is actually the Lop Nur argali, subspecies O. a. adametzi, differing from the O. a. karelini found in Kyrgyzstan. Wu et al. [3] based on samples collected from the Bayanbulak area of Hejing identified this population as Lop Nur argali, O. a. adametzi. Currently, the Lop Nur argali is mainly found in the Xinjiang Kuruktag Mountain range, specifically in the areas of Hoxud, Bostunho, and Yuli counties [39, 45].
According to a previous study, the O. a. ammon distributed in the Altay Mountains of Xinjiang and extended to the near of Mori, and O. a. darwini is mainly distributed in Beitashan Mountain of Xinjiang to Mazong Mountainof Gansu and along the border of China and Mongolia to the north of Wolf Mountains [39]. The distribution of these two subspecies lacks a clear geographical boundary, and our phylogenetic analysis indicates that Kumul and Mazong Mountains may serve as a buffer area for these two subspecies (Figure 3). In a study conducted by Xu [41], the argali population in the Mori International Hunting Ground (Bogda Mountains area) was referred to as Tianshan Argali (O. a. karelini), while Zhang [46] identified the argali near Karamay Mountain and Beitashan Mountain in the southeast as Gobi argali (O. a. darwini). Unfortunately, our study did not include samples from these relevant areas, making it difficult to determine the subspecies identity of argali in the mountainous region west of eastern Tianshan and east of Middle Tianshan. Further research with a larger sample size is necessary to accurately distinguish between these two subspecies.
There is currently no relevant research on distribution of O. a. nigrimontana in China. This subspecies primarily found in the Tashkent area Uzbekistan [47] and the Karatau region of Kazakhstan [48]. Surprisingly, our findings suggest that the argali found in the mountains on the border between China and Kyrgyzstan are O. a. nigrimontana (Figures 3 and 4). According to the phylogenetic analysis results, the approximate range is Ulugqat county, the north of the junction of the Kunlun Mountains and the Tianshan Mountains to the mountainous areas near Artush (Figure 7).
Unfortunately, we were unable to obtain samples from two additional subspecies (Hoten argali O. a. hetianensis and Huabei argali O. a. jubata) that were identified based on morphology by Shi et al. [16] and Zhao et al. [39]. According to Shi et al. [16], the former subspecies is distributed from the west of the Qarqan River to the east of the Yorungkash River, in the foothills and northern slope of the Kunlun Mountains. It is believed that the altitude of 3500–4000 m serves as a geographical barrier for isolation between O. a. hetianensis and O. a. hodgsoni. The latter, on the other hand, has been distributed in eastern Qinghai, southern Gansu, northwest Sichuan, Alxa in Ningxia, and Helan Mountain [39]. However, this subspecies has become locally extinct in these areas [7, 13].
4.3. Genetic Diversity and Conservation Implication
Genetic diversity is a key indicator of the health and viability of a species. Generally, a low level of genetic diversity can lead to reduced fitness and survival in a population [49]. We calculated the haplotype and nucleotide diversities based on CR and Cytb + CR sequences for geographic and evolutionary/clade populations (Tables 1 and 2). The results of mental test show that genetic and geographical distance are positively correlated, indicating that genetic differentiation among populations is closely related to geographical isolation (Figure 2). Most of the geographical groups in different regions showed highHd and nucleotide diversity, indicating high level of the genetic diversity, implying that they had strong adaptability to living environment. This is also evidenced by stable population demographic histories of different populations (Figure 6). We found, on the other hand, that the population named as clade F, O. a. adametzi, has the lowest Hd, while the clade C has the lowest nucleotide diversity, compared to other populations (Table 2). The significantly deviated Tajima’s D negative value implied that the population sudden expansion in the F clade occurred in a far history (Figure 6). These might suggest a risk of genetic loss by inbreeding and genetic drift if the effective populations continue to be decline without appropriate conservation strategies.
Our phylogenetic and genetic structure analyses (Figures 3, 4, 6; Tables 2 and 3) consistently revealed geographically highly structured populations. Each of these phylogenetic populations can be treated as distinct conservation units. Given that the geographic populations in China show marked genetic differentiation, with considerable habitat fragmentation [16], some agricultural and pastoral areas between fragmented habitats should be returned to nature, for example, forestation, to facilitate gene flow between populations. Highways and railways are the main anthropogenic obstacle for middle- and large-sized mammals in China [50]. The linear transport infrastructure is developing at unprecedented speed, including in recently Xinjiang. Hence, the linear transport infrastructure should be modified to provide channels or overpasses for wildlife dispersal, for example, goitered gazelle [23, 52], red deer [51], Siberian ibex [22], as well as argali the in mind, and dispersal channels should also be incorporated into the planning for new construction. In addition, argali populations mainly inhabit transboundary regions between China and other adjacent countries, such as India, Pakistan, Afghanistan, Tajikistan, Kirgizstan, Kazakhstan, Russian Siberia, and Mongolia. It is believed that the border fences have had negative impacts on the migration of wildlife, and this is evidenced in Marco Polo argali, O. a. polii [11], which may lead further genetic differentiation of populations on the two sides of fences. Thus, transboundary cooperation of future scientific research on genetics and genetic and ecological management of wild populations is necessary to facilitate genetic exchange between populations and the ongoing survival of wild ungulates across political borders.
5. Conclusion
Clarifying the taxonomic status of large mammals is of great significance for the protection and utilization of species resources. According to the phylogeny and genetic structure analyses based on mitochondrial DNA, we identified eight subspecies in China, among which seven were in Xinjiang. More sample collection and molecular markers should be applied to their classification research, and a comprehensive evaluation of classification status should be conducted in combination with morphological characteristics, geographical distribution, and other factors to provide more comprehensive and accurate data support for species conservation.
Conflicts of Interest
The authors declare no conflicts of interest.
Author Contributions
Conceived and designed the study: Shamshidin Abduriyim. Fieldwork and samples collection: Wei-Xuan Zhang, Qing-Gang Wei, Shamshidin Abduriyim. Lab experiments: Wei-Xuan Zhang, Qing-Gang Wei. Data analysis: Wei-Xuan Zhang, Qing-Gang Wei, Zhenyuan Cai performed data analysis. First draft: Wei-Xuan Zhang, Shamshidin Abduriyim. Edited the manuscript: Shamshidin Abduriyim, Zhenyuan Cai. All authors approved the final version of this manuscript.
Funding
This study was financially supported by the 2023 award fund of Qinghai Provincial Key Laboratory of Animal Ecological Genomics (QHEG-2024−02), the Hami City 2022 Project of Central Forestry Reform and Development Fund—National Key Wildlife Protection Subsidy (HRDX (2022)−02), and the National Natural Science Foundation of China (32260328).
Acknowledgments
We extend our gratitude to Saypulla Suba in the Forest and Grassland Bureau of Hami city, Abdugini Kerim in the Forest and Grassland Bureau of Arturk county, the Forest and Grassland Bureaus of Kizilsu Kirgiz Aptonom Oblast, Burgin county, Toli county, Qarqan county for their help in field sampling.
Supporting Information
Additional supporting information can be found online in the Supporting Information section.
Open Research
Data Availability Statement
The mtDNA sequences we obtained and analyzed in this study have been deposited in the NCBI databases under accession numbers PQ303838-PQ303879 for mtDNA control region (D-loop) and PQ303880-PQ303921 for mtDNA cytochrome b gene sequences.


