The Mitochondrial Genome Reveals Phylogenetic Relationships and Gene Rearrangement in Brachyura
Abstract
Brachyura represents the focus of species diversity within Decapoda. However, this diversity increases the difficulty of species identification and obscures the natural phylogenetic relationships. Mitogenomes, with their rich phylogenetic signal and evolutionary informatics, provide critical insights into brachyuran systematics. Here, we present 12 newly sequenced mitogenomes spanning 10 families, which exhibit diverse lengths, ranging from 15,320 to 16,135 bp. All circular genomes except Conchoecetes artificiosus (lacking tRNA-S2) encode the typical 37 mitochondrial genes. Meanwhile, we identified unique gene order of Pleistacantha cervicornis and provided preliminary speculation on its hypothetical evolutionary history, which involved four gene inversion and translocation events. Phylogenomic reconstruction revealed: (1) Goneplacidae was closely related to Xanthoidea; meanwhile, Tetraliidae and Trapeziidae show divergence, resulting in the polyphyly of Goneplacoidea and Trapezioidea; (2) freshwater crabs were intimately related to thoracotrematan, and we recommended Potamoidea and Gecarcinucoidea should be classified under Thoracotremata; (3) Extensive mitochondrial gene order (MGO) diversity across Brachyura, with lineage-specific rearrangement patterns serving as phylogenetic markers. Our research offers new insights into the phylogenetic relationships within Brachyura from mitogenome perspective, unraveling the diversity and rearrangement trajectories of MGO in Brachyura.
1. Introduction
Brachyura exhibits remarkable diversity with over 100 families, and more than 7,700 species (WoRMS, https://www.marinespecies.org/aphia.php?p=taxdetails&id=106673) represents the most diverse groups of extant crustaceans [1, 2]. Brachyura has undergone extensive adaptive radiation, with divergence trajectories shaped by heterogeneous ecological pressures across marine, freshwater, and terrestrial habitats [3]. This cladogenic proliferation has generated remarkable morphological diversity that complicates phylogenetic reconstruction [4]. Brachyura occupies diverse ecological niches ranging from shallow intertidal zones (e.g., swimming crabs) to abyssal hydrothermal vents (e.g., Bythograeidae) and high-altitude terrestrial environments [5–7]. However, the exceeding diversity also increases the difficulty of species identification and obscures the natural phylogenetic relationships within brachyurans [8, 9].
Early taxonomic frameworks primarily utilized genital pore positioning to establish three major divisions: Podotremata, Heterotremata, and Thoracotremata [10, 11]. Subsequently, the Heterotremata and Thoracotremata were merged into Eubrachyura [12]. Given the intricate morphological diversity within brachyuran, morphological characters provide limited or diverging phylogenetic information. The advent of molecular systematics in the 1990s introduced single-gene markers (e.g., nuclear 18S rRNA, mitochondrial COI) that provided initial phylogenetic insights of decapod crustaceans [13–17]. However, limitations inherent to single-gene approaches—particularly the constrained phylogenetic signal in nuclear DNA and saturation effects in mitochondrial genes—restricted their utility for lower taxonomic divisions [18]. Benefit from the advancements of sequencing technologies, molecular markers have increasingly become crucial evidence for classifying brachyurans: (1) Multigene phylogenetic analyses redefining major clades (Dromiacea, Raninoida, Cyclodorippoida, and Eubrachyura) [19, 20]; (2) Mitogenome sequencing elucidating complex evolutionary relationships among superfamilies. Nevertheless, persistent controversies surround several key issues: (a) Systematic position of freshwater crabs (Potamoidea/Gecarcinucoidea) [19–22]; (b) Nonmonophyly of traditional groupings (e.g., Grapsoidea/Ocypodoidea) [23, 24]; (c) Conflicting topologies between morphological and molecular datasets [25]. However, multigene combinations and genomes have become more widely used in resolving phylogenetic relationships [26, 27]. In recent years, next-generation sequencing technology and mitogenome analysis have also been applied to molecular phylogeny studies of Decapoda [28, 29].
Mitogenomes have emerged as particularly powerful phylogenetic markers [30–32] due to their unique characteristics: maternal inheritance, absence of recombination, and accelerated evolutionary rates relative to nuclear DNA [33–35]. Beyond sequence-level data, mitochondrial gene order (MGO) rearrangements—including transpositions, inversions, and tandem duplication-random loss (TDRL) events—provide additional phylogenetic signal [36, 37]. MGO is not conserved [38], exhibiting diverse arrangements across Decapoda [31, 39–41], with a specific focus on the infraorder Brachyura [42, 43]. Unique genome rearrangement events shed light on divergent evolutionary trajectories in mitogenomes across different taxa. It has been demonstrated that distinct GOs possess high diagnostic value in defining animal groups at different taxonomic levels [44]. Currently, over 230 brachyuran mitogenomes have been reported (NCBI, https://www.ncbi.nlm.nih.gov/), yet significant sampling biases persist. In comparison to the abundant mitogenome resources in Thoracotremata, the mitogenome data for Heterotremata and Podotremata are relatively scarce. Particularly notable gaps exist in Dromiidae, Leucosiidae, and—families where mitogenomic data are either sparse or entirely absent. Phylogenetic reconstructions constrained by taxonomic underrepresentation or limited molecular signal frequently yield suboptimal topological resolution [19, 21]. Such systematic sampling gaps introduce topological uncertainties, particularly when analyzing groups exhibiting rapid radiation events or extensive homoplasy. Briefly, mitogenome rearrangements serve as crucial markers providing insights into the evolutionary history and phylogenetics of diverse taxa. Comparative analysis of structural changes in mitogenomes reveals the phylogenetic relationships and evolutionary paths among different groups.
In this study, we sequenced the 12 mitogenomes spanning 10 ecologically diverse families. Our data supplemented the vacancy in the public data base and combined the two greatly improved the taxa coverage of the mitogenome data for brachyuran phylogenetic analysis. Using these data, we aimed to (1) reveal the evolution of brachyuran MGO, (2) estimate phylogenetic relationships within brachyurans, and (3) clarify the confusing phylogenetic relationships within the Thoracotremata by including all available representatives of the superfamily.
2. Materials and Methods
2.1. Specimen Collection and DNA Extraction
The specimens used in this study belong to Leucosiidae (Ihleus lanatusand and Tokoyo eburnea), Parthenopidae (Spinolambrus sp.), Calocarcinidae (Calocarcinus habei), Goneplacidae (Carcinoplax sp. and Exopheticus insignis), Oregoniidae (Pleistacantha cervicornis), Epialtidae (Oxypleurodon stimpsoni), Portunidae (Lupocyclus sp.), Lyreididae (Lyreidus tridentatus), Dromiidae (Conchoecetes artificiosus), and Geryonidae (Chaceon granulatus). Total genomes were extracted from the adductor muscle tissue using a DNeasy tissue kit (Qiagen, Beijing, China) following the manufacturer’s protocols.
2.2. Mitogenomes Sequencing and Assembly
After extracting, 1 μg of purified DNA was fragmented to ~500 bp using the Covaris M220 system (Covaris LLC., Woburn, Massachusetts, USA), following the manufacturer’s instructions. These fragmented DNA samples were subsequently used for the construction of short-insert libraries (TruSeq Nano DNA Sample Prep Kit, Illumina) and then were sequenced on the Illumina NovaSeq 6,000 platform (BIOZERON Co., Ltd, Shanghai, China), generating 150 bp paired-end reads length.
Prior to assembly, raw reads were filtered by Trimmomatic 0.39 [45]. This step was performed to remove the reads displaying quality scores below 20 (Q < 20) and the reads containing a percentage of uncalled bases (“N” characters) equal to or greater than 10%. The mitogenomes were reconstructed through a hybrid approach that combined de novo assembly and reference-guided assembly. This reconstruction was achieved through a three-step process. First, the filtered reads were assembled into contigs using MitoZ v2.3 [46], and potential mitochondrial contigs were extracted by aligning against the NCBI mitogenome database. Subsequently, potential mitochondrial contigs were aligned to reference mitogenomes using BLAST v2.8.1+ [47], and manually ordering and connecting of the aligned contigs (>80% query coverage) were carried out, guided by the reference mitogenomes. Finally, MUMmer 3.23 was used to check whether these contigs were circular [48].
2.3. Sequence Analysis and Gene Annotation
The mitochondrial gene annotation was performed using the online MITOS tool (http://mitos.bioinf.uni-leipzig.de/index.py) and GeSeq Web Version (https://chlorobox.mpimp-golm.mpg.de/geseq.html) [49], and the default parameters were applied for the prediction of protein-coding genes (PCGs), transfer RNA (tRNA) genes, and ribosomal RNA (rRNA) genes. The position of each coding gene was determined using BLAST searches against reference mitogenome genes. Using the SnapGene Viewer (https://www.snapgene.com), manual correction of the start and stop codons of genes was performed, guided by the reference mitochondrial genome. The circular mitogenome map was drawn using the CGview tool [50].
The assessment of codon distribution, relative synonymous codon usage (RSCU), and amino acid usage frequency of PCGs was carried out using MEGA11 [51]. Strand asymmetry was evaluated using the following equation: AT skew = (A − T)/(A + T). Additionally, nucleotide composition-based GC skew was determined by (G − C)/(G + C) [52]. The locations and the secondary structure of tRNAs were mainly checked by tRNAscan-SE 1.21 [53].
Principal component analysis (PCA) can effectively find out the “main” elements and structures in the data, remove noise and redundancy, reduce the dimensionality of the original complex data, and reveal the simple structures hidden behind the complex data [54]. The differences and distances between samples can be reflected by analyzing the OTU (97% similarity) composition of different samples. We downloaded a total of 246 available mitogenomes of brachyuran species in combination with the 12 mitogenomes contributed by this study, and PCA was conducted to explore the dataset’s variability. Statistical analysis and figures were performed using the Biozeron Cloud Platform (http://www.cloud.biomicroclass.com/CloudPlatform).
2.4. Phylogenetic Reconstruction
The 246 available Brachyura mitogenome datasets downloaded are seriously unbalanced. For example, most of the mitogenomes are concentrated in the taxa such as Portunidae, Potamidae, and Varunidae. This imbalance in the dataset may affect the reliability and accuracy of the phylogenetic results. Therefore, we filtered the mitogenomes of 152 species of Brachyura from the NCBI database, and phylogenetic analysis was performed in combination with the 12 mitogenomes contributed by this study (Supporting file 1: Table S1). MAFFT 7.313 was used to align the nucleotide sequences and amino acid sequences of 13 PCGs, respectively [55], and Gblock V 0.91 b was used to select for conserved sites in the sequence with default setting [56]. The aligned nucleotide sequences and amino acid sequences of PCGs were concatenated into a dataset. Subsequently, ModelFinder was applied to identify the optimal partitioning scheme for the dataset and determine the best nucleotide substitution model for each partition [57] (Table 1). Maximum likelihood (ML) phylogenies were inferred using IQ-TREE 2.2.0 [58] under Edge-linked partition model for 1000 standard bootstraps, as well as the Shimodaira–Hasegawa–like approximate likelihood ratio test [59]. Bayesian trees were built using MrBayes 3.2.6 [60]. The Markov chain Monte Carlo (MCMC) was set to run for 10 million generations, sampling every 1,000 generations, and the first 25% of the trees were discarded (burn-in), the remaining trees were used to summarize the consensus tree and to estimate the posterior probabilities. Effective sample size (ESS > 200) values for all parameters were checked by Tracer 1.7 (https://www.beast2.org/treeannotator/) to ensure convergence. Phylogenetic trees and gene sequences are graphically edited using iTOL [61].
| Subset | Subset partitions | Partition delineation | Best Model |
|---|---|---|---|
| Partition 1 | atp6_codon1, nad3_codon1 | 1–672\3 6,775–7122\3 | GTR+F+I+G4 |
| Partition 2 | atp6_codon2, cytb_codon2, nad3_codon2 | 2–672\3 3,782–4914\3 6,776–7122\3 | GTR+F+I+G4 |
| Partition 3 | atp6_codon3, atp8_codon3 | 3–672\3 675–798\3 | HKY+F+G4 |
| Partition 4 | atp8_codon1, nad2_codon1, nad6_codon1 | 673–798\3 5,836–6774\3 10,450–10920\3 | GTR+F+I+G4 |
| Partition 5 | atp8_codon2 | 674–798\3 | GTR+F+G4 |
| Partition 6 | cox1_codon1 | 799–2328\3 | SYM+I+G4 |
| Partition 7 | cox1_codon2, cox2_codon2, cox3_codon2 | 800–2328\3 2,330–3009\3 3,011–3780\3 | GTR+F+I+G4 |
| Partition 8 | cox1_codon3, cox3_codon3 | 801–2328\3 3,012–3780\3 | GTR+F+I+G4 |
| Partition 9 | cox2_codon1, cox3_codon1, cytb_codon1 | 2,329–3009\3 3,010–3780\3 3,781–4914\3 | GTR+F+I+G4 |
| Partition 10 | cox2_codon3 | 2,331–3009\3 | GTR+F+I+G4 |
| Partition 11 | cytb_codon3 | 3,783–4914\3 | GTR+F+ASC+G4 |
| Partition 12 | nad1_codon1, nad4L_codon1, nad4_codon1, nad5_codon1 | 4,915–5835\3 7,123–7422\3 7,423–8736\3 8,737–10449\3 | GTR+F+I+G4 |
| Partition 13 | nad1_codon2, nad4L_codon2, nad4_codon2, nad5_codon2 | 4,916–5835\3 7,124–7422\3 7,424–8736\3 8,738–10449\3 | GTR+F+I+G4 |
| Partition 14 | nad1_codon3 | 4,917–5835\3 | GTR+F+ASC+G4 |
| Partition 15 | nad2_codon2, nad6_codon2 | 5,837–6774\3 10,451–10920\3 | GTR+F+I+G4 |
| Partition 16 | nad2_codon3, nad3_codon3, nad6_codon3 | 5,838–6774\3 6,777–7122\3 10,452–10920\3 | GTR+F+ASC+G4 |
| Partition 17 | nad4L_codon3, nad4_codon3, nad5_codon3 | 7,125–7422\3 7,425–8736\3 8,739–10449\3 | GTR+F+I+G4 |
2.5. Gene Order Analysis of Brachyuran Mitogenomes
To ensure accuracy of data, any discrepancies identified during annotation are reannotated using MITOS 2 and GeSeq Web Version for the eukaryotic mitogenome, followed by manual corrections. Prior to the analysis of mitochondrial gene sequence, the linear order Fasta files, which encompassed gene order (GO) information from PhyloSuite [62] for each mitogenome, underwent preprocessing. The main purpose of this step was to eliminate genes missing in one or more species and to maintain a singular copy of duplicated genes. Common Interval Rearrangement Explorer (CREx) was employed to infer the presumed ancestral GOs and relationships among the species within Brachyura [63]. The program adopts an interval-based approach to analyze and model genome rearrangement pathways [64], encompassing key events like transpositions, inversions, reverse transpositions, and TDRLs [36, 37, 65]. The CREx program was used to conduct pairwise comparisons of different GOs, and the most parsimonious gene rearrangement pathway was deduced. To present the diversity of observed and highly variable GOs more accurately and intuitively, we employed the phylogenetic method of the TreeREx 1.85 program to infer the evolutionary pathways of GOs diversity [65]. We followed the website’s recommendations and used the default settings for TreeREx 1.85 analysis (https://siks.informatik.uni-leipzig.de/185-1-TreeREx.html). The TreeREx 1.85 software can map pairwise scenarios computed by CREx along branches, while also inferring putative GOs at internal nodes, facilitating the analysis of putative ancestral states across branches.
3. Results
3.1. Mitogenomes Composition
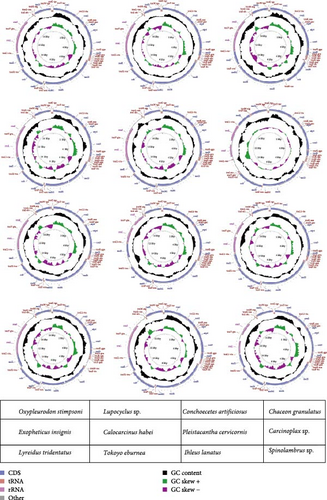
We successfully assembled the complete mitogenome for 12 species representing 10 families within the infraorder Brachyura, aiming to fill critical sampling gaps in underrepresented taxa. All circular mitogenomes ranged from 15,320 to 16,135 bp in length, with C. artificiosus (Dromiidae) exhibiting a truncated genome lacking trnS2 a gene loss phenomenon previously documented in Scyra compressipes through TDRL-mediated rearrangement [66, 67]. The remaining genomes form circular molecules, encoding a total of 37 genes, including 13 PCGs, 2 rRNA genes, and 22 tRNA genes (Figure 1, Table 2), aligning with a common trait observed in numerous other decapod species. Intergenic spacer regions and overlapping regions are commonly observed in the mitogenomes of the 12 species, as indicated in Supporting file 2: Table S2.
| Superfamily | Family | Species | Length (bp) | A (%) | T (%) | C (%) | G (%) | A+T (%) | Atskew | Gcskew |
|---|---|---|---|---|---|---|---|---|---|---|
| Dromioidea | Dromiidae | C. artificiosus | 15,600 | 36.6 | 34.9 | 18.3 | 10.2 | 71.5 | 0.024 | −0.28 |
| Goneplacoidea | Goneplacidae | Carcinoplax sp. | 15,719 | 34.9 | 37 | 17.5 | 10.6 | 71.9 | −0.03 | −0.24 |
| Goneplacoidea | Goneplacidae | E. insignis | 15,592 | 35.3 | 35.4 | 18.9 | 10.3 | 70.7 | −0 | −0.29 |
| Leucosioidea | Leucosiidae | I. lanatus | 15,397 | 34.3 | 38.6 | 16.4 | 10.8 | 72.9 | −0.06 | −0.21 |
| Leucosioidea | Leucosiidae | T. eburnea | 15,320 | 33.6 | 37.5 | 18 | 10.9 | 71.1 | −0.05 | −0.25 |
| Majoidea | Oregoniidae | P. cervicornis | 15,885 | 29.9 | 40.1 | 11.3 | 18.7 | 70 | −0.15 | 0.244 |
| Majoidea | Epialtidae | O. stimpsoni | 15,598 | 35 | 40.6 | 15.1 | 9.4 | 75.6 | −0.07 | −0.23 |
| Parthenopoidea | Parthenopidae | Spinolambrus sp. | 15,363 | 37.6 | 36.4 | 16.9 | 9.1 | 74 | 0.016 | −0.3 |
| Portunoidea | Portunidae | Lupocyclus sp. | 15,653 | 32.1 | 35.2 | 20.7 | 12 | 67.3 | −0.05 | −0.26 |
| Portunoidea | Geryonidae | C. granulatus | 16,135 | 33.2 | 35.9 | 18.6 | 12.2 | 69.1 | −0.04 | −0.21 |
| Raninoidea | Lyreididae | L. tridentatus | 15,723 | 34.2 | 36.2 | 18.7 | 10.8 | 70.4 | −0.03 | −0.27 |
| Trapezioidea | Calocarcinidae | C. habei | 16,036 | 34.2 | 36.2 | 19.4 | 10.3 | 70.4 | −0.03 | −0.31 |
The majority of PCGs in the 12 brachyuran species initiate with standard ATN codons and terminate with TAA or TAG codons. In addition, a few genes have incomplete stop codons as shown in Supporting file 2: Table S2. Truncated codons (T/TA) are commonly detected in invertebrate mitogenomes [68, 69], which are believed to be corrected through post-transcriptional adenosine deamination [70, 71].
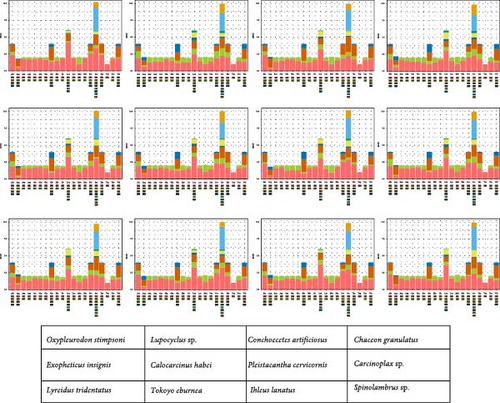
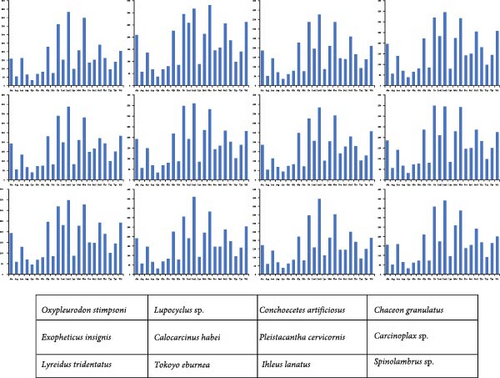
Figures 2 and 3 illustrate the amino acid usage and RSCU for 12 mitogenomes. Amino acids encoded by A + T-rich codon families (Asn, Ile, Leu, Met, Phe, and Tyr) are more frequently utilized compared to those encoded by G + C-rich codon families (Ala, Arg, Gly, and Pro). Extensive evidence supports a widespread preference for A and T nucleotides in metazoan mitogenomes, leading to a bias in the encoding of amino acids [72, 73]. The analysis of RSCU values reveals that the prevailing codons are TTA (Leu), TCT (Ser), GCT (Ala), ACT (Thr), and GTA (Val), indicating an A + T bias at the third codon position (Figure 3). The findings are supportive of the hypothesis positing a potential positive correlation between codon usage preference and AT bias at the third codon position in mitogenomes [74, 75].
3.2. PCA of Basic Mitogenomes Features
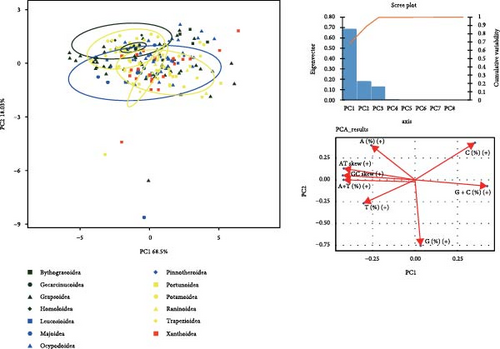
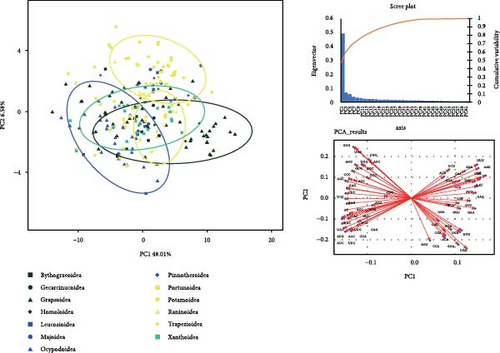
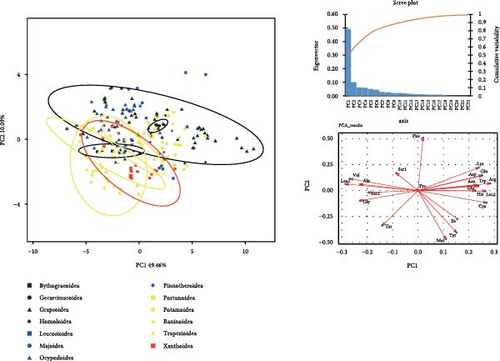
Supporting file 3: Table S3 provides integrated data, including basic composition, RSCU values, and amino acid usage frequencies of 218 mitogenomes covering 13 superfamilies of brachyuran utilized for PCA analysis. The PCA plot in Figure 4 illustrates that Principal Component 1 and Principal Component 2 in all analyses yield high variance explanation, with notable clustering observed among certain data points. The internal data points within Gecarcinucoidea show a pronounced clustering pattern in the analysis based on mitogenome composition (Figure 4a), and the adenine content differentiates Gecarcinucoidea from several superfamilies such as Portunoidea and Trapezioidea. The OTUs in Potamoidea are distinctly clustered, showing differences from groups such as Trapezioidea. The PCA analysis of RSCU values (Figure 4b) reveals a distinct separation between Potamoidea and Ocypodoidea. Additionally, data points within Potamoidea show differences from the majority of Xanthoidea, Homoloidea, and Trapezioidea. Notably, Gecarcinucoidea demonstrated unique genomic architecture, diverging significantly from both deep sea (Bythograeoidea) and intertidal (Portunoidea) lineages in all three feature domains.
3.3. Phylogenetic Analysis
The final alignment datasets for nucleotide sequence and amino acid sequence consist of 10953 bp and 3552 characters, respectively. The optimal partitioning schemes, as determined by ModelFinder, are presented in Table 1. The ML tree and Bayesian inference (BI) tree constructed based on the nucleotide sequence and amino acid sequence data sets obtained almost identical topological structures (Figure 5 and Supporting file 4: Figure S1). The results strongly support the monophyly of the 162 brachyuran species, which cluster into a single branch with absolute support (BS/BPp = 100/1.00). Each major clade within Brachyura, including Dromiacea, Homoloida, Raninoida, and Eubrachyura, is recovered as monophyletic with full statistical support (BS/BPp = 100/1.00). However, Heterotremata did not form monophyletic groups. Instead, freshwater crabs from Potamidae and Gecarcinucoidea, which are classified within Heterotremata, exhibit a close relationship with Thoracotremata, receiving strong support across all analyses (BS/BPp = 65/1.00). At the superfamily level, excluding those represented by only one species, our findings indicate that Bythograeoidea, Gecarcinucoidea, Carpilioidea, Cryptochiroidea, Leucosioidea, Majoidea, Parthenopoidea, Pilumnoidea, Pinnotheroidea, and Potamoidea are monophyletic. In contrast, Calappoidea, Eriphioidea, Grapsoidea, Goneplacoidea, Portunoidea, Trapezioidea, and Xanthoidea display paraphyly or polyphyly. At the family level, the majority of the 36 families included in this study (excluding single-species families) exhibit monophyly. However, several families, including Raninidae, Homolidae, Portunidae, Xanthidae, and Dotillidae, do not form monophyletic groups.

The phylogenetic analysis reveals a cluster comprising Leucosiidae, Calappidae, and Matutidae, with Leucosiidae identified as the sister group to Matutidae, thereby rendering Calappoidea paraphyletic. Additionally, Trapeziidae and Leptodius sanguineus (Xanthidae) form a distinct clade at the apex of Heterotremata, whereas Tetraliidae occupies a more basal position. This configuration leads to the polyphyly of Trapezioidea and Xanthoidea. Moreover, Lissocarcinus arkati is phylogenetically distinct from the branches containing Geryonidae, Ovalipidae, and Portunidae. Instead, it exhibits a closer relationship with Xanthoidea, leading to polyphyly within Portunoidea. Notably, the internal phylogenetic relationships within Grapsoidea and Ocypodoidea continue to exhibit complex and interwoven patterns. Furthermore, P. cervicornis is recovered as the sister taxon to Maja squinado and Maja crispata, whereas Leptomithrax sp. clusters with Damithrax spinosissimus (Mithracidae), resulting in a polyphyletic assemblage of Majidae and Oregoniidae. In contrast, E. insignis and Carcinoplax sp. form a strongly supported monophyletic group representing Goneplacidae, with strong support in all analyses (BS/BPp = 100/1.00).
3.4. GO Rearrangement Analysis
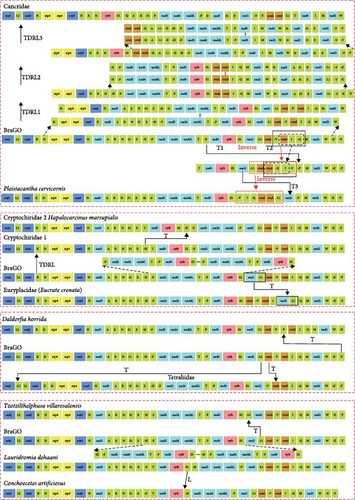
The genes arrangement of mitogenome newly contributed in this study is illustrated in Figure 6. With the exception of C. artificiosus and P. cervicornis, the majority of species exhibit same GO pattern consistent with that of the brachyuran ancestor [76, 77]. However, certain species display notable deviations. O. stimpsoni has essentially the same pattern as its coordinal species, S. compressipes [66], but the later lacks the tRNA-L1 gene. Within the family Parthenopidae, Spinolambrus sp. and Enoplolambrus validus retain the ancestral brachyuran GO, whereas Daldorfia horrida exhibits a transposition of the tRNA-Y gene. Regarding C. artificiosus, aside from the absence of the tRNA-S2 gene, its gene arrangement aligns with that of its phylogenetic counterpart, Lauridromia dehaani. The absence of specific tRNA genes has also been documented in other crustaceans, including Scyra compressipe [66] and is generally attributed to gene rearrangement events [67]. The GO of P. cervicornis has experienced significant modifications, distinguishing it from all GOs currently reported in Brachyura.

Our analysis identified 33 distinct MGO patterns within Brachyura (Figure 5), including a novel gene rearrangement pattern. Using CREx2, we reconstructed the evolutionary trajectory leading to the derived MGO of P. cervicornis, revealing four gene inversion and translocation events from the ancestral brachyuran to P. cervicornis (Figure 7): (1) first gene transposition event occurred between trnP and nad6-cytb-trnS2-nad1-trnL1-rrnL-trnV-rrnS-trnI-trnQ; (2) second gene transposition event is the position exchange of rrnS and trnI-trnQ; (3) the gene-block trnV-rrnS-trnI-trnQ undergone inversion; 4) inversed transposition occurred between trnL1-rrnL-trnV-rrnS-trnI-trnQ and nad1, ultimately generated a unique GO pattern distinct from all documented Majidae configurations (M. squinado, M. crispata, Leptomithrax sp.). Furthermore, CREx2 was used to analyze GOs for which the evolutionary mechanisms had not yet been reported. After excluding duplicated genes present in two Cancridae species, we determined that their GO formation process involved one transposition event and three TDRL events. The evolutionary mechanism of Dotillidae (except Ilyoplax deschampsi, Ilyoplax pusilla and Dotilla wichmanni, which retain the ancestral Brachyura GO), Cryptochiridae1 and Cryptochiridae2 experienced a TDRL event. Notably, evolutionary trajectory of D. horrida and Eucrate crenata involved a gene transposition event. All members within Tetraliidae possesses an identical GO, with a rearrangement between rrnL and trnV occurring after a distant translocation of trnL. In comparison to the ancestral GO of Brachyura, there was a positional swap between nad1 and trnL1 in Pseudothelphusidae (Tzotzilthelphusa villarosalensis).
4. Discussion
While brachyuran mitogenomic resources have expanded substantially in recent years (NCBI, 2024; n > 200), persistent gaps in taxonomic coverage remain, particularly for underrepresented lineages. Current datasets exhibit pronounced sampling biases, with most of sequences derived from Thoracotremata and ecologically accessible groups (e.g., Portunidae swimming crabs), compared to only 3.1% from Podotremata. This taxonomic imbalance severely limits resolution of deep phylogenetic relationships and evolutionary mechanisms. This taxonomic imbalance severely limits resolution of deep phylogenetic relationships and evolutionary mechanisms. To address these limitations, this investigation specifically targeted undersampling lineages, sequencing 12 complete mitogenomes spanning 10 families. Leveraging the most comprehensive brachyuran mitogenome dataset to date, we have constructed phylogenetic trees and delved the relationships of deeper nodes within Brachyura. This work establishes mitogenomic as dual-purpose tools—both phylogenetic monitor and evolutionary trajectory tracer—while highlighting the necessity of strategic taxonomic sampling.
4.1. Mitogenome Characteristics Vary within Brachyuran
The proliferation of mitogenomic resources has catalyzed unprecedented insights into molecular evolutionary patterns across metazoans [78–80]. Employing statistical methodologies, our research undertakes a thorough analysis of the fundamental composition, RSCU, and amino acid usage within mitogenomes. The asymmetrical distribution of nucleotide composition has been observed among various animal populations [81, 82]. Potamoidea exhibits a notably high AT content, reaching up to 73.0%, and displays marked differences in RSCU preferences when compared to several other superfamilies. The amino acid composition of Gecarcinucoidea species exhibits dissimilarity to the preponderance of Brachyura groups, yet aligns with previously reported phylogenetic findings [83, 84]. Freshwater crabs from Gecarcinucoidea and Potamoidea show proximity in PCA analysis and exhibit close phylogenetic relationship, which implies that they might have parallel evolutionary history. The internal data points of Gecarcinucoidea and Potamoidea are highly clustered and separated from other marine lineages, reflecting unique evolutionary trajectory on the mitogenome of these freshwater crabs. Notably, the sequence analysis of mitogenomes from the present brachyuran species reveals that, on the whole, data points for most species are scattered. This underscores the high plasticity and variability inherent in mitogenomes within crab groups [31] and exemplifies trend of convergent evolution in crabs [85, 86].
In the analysis of mitogenomes, PCA serves as valuable tool to identify and characterize hidden intertaxa differential information, providing more comprehensive understanding of the evolutionary differences among mitogenomes. Integrated with phylogenetic analysis, PCA demonstrates reliable results in the comprehensive mitogenome analysis, serving as supplement to the study of mitogenomic evolution [87, 88]. For example, PCA emerges as potent tool for detecting cryptic evolutionary signals, as demonstrated by its successful application in resolving human migration patterns through mitogenome stratification [89]. More importantly, applications of comprehensive mitogenome analysis revealed wealth of evolutionary information contained within mitogenome, highlighting the necessity for comprehensive analysis and development of mitogenomic resources.
4.2. Mitogenome-Based Phylogenetics
In contrast to prior investigations into the molecular phylogeny of Brachyura [84, 90, 91], with higher taxa coverage and robust support for deep nodes, our research provides meticulous scrutiny of the systematic placements of specific superfamilies and families within the contemporary classification framework. Consequently, while acknowledging the inherent constraints of our dataset, we exercise due diligence in drawing definitive conclusions and, based on our findings, propose certain refinements to the existing classification system.
In the systematic analysis by Guinot [10, 11], the position of sexual openings in crabs was established as the pivotal criterion for higher taxonomic ranks, resulting in the subdivision of Brachyura into Podotremata, Heterotremata, and Thoracotremata. With advancement of sequencing technology, molecular markers have gradually become crucial evidence for the classification within Brachyura. Based on molecular markers and fossil evidences, scholars [20, 92] have proposed the use of Dromiacea, Homoloida, Raninoida, and Cyclodorippoida to replace the Podotremata. Accumulating molecular and morphological evidence, including the contributions of this study, underscores the merit of adopting a polyphyletic classification strategy over the traditional Podotremata classification [92–94]. When examining different taxonomic perspectives, it becomes evident that a consensus on phylogenetic relationships remains elusive, particularly regarding the systematic position of Homoloida. Karasawa and Guinot [92, 95] proposed that Dromioidea and Homolodromioidea share sister–group relationship, whereas Homoloidea is sister to the clade (Cyclodorippoidea + Raninoidea + Eubrachyura). The paraphyly of Raninidae, attributed to incorporation of Lyreididae, is also supported by Števčić [96], who classified Lyreidinae as a subfamily of Raninidae. However, fossil studies by Karasawa et al. [97] uphold the independent family status of both Lyreididae and Raninidae. Compared to the phylogenetic trees of Brachyura constructed by [43, 91], this study has augmented the sampling of Dromiacea and Raninoida to mitigate the influence of long-branch attraction on tree topology. Consequently, our phylogenetic analyses offer robust insights into the higher-level relationships within Brachyura, yielding two key conclusions. Firstly, Dromiacea occupies a basal position, strongly supported by nodal values, thereby challenging its traditional grouping within Podotremata. Secondly, Homoloida, Raninoida, and Eubrachyura form a well-supported clade, indicating a closer evolutionary affinity than previously recognized. We recommend the replacement of Podotremata with Dromiacea, Homoloida, Raninoida, and Cyclodorippoida to more accurately reflect the phylogenetic relationships within Brachyura.
Within Eubrachyura, the phylogenetic positions of some taxa and their nonmonophyly are particularly noteworthy. The classification of Goneplacoidea has undergone significant historical revisions [98], rendering it is an anatomically highly specialized group and challenging in establishing clear internal phylogenetic relationships [99]. Based on morphological characteristics, Ng and Manuel-Santos [100] effectively redefined the superfamily and several well-established families, including Vultocinidae, Goneplacidae, Mathildellidae, Progeryonidae, and Conleyidae and critically reviewed the classification composition of Goneplacoidea. Despite these efforts, our findings, combining with the results of [19], indicate that Goneplacoidea remains polyphyletic, with numerous unresolved issues concerning its internal relationships. Prior to our research, only one mitogenome available for Goneplacoidea, limiting the potential for investigating familial relationships within the group through mitogenomic analysis. With the inclusion of two additional mitogenomes from Goneplacidae, our results reveal that Goneplacidae and Euryplacidae do not share close phylogenetic relationship. The current classification of Goneplacoidea is a compromised scheme which is more convenience-driven than reflective of the actual phylogenetic relationships [101]. Thus, reassessment of the superfamily’s classification is warranted, and further comprehensive molecular and morphological data are essential to elucidate its internal phylogenetic relationships with greater precision.
Over the past half-century, significant changes and revisions have occurred in the classification of Trapezioidea in tandem with the major shifts in the classification of Xanthoidea [102, 103]. Based on fossil and male abdominal characteristics, Castro and Schweitzer [104, 105] proposed Trapeziidae and Tetraliidae are closely related. However, the taxonomic status of Tetraliidae remains subject of ongoing debate. Some researchers, citing similarities in carapace and larval morphology, have argued that Tetraliidae should be synonymized with Trapeziidae, whereas others, based on molecular analyses, have supported its distinction as a separate lineage. Given these conflicting perspectives, we recommend that Tetraliidae be formally excluded from Trapezioidea. Furthermore, studies by [19, 106], both the Calappoidea and Eriphioidea superfamilies exhibit polyphyly, consistent with the findings from mitogenome analysis.
The current taxonomic placement of freshwater crabs within Heterotremata—predicated on gonopore positioning (the sixth thoracic segment for females and the fourth walking leg basal segment for males)—exhibits significant phylogenetic incongruence with molecular evidence [107]. However, Von Sternberg and Cumberlidge, based on 121 parsimony-informative adult morphological characters, proposed reassigning Potamidae, Gecarcinucidae, and Pseudothelphusidae to Thoracotremata [108, 109]. Our findings indicate that Potamidae and Gecarcinucidae form a well-supported clade sister to Thoracotremata, corroborating previous phylogenetic studies based on small subunit nuclear rRNA sequences, mitogenomes, and transcriptome data [5, 20–22]. However, these results contradict those of Tsang [19], using six nuclear PCGs and two mitochondrial rRNA genes, recovered Potamonautidae, Potamidae, and Gecarcinucidae as a monophyletic group positioned at the base of the Heterotremata clade, albeit with weak statistical support. Given the robust phylogenetic affinity between Potamidae + Gecarcinucidae and Thoracotremata, we propose their reassignment to Thoracotremata to better reflect their evolutionary relationships.
Within the Thoracotremata, numerous molecular systematic studies [2, 9, 25, 110] have consistently demonstrated that Grapsoidea and Ocypodoidea continue to maintain polyphyly, with complex relationships persisting between these two superfamilies [101]. However, traditionally, morphological studies have classified these superfamilies as monophyletic [12, 111], suggesting the preservation of the “Ocypodoidea” and “Grapsoidea” superfamilies is based more on taxonomic convenience than phylogenetic accuracy. The phylogenetic reconstruction presented in this study, based on a more comprehensive dataset than previous analyses, provides further evidence reinforcing the polyphyly of these groups. Notably, our findings offer new insights into the familial relationships within these superfamilies: Dotillidae + Xenophthalmidae + Camptandriidae form a closely related clade with Grapsidae, while Macrophthalmidae and Varunidae are identified as sister taxa, a result consistent with [80]. In contrast, studies by [4, 43] indicated that Dotillidae (Ocypodoidea) and Sesarmidae (Grapsoidea) were closely related as sister groups. Given the increasing body of molecular evidence, the traditional classifications of Grapsoidea and Ocypodoidea no longer accurately represent their phylogenetic relationships. We propose the following taxonomic revisions: (1) Splitting Grapsoidea and Ocypodoidea by removing Dotillidae, Xenophthalmidae, and Camptandriidae from Ocypodoidea to establish a new superfamily, while reassigning Macrophthalmidae and Varunidae to a revised Grapsoidea; (2) Redefining the core taxa by retaining key representatives of traditional Grapsoidea (e.g., Grapsus, Metopograpsus) and Ocypodoidea (Ocypodidae, Xenograpsidae), while revising the classification of the remaining families. A more comprehensive phylogenetic framework, supported by expanded mitogenomic data, will be crucial in resolving the intricate evolutionary relationships within these groups.
Despite the robust phylogenetic signals provided by mitogenomic analysis, achieving a complete understanding of the phylogeny and evolutionary origins of Brachyura will require extensive taxon sampling across freshwater crabs, Thoracotremata, and heterotreme taxa to reconstruct their systematic relationships.
4.3. Mitogenome GO Evolution
The evolutionary mechanisms of gene sequences such as Corystidae (Jonas distinctus), Dynomenidae (Dynomene pilumnoides), Gecarcinucidae, Mithracidae (Damithrax spinosissimus), and Xenograpsidae have been reported in relevant research [4, 25, 80, 112] and will not be described again here. Unlike the highly conserved mitogenome GO of vertebrates [113], invertebrates exhibit a significantly higher propensity for gene rearrangement, giving rise to various gene rearrangement patterns [114], such as annelids exhibit substantial differences in GO even within the same genus [115]. Our findings indicate that brachyurans exhibit a substantially higher degree of gene rearrangement diversity compared to other decapod crustaceans. While many brachyuran families share relatively conserved and stable gene rearrangement patterns, certain groups, such as Grapsidae and Portunidae, display distinctive and unique rearrangement configurations, suggesting lineage-specific evolutionary mechanisms.
MGO evolution is predominantly driven by tRNA rearrangements, with PCG and rRNA gene repositioning events occurring at significantly lower frequencies [116]. However, akin to the GO dynamics observed in the two Maja species [4], P. cervicornis has undergone extensive rearrangements affecting both tRNA genes and PCGs. Nevertheless, the GO patterns between these species are not identical. The reconstructed evolutionary trajectory of GO suggested that P. cervicornis underwent a complex independent evolution. Furthermore, species within the families Cancridae and Pilumnidae have also exhibited substantial gene rearrangements. [117] examined GOs of three species within Pilumnidae, discovering that each has undergone independent evolution, which serve as pivotal evidence for understanding the evolutionary history of Pilumnidae and divergence from other taxa. Among members of Heterotremata, Cancridae stands out due to its extensive gene rearrangements, accompanied by frequent tRNA gene duplication events. The occurrence of additional tRNA genes generated through gene duplication events is not uncommon in animal mitogenomes and has also been reported in the Potamidae [118]. The special tRNA gene remodeling event reveals that Cancridae has a unique evolutionary history. Additionally, gene rearrangements are notably prevalent within Potamidae, where we identified seven distinct rearrangement patterns. In contrast to previous studies [4, 119], our reconstructed gene rearrangement phylogeny (see Supporting File 5: Figure S2) indicates that the ancestral GO of Potamidae corresponds to the Brachyura GO (BraGO) pattern, rather than the Huananpotamon lichuanense pattern. Notably, GO patterns of Potamon fluviatile and Aparapotamon similium align with the BraGO pattern, leading to the assignment of the ancestral node to BraGO in the reconstruction of ancestral GO patterns. This highlights the impact of dataset coverage on ancestral state reconstructions.
Variations in the evolutionary pathways of MGO can imply the degree of relatedness of phylogenetic relationships within their respective taxa. Although Goneplacidae and Euryplacidae are both classified within the superfamily Goneplacoidea, phylogenetic analyses do not support a close evolutionary relationship between them. Moreover, comparative analyses of gene rearrangements reveal substantial differences in GO between these two families, with E. crenata exhibiting an independent evolutionary pathway. However, given that the current study includes only one representative from Euryplacidae, caution should be exercised when drawing definitive conclusions. Similarly, Tetraliidae and Trapeziidae not only display distant phylogenetic relationships but also follow distinct evolutionary trajectories in terms of GO. Consequently, increasing evidences suggest that the classification system within Trapezioidea may be unreasonable. However, within Thoracotremata, it is worth noting that Macrophthalmidae and Varunidae share a common rearrangement pattern, referred to as MaVaGO, and consistently form a monophyletic group in phylogenetic analyses. Consequently, MaVaGO may represent a synapomorphy [4], challenging the current classification system and defining a separate taxonomic unit encompassing all branches sharing this GO.
Majidae GO, Cancridae GO, MaVaGO, and Xenograpsidae GO exhibit extensive rearrangements across multiple genes; however, the probability of such highly rearranged patterns emerging independently multiple times seems improbable [4]. Additionally, at the most derived positions, we observe the brachyuran ground pattern. This observation underscores the necessity of exercising caution when interpreting MGO as an evolutionary marker. While models of mitogenomic rearrangement can serve as direct evidence for systematic evolution and as distinctive characteristics for taxonomic classification, their application should be approached with prudence. Given the limited evolutionary signal conveyed by GO alone, such analyses should be conducted within a broader phylogenetic framework to ensure robust evolutionary inferences [44].
5. Conclusion
The study presented, for the first time, mitogenome from 12 species, including representatives from Goneplacoidea, Majoidea, and other brachyuran taxa. Except for C. artificiosus, which lacked the tRNA-S2 gene, the remaining 11 mitogenomes conform to the standard circular molecules, containing 13 PCGs, 22 tRNA genes, and 2 rRNA genes. PCA was employed to investigate the compositional characteristics of mitogenomes, revealing that Potamoidea and Gecarcinucoidea form highly clustered groups, distinct from other taxa. Phylogenetic analysis indicated close relationship between Goneplacidae and Xanthoidea, while Tetraliidae and Trapeziidae exhibit divergence, supporting the polyphyly of Goneplacoidea and Trapezioidea. Additionally, this study identified unique GO in P. cervicornis, previously unreported, and provided preliminary speculation on its hypothetical evolutionary history. Combining phylogenetic and rearrangement evidence suggested that Macrophthalmidae and Varunidae are closely related, potentially sharing a common ancestry. Moreover, our findings align with previous studies in demonstrating a close evolutionary association between freshwater crabs and thoracotrematan taxa, supporting the classification of Potamoidea and Gecarcinucoidea within Thoracotremata. This study confirms that MGO in Brachyura exhibits greater diversity than previously recognized, offering valuable markers for taxonomic classification within a phylogenetic framework. Our findings contributed to refining the classification system within the Brachyura and revelation of evolutionary history in Brachyura. Despite mitogenomes contained rich genetic information, more extensive sampling would be necessary to further clarify the phylogenetic relationships and evolutionary origins of the Brachyura.
Nomenclature
-
- NaK:
-
- sodium-potassium-ATPase α subunit gene;
-
- PEPCK:
-
- phosphoenolpyruvate carboxylase gene;
-
- Cox:
-
- cytochrome c oxidase gene;
-
- Atp:
-
- ATP (adenosine triphosphate) synthase gene;
-
- nDNA:
-
- nuclear DNA;
-
- MGO:
-
- mitochondrial gene order;
-
- TDRL:
-
- tandem duplication and random loss model;
-
- tRNA:
-
- transfer RNA;
-
- rRNA:
-
- ribosomal RNA;
-
- PCGs:
-
- protein-coding genes;
-
- PCA:
-
- principal components analysis;
-
- OTUs:
-
- Operational taxonomic units;
-
- RSCU:
-
- Relative synonymous codon usage;
-
- ML:
-
- maximum likelihood;
-
- BI:
-
- Bayesian inference;
-
- BS:
-
- bootstrap;
-
- BPP:
-
- posterior probability;
-
- GO:
-
- gene order;
-
- BraGO:
-
- Brachyura gene order;
-
- MaVaGO:
-
- macrophthalmidae gene order and Varunidae gene order;
-
- ESS:
-
- effective sample size.
Ethics Statement
The authors have nothing to report.
Consent
The authors have nothing to report.
Conflicts of Interest
The authors declare no conflicts of interest.
Author Contributions
D.M.K., Z.B.G., and X.Z.L. conceived and designed the study. D.M.K. and Z.B.G. analyzed and interpreted the data. D.M.K. wrote the manuscript draft. X.Z.L. provided funding support. All authors read, revised, and approved the final manuscript.
Funding
This work was supported by the National Natural Science Foundation of China under grant number 41876178 and 42176114.
Acknowledgments
Samples were collected onboard of R/V “Jiageng” and “Xiangyanghong 03” implementing the open research cruises NORC2019-06, NORC2020-05, NORC2020-06, NORC2021-06 supported by NSFC Shiptime Sharing Project (project number: 42049906, 41876178). We are grateful to all the scientists and crew of the cruises, especially to Dr. Wang jinbao, Dr. Xu Yong, Dr. Fang Xuefeng, and Zhang Qi for their help in the collection of the specimens. Special thanks are expressed to Dr. Yuan Ziming, who help us identify the specimens.
Supporting Information
Additional supporting information can be found online in the Supporting Information section.
Open Research
Data Availability Statement
The data that support the findings of this study are available from the corresponding author upon reasonable request. The data presented in the study are deposited in the GenBank repository (https://www.ncbi.nlm.nih.gov), accession numbers PQ300086-PQ300097.


