Integrating Spatially-Explicit and Genetic Analyses to Identify Conservation Priorities for Bufo eichwaldi (Amphibia: Anura) in the Hyrcanian Forest
Abstract
Bufo eichwaldi (Amphibia: Anura) is a toad species endemic to the Hyrcanian forests of northern Iran and southeastern Azerbaijan, increasingly threatened by anthropogenic pressures, underscoring the urgent need for conservation measures. We assessed the genetic diversity, population structure, and potential distribution of B. eichwaldi using molecular analyses and Species Distribution Modeling in order to inform management plans for the species. We analyzed two mitochondrial gene fragments (16S rRNA and D-loop) and one nuclear gene (Recombination activating gene 1), totaling 1865 bp, in 23 individuals from four populations. Our genetic analyses revealed high haplotype diversity (0.984) and significant genetic differentiation (FST) among populations, with the Azerbaijan population showing a genetic distance of 1.85%–2.04% from Iranian populations in the D-loop gene fragment. Genetic results support the hypothesis that B. eichwaldi recently expanded into the Hyrcanian forests after the last glacial maximum (LGM). Species distribution models calibrated using maximum entropy (MaxEnt) under average current climatic conditions (1970–2000) were projected to the Mid-Holocene (6 Kya) and LGM (21 Kya), as well as on 256 time slices of 10 ky BP to assess historic habitat stability. Our models showed good predictive accuracy, with the most influential environmental variable being precipitation of the wettest month (50.1%), followed by temperature annual range (39.7%). Suitable habitats for B. eichwaldi have become increasingly available in the Hyrcanian region after the LGM, in agreement with genetic evidence of a recent range expansion into these forests. This study highlights the value of integrating genetic and ecological data to inform conservation strategies for B. eichwaldi.
1. Introduction
Eichwald’s Toad Bufo eichwaldi [1] is an endemic toad species inhabiting the Hyrcanian forests, whose distribution is restricted to southeastern Azerbaijan and northern Iran, in the lowland and mountain forests of the Talysh, Alborz [1–5]. Life history traits, abundance, and behavior of this species are little known and require more research. A previous study used species distribution models (SDMs) [6] to assess habitat suitability for B. eichwaldi, highlighting the species’ vulnerability and the importance of understanding its ecological requirements [7]. Another study predicted the distribution and assessed the conservation status of B. eichwaldi in Azerbaijan, providing information on the species’ habitat preferences and conservation needs [8]. Regarding genetic data, the first karyological study of B. eichwaldi was conducted in Mazandaran Province, Iran, and produced baseline data that can be useful for future population and conservation genetics studies in the species [9]. Finally, another study used SDMs to investigate the response of Eichwald’s Toad to global warming, suggesting that its distribution range in the southern Caspian Sea has experienced a contraction due to climate change and human interference [10].
Recent research has revealed the important role of environmental conditions in shaping patterns of genetic structure [11, 12]. In this context, SDMs coupled with genetic data are effective tools for understanding evolutionary processes and resolving issues in the field of biodiversity conservation [13]. Moreover, the combination of genetic diversity assessments and SDMs offers a robust framework for addressing conservation challenges derived from ecological and climatic changes [14]. By understanding both the ecological requirements of species and their genetic structure, conservationists can develop more effective strategies to protect biodiversity in an era of rapid environmental change. This integrated approach not only aids in preserving individual species but also supports broader ecological resilience.
While specific studies on the molecular phylogenetics of B. eichwaldi are sparse, research on other species in this genus has utilized genetic markers to explore evolutionary relationships among species in the region. These studies have relied on sequencing a few mitochondrial and nuclear genes, which can provide insights on the genetic diversity and phylogeography of related toad species, potentially offering indirect information relevant to B. eichwaldi [1, 8, 15]. The genetic data obtained from karyotype and molecular analyses can be instrumental in informing conservation strategies for B. eichwaldi. Understanding genetic diversity is crucial for assessing the resilience of populations to environmental changes and for developing effective management plans to protect this species in its natural habitat [4, 9, 16]. These genetic and molecular studies are essential for enhancing our understanding of B. eichwaldi’s biology and informing conservation efforts aimed at preserving this species in the biodiversity-rich Caspian region. Genetic analyses help prioritize which populations are most critical for conservation efforts based on their genetic diversity and adaptive potential. Populations with high diversity may be prioritized for protection or restoration efforts, while those with low diversity may need interventions like gene flow augmentation [17]. Also, phylogenetic analyses and haplotype networks enable the identification of distinct management units within a species. Understanding and delineating these units helps in designing targeted conservation strategies that consider the unique genetic makeup of each population, thereby enhancing the effectiveness of conservation actions [18, 19].
The diverse habitats along the Caspian coast, including the ancient Hyrcanian forests, wetlands, and river systems, contribute to the region’s biological richness [20]. However, increasing anthropogenic pressures such as pollution, habitat destruction, and overfishing threaten this unique biodiversity spot, highlighting the urgent need for protective measures to safeguard the species and ecosystems present in this vital area [20]. These studies collectively underscore the need for further research on B. eichwaldi’s natural history, particularly in terms of its life history traits, ecological requirements, and genetic diversity, which are crucial for effective conservation planning.
Our study integrates SDMs and genetic information obtained from three gene fragments (two mitochondrial genes: 16S rRNA and D-loop, and a nuclear gene: recombination activating gene 1 [RAG1]), to (1) assess the genetic diversity of B. eichwaldi, (2) model its distribution, and (3) inform conservation strategies for this species in the biodiversity hotspot of the southern Caspian Sea, where it faces threats from climate change and habitat degradation. In general, the studies conducted on this species are largely fundamental, and an applied (conservation) perspective has been neglected. In this study, we investigated the population dynamics and relationships of four populations of B. eichwaldi across its range, and modeled changes in suitable areas for the presence of the species to determine whether conservation actions are required to support their long-term viability. Our results represent a cornerstone for in situ conservation initiatives targeting the species and its habitats, but also to raise public awareness about current threats to the endemic biodiversity in the region.
2. Materials and Methods
2.1. Fieldwork and Molecular Analyses
Between January 2022 and February 2024, we collected tissue samples from four populations of B. eichwaldi: three located in Iran: Gharn Abad, Ghaem Shahr, Lahijan, and one in Azerbaijan (Lerik) (Figure 1 and Table S1). These populations are separated by geographical distances of about 150 km, and spread over most of the range of the species (Figure 1). The four localities host large toad populations, and many adults can be observed during the breeding season (February and March), often road-killed by passing vehicles. We obtained tissue samples by clipping a toe from each sampled individual, a method that is minimally invasive and allows for effective genetic analysis without significantly harming the animals [21]. Following the sampling procedure, all individuals were released back into their original habitats. The collected samples were preserved in 96% ethanol and stored at −20 °C until further analysis.
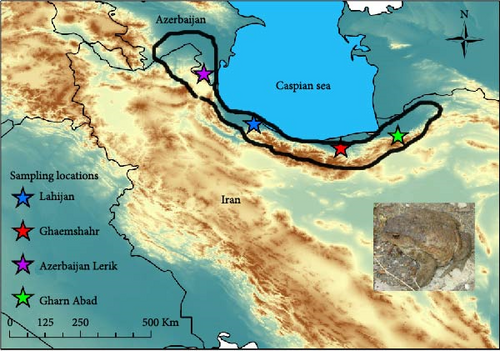
A total of 23 samples were collected from the four studied populations (Gharn Abad: six samples, Ghaem Shahr: seven samples, Lahijan: six samples, and Azerbaijan Lerik: four samples). Genomic DNA was extracted from these samples using the salt extraction method, as described by Aljanabi and Martinez [22], which is effective for amphibian tissues. To amplify mitochondrial genes 16S rRNA and D-loop, as well as the nuclear gene RAG1, specific primers were used (Table 1). The D-loop gene fragment was selected because of its higher polymorphism, and the other more conserved gene fragments were selected to provide robust resolution of deeper nodes in the phylogenetic tree.
| Gene fragment | Primer name | Primer sequences | PCR conditions | References |
|---|---|---|---|---|
| 16S rRNA | 16SL | 5′-CGCCTGTTTATCAAAAACAT-3′ |
|
[23] |
| 16SH | 5′-CCGGTCTGAACTCAGATCACG-3′ | [23] | ||
| D-loop | Bu_15971F | 5′-GAGCCTTCCCTTGGTTTAAGAGTA-3′ |
|
[24] |
| Bu_16582R | 5′-CCAGGTTAAGGTCTTTAAGGTACCAG-3′ | [24] | ||
| RAG1 | Mart FL1 | 5′-AGCTGGAGYCARTAYCAYAARATG-3′ |
|
[25] |
| AmpRI | 5′-AACTACGCTGCATTKCCAATRTCACA-3′ | [25] | ||
Polymerase chain reactions (PCRs) were run in a total volume of 25 µL (including master mix for 10 µL [composition of 0.2 units/μL Ampliqon Taq DNA polymerase, buffer and 0.4 mM of each dNTP)], water for 10 µL, forward and reverse primers for 2 µL and DNA sample for 3 µL), and PCR products were subsequently sent for external sequencing using the Sanger method to Pishgam Company (Tehran, Iran). PCR conditions for each DNA fragment are presented in Table 1.
2.2. Molecular Phylogenetic Reconstruction
Sequences were visually checked using BioEdit v. 7.0 [26] and aligned with ClustalW, also implemented in BioEdit v. 7.0. To establish a phylogenetic framework for our analyses, we selected Bufo gargarizans as an external outgroup to root the tree [25]. We also used sequences from GenBank of other species which, with B. eichwaldi, form the Bufo bufo species group, including B. bufo and B. verrucosissimus (Table S1) [24]. We used sequences from species that are geographically and phylogenetically closer to B. eichwaldi, but using the sequences of other species, such as Bufo spinosus, is not acceptable, because it is distant from our focus of study. Uncorrected genetic distances among populations of B. eichwaldi were calculated for the D-loop and 16S gene fragments using MEGA 11 [27]. We assessed evolutionary models and selected the best-fitting model using Model Test 3.7 [28], based on the akaike information criterion. The chosen models for each gene were as follows: 16S: TrN+I, D-loop: GTR+I+G, and RAG1: K81uf+I. For downstream molecular phylogenetic analyses, we used maximum likelihood (ML) and Bayesian Inference (BI) methods on concatenated Phylip and Nexus files totaling 1865 bp. The ML analysis was conducted using RAxML 7.4.2 [29], implemented within RAxMLGUI 1.3 [30], applying the GTR+I+G model with default settings. For BI analyses, we employed MrBayes 3.2.1 [31], running 100 million generations sampling every 1000 generations and applying a 25% burn-in threshold to discard the initial trees.
2.3. Population Genetic Analyses and Haplotype Network
To assess population genetic structure, we focused on the most variable gene, the D-loop gene fragment (556 bp). We performed population genetic analyses using DnaSP v. 5.0 [32] to calculate haplotype diversity indices.
Two levels of genetic variation (within populations and among populations) were determined by Analysis of Molecular Variance (AMOVA) while assuming Hardy–Weinberg equilibrium in the populations and performing 999 permutations to assess statistical significance. Pairwise population differentiation (PhiPT) was calculated with software GeneAlEx 6.5 [33]. These indices are critical for uncovering population structure in B. eichwaldi in the Hyrcanian forest [26].
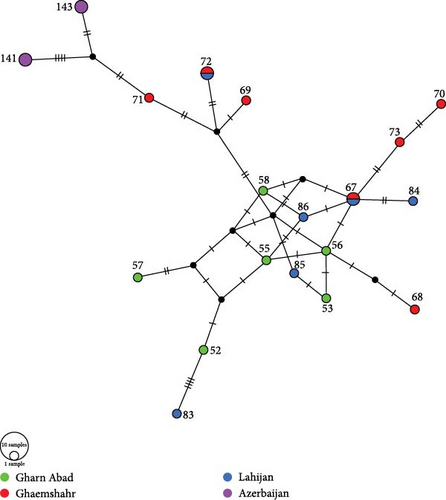
A haplotype network was constructed based on the Median Joining algorithm using PopArt 1.7 [34], allowing for a visual representation of genetic relationships among haplotypes in the populations studied.
2.4. Modeling of Potential Distribution
2.4.1. Species Records, Climate Data, and Variable Selection
We compiled a dataset containing 126 unique georeferenced records of B. eichwaldi obtained during our fieldwork, but also added further occurrence points deposited in the Global Biodiversity Information Facility [35] and others reported in the literature [8, 10, 16]. All records were visually inspected in ArcGIS to identify potential outliers or georeferencing errors. The dataset was spatially rarified to a minimum distance of 12 km, equaling approximately a minimum distance of three grid cells of the environmental variables (see below) using the R package spThin [36], resulting in 31 records used for model calibration, covering the entire geographic range of the species.
We downloaded layers for current climatic conditions (1970–2000) from WorldClim.org v. 2.0 with a spatial resolution of 2.5 arcmin (4 km) [37]. These layers result from spatial interpolations based on weather station data across a target temporal range of 1970–2000 and remote sensing information. To avoid redundancy in the information provided in these climatic layers, we conducted a correlation analysis to test for multicollinearity using Spearman rank correlations following the procedure described in Amiri et al. [38]. Among pairs of variables with correlation coefficients of ρ2 < 0.75, we kept only one variable. The final data set comprised temperature annual range (BIO7), mean temperature of wettest quarter (BIO8), mean temperature of driest quarter (BIO9), and precipitation of wettest month (BIO13).
To quantify historical fluctuations in the potential ranges of the study species we followed two different approaches: (1) we used spatially downscaled global circulation model outputs as described in [39] for the time slices in the Mid-Holocene (6 ky BP) and at the last glacial maximum (LGM; 21 ky BP) as unweighted ensembles based on palaeoclimate simulations following the r1i1p1 ensemble from the PMIP3 project (Paleoclimate Modeling Intercomparison Project Phase III, https://pmip3.lsce.ipsl.fr/; [40]). Mid-Holocene climate layers were estimated based on 11 scenarios (MRICGCM3, MPI-ESM-P, MIROC-ESM, IPSL-CM5A-LR, GISS-E2-R, FGOALS-g2, CSIRO-Mk3 l-1-2, CSIRO-Mk3-0, CNRM-CM5, CCSM4, and BCC-CSM1), while seven scenarios were available for the LGM (MRI-CGCM3, MPI-ESM-P, MIROC-ESM, IPSL-CM5A-LR, FGOALS-g2, CNRM-CM5, and CCSM4). As an alternative climate data set, we used Oscillayers [41], representing 256-time slices in steps of 10 ky within the Pleistocene.
2.4.2. Species Distribution Modeling
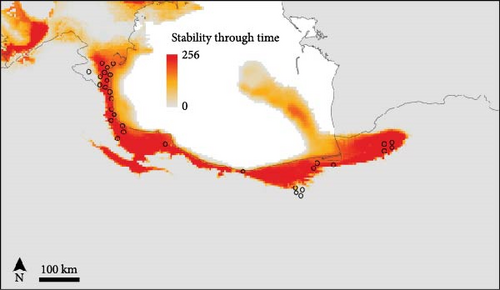
To develop the SDMs, we used the presence-pseudoabsence algorithm maximum entropy (Maxent) vers. 3.4.4 [6, 42, 43]. As environmental background for model calibration, we selected an area defined by a minimum convex polygon enclosing all species records, which was spatially buffered by 10 km. Maxent may benefit from extensive model optimization [44]. Therefore, we followed the procedure described by P. Ginal, W. C. Tan, and D. Rödder [45] to identify the most suitable settings of the regularization parameter (from 0.5 to 2.5 in 0.1 steps, 5 and 10) and combination of feature classes (L, LQ, LH, QH, LQH; L = Linear, Q = Quadratic, and H = Hinge) using a customized script and the relevant functions of the ENMeval package [46] for R. This package acts as an interface passing different combinations of settings to MaxEnt and summarizing the results. For each of the 115 combinations, we computed 25 models using a data partition strategy with 80% records used for model training, resulting in 2875 models. The optimal settings based on the akaike information criterion corrected for small sample size were a regularization parameter of 2.2 and linear and quadratic features. For final model training, species records were split 100 times into 20% record sets used for model testing via the area under the receiver operating characteristic curve (AUC) [47] and the true skills statistic (TSS), and the remaining 80% were used for model training applying a bootstrap procedure. AUC ranges from 0 to 1, where AUC scores of 0.5 indicate a no better than random model discrimination ability between presences and pseudoabsences, while scores close to 1 indicate a perfect discrimination ability. TSS scores range from −1 to +1, with scores of 0 indicating a performance no better than random and scores close to +1 indicating perfect discrimination. The average prediction across all 100 replicates was subsequently projected into the geographic space using the clog-log output format. The final prediction was then converted to a binary presence-absence map using as threshold a 10% omission criterion. Areas characterized by climatic conditions beyond the training range of the models were identified using multivariate environmental similarity surfaces [48]. To estimate the stability of potentially suitable habitat patches through time, we overlaid all potential distributions as projected onto the Oscillayer dataset.
3. Results
3.1. Population Genetics and Molecular Phylogenetic Results
The final concatenated dataset for this study comprised two mitochondrial gene fragments, 16S (570 bp; variable sites (V) = 44, parsimony informative (Pi) = 36), and D-loop (556 bp; V = 160; Pi = 135), along with one nuclear gene fragment, RAG1 (739 bp; V = 19; Pi = 16), totaling 1865 bp. Among these, D-loop exhibited the highest variability, while RAG1 showed the lowest. The high haplotype diversity in the D-loop gene fragment (0.984) indicates that there is a very high probability of observing two different haplotypes within populations of B. eichwaldi (Figure 2). The Azerbaijan population showed a genetic distance of 1.7%–2.2% from Iranian populations for the D-loop gene fragment (Table 2). The AMOVA indicated that 60% of the overall genetic variation was attributed to differences within populations of B. eichwaldi, which is notably greater than the 40% variation observed between populations, as outlined in Table 3. The average PhiPT value and gene flow (Nm) among populations were 0.396 (p < 0.001) and 0.762, respectively.
| Locality | Gharn Abad | Ghaem Shahr | Lahijan | Lerik |
|---|---|---|---|---|
| Gharn Abad | — | 0.31 | 0.27 | 0.56 |
| Ghaem Shahr | 0.95 | — | 0.11 | 0.34 |
| Lahijan | 0.74 | 0.97 | — | 0.48 |
| Lerik | 1.85 | 2.04 | 1.88 | — |
| Source of variation | DF | SS | MS | Est. var. | % | PhiPT |
|---|---|---|---|---|---|---|
| Among populations | 3 | 31.466 | 10.489 | 1.456 | 40% | 0.396 ∗∗ |
| Within populations | 19 | 42.143 | 2.218 | 2.218 | 60% | |
| Total | 22 | 73.609 | — | 3.674 | 100% |
- Note: %, percentage of total variance contributed by each component and significance of variance (p-value); ∗∗p < 0.001.
- Abbreviations: DF, degrees of freedom; Est.Var., estimated variance component; MS, mean square deviations; SS, sum of squares.
The pairwise PhiPT values offered insights into genetic differentiation among populations. The most significant differentiation (0.667) was noted between the Lerik and Gharn Abad populations, while the least differentiation (0.018) occurred between the Gharn Abad and Lahijan populations, as summarized in Table 4.
| Population | Gharn Abad | Ghaem Shahr | Lahijan | Lerik |
|---|---|---|---|---|
| Gharn Abad | — | — | — | — |
| Ghaem Shahr | 0.174 | — | — | — |
| Lahijan | 0.018 | 0.061 | — | — |
| Lerik | 0.667 | 0.594 | 0.600 | — |
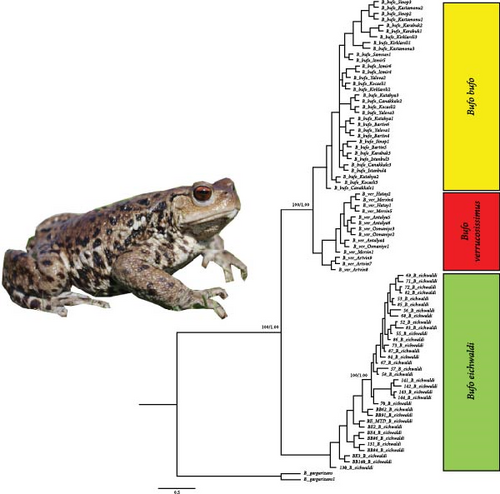
The Azerbaijan population of B. eichwaldi and the Iranian populations show mixed branches in the molecular phylogenetic tree, but the genetic distance of the Azerbaijan population is higher than the other populations in Iran. These evidences suggest the distinct genetic structure of B. eichwaldi through its distribution range and a monophyletic group.
3.2. Species Distribution Modeling
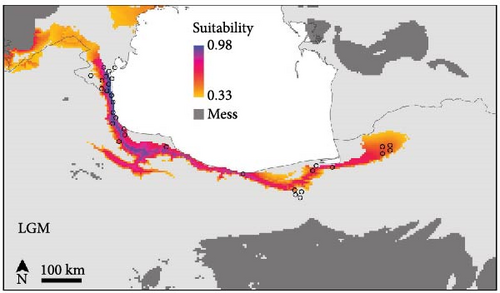
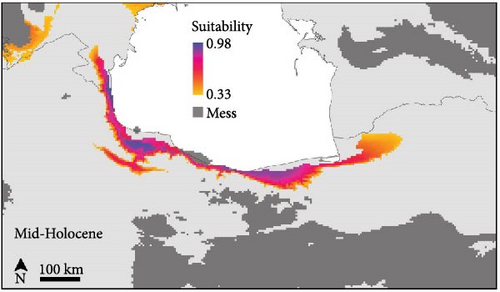
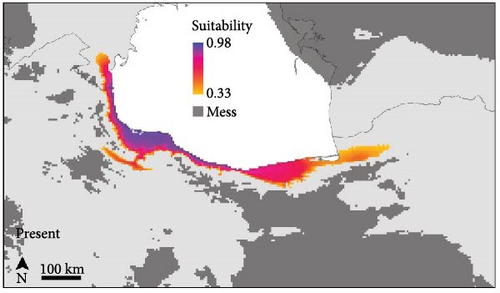
The SDMs achieved an average AUC value of 0.832 and an average TSS score of 0.46, indicating good predictive accuracy. The potential distribution of B. eichwaldi was projected on climatic conditions representing the LGM (21 Kya), Mid-Holocene (6 Kya), and current climatic conditions (1970–2000) (Figure 3). The results suggest that suitable habitats for B. eichwaldi have become increasingly available in the Hyrcanian region after the LGM, expanding from a still interconnected stripe of suitable habitats within the Hyrcanian region north and southwards. Within the north-western part of the species’ range, the potential distribution is less stable, suggesting repeated fragmentation and expansion. Projections on the Oscillayers data set representing 256 time slices in intervals of 10 ky BP show similar patterns, with less stable environmental suitability in the species’ north-western range (Figure 4). The most influential environmental variable contributing to the model was precipitation of wettest month (BIO13, 50.1%). This indicates that the amount of precipitation during the wettest month is a critical factor in determining the species’ potential distribution. The second most important variable was temperature annual range (BIO7, 39.7%). This variable represents the difference between the maximum and minimum temperatures throughout the year and suggests that B. eichwaldi is adapted to a specific range of annual temperature fluctuations. Other important variables included the mean temperature of wettest quarter (BIO8, 9.5%) and mean temperature of driest quarter (BIO9, 0.7%). These variables highlight the significance of temperature during the wettest and driest periods of the year in shaping the species’ potential distribution.
4. Discussion
The Eichwald’s Toad is an endemic species in the Hyrcanian forests, and the high haplotype diversity (0.984) observed across populations indicates significant genetic variation, which is crucial for the species’ resilience to environmental changes and long-term survival [21]. The high genetic differentiation between the Azerbaijan and Iranian populations for the D-loop gene fragment suggests limited dispersal abilities and the presence of geographic barriers restricting gene flow between populations [49]. The mixed genetic structure within the Iranian populations may be attributed to the presence of dispersal corridors that facilitate gene exchange [25]. These patterns of historic range stability in Iranian populations and less stability towards Azerbaijan are well reflected in historic range dynamics (Figures 3, 4). The molecular phylogenetic tree (Figure 5), constructed using both ML and BI approaches, confirmed the monophyletic status of B. eichwaldi, consistent with previous phylogenetic analyses [5]. The low genetic distances among Iranian populations suggest either a recent range expansion or the presence of selective pressures acting on the species. This may support the hypothesis that B. eichwaldi has expanded into the Hyrcanian forests following the LGM. This expansion may have been facilitated by the increasing availability of suitable habitats in the region postLGM.
The species distribution modeling results indicate that suitable habitats for B. eichwaldi have expanded from smaller, but still connected, suitable habitats within the Hyrcanian region since the LGM (Figures 3, 4), which is consistent with population genetic structure results. This finding aligns with previous studies that have highlighted the impact of climatic changes on amphibian distributions in this region. For instance, Kidov and Matushkina [8] modeled the distribution of B. eichwaldi in Azerbaijan, identifying annual precipitation and environmental habitat heterogeneity as significant factors in shaping the species’ potential range. Our models identified precipitation of wettest month (BIO13) as the most influential variable, emphasizing the importance of hydrological factors in determining suitable habitats for amphibians.
Our models also highlight the importance of precipitation patterns, particularly the variable precipitation of wettest month (BIO13), in determining habitat suitability for B. eichwaldi. These findings are consistent with previous studies that have documented postglacial range expansions in other species inhabiting the Hyrcanian forests [38]. The IUCN [50] Red List currently categorizes B. eichwaldi as Vulnerable, with a declining population trend and a fragmented distribution within a range of approximately 17,000 km2. The genetic and ecological data generated in this study underscore the need for targeted conservation efforts to protect this species and its habitat by promoting public awareness. The Hyrcanian forests serve as critical refugia for B. eichwaldi and other endemic species, and their preservation is essential for maintaining biodiversity in the region [9]. Kidov and Matushkina [8] identified threats to B. eichwaldi populations, including habitat destruction and contamination of breeding ponds. The current study reinforces the need for conservation strategies that focus on protecting and restoring these critical habitats and as well as regions with high densities of toads (like our sampling localities). These localities are not situated within protected areas, but future-projected SDMs [10] indicate that habitat suitability for the species may contract in these high-density regions. The identification of key environmental variables influencing habitat suitability can guide conservation efforts, ensuring that areas with high potential for B. eichwaldi are prioritized for protection. The modeling of past and present distributions provides a baseline for future projections under changing climatic conditions. The findings from this study suggest that while B. eichwaldi may find new suitable habitats; careful monitoring and proactive conservation measures will be essential to mitigate the impacts of climate change and habitat degradation.
5. Conclusion
This study highlights the importance of integrating genetic and ecological data to inform conservation strategies for B. eichwaldi. The findings emphasize the pressing need for habitat protection in the Hyrcanian forests to ensure the long-term survival of this vulnerable species. Our results and other available evidence show that while favorable habitat conditions for the presence of the species improved after the LGM, the species now faces substantial pressures from habitat fragmentation, water pollution, and mortality due to road traffic during the breeding season (anthropogenic pressure). Ongoing monitoring and research are crucial to further characterize the impacts of climate change and habitat degradation on B. eichwaldi populations, and to develop effective management plans to safeguard its populations at target (sampling) locations. By building on the insights gained from this study and previous research, conservation strategies will be better informed to ensure the survival of B. eichwaldi in the Hyrcanian forests, which serve as a critical refuge for this species and other endemic organisms.
Ethics Statement
The research sampling was conducted following ethical guidelines under the Institutional Animal Care and Use Committee number 1401.007 from Damghan University.
Conflicts of Interest
The authors declare no conflicts of interest.
Author Contributions
The study conception and design were done by Seyyed Saeed Hosseinian Yousefkhani. Sample collection was performed by Seyyed Saeed Hosseinian Yousefkhani and Hiva Faizi. Data collection and analysis were performed by Seyyed Saeed Hosseinian Yousefkhani, Amaal Yasser, Murtada Naser, Dennis Rödder, and Gulbeniz Qasimova. The first draft of the manuscript was written by Seyyed Saeed Hosseinian Yousefkhani and Hiva Faizi. All authors commented on the manuscript. All authors read and approved the final manuscript.
Funding
This work was supported partially by the Ocean Park Conservation Foundation, Hong Kong, under grant number AM01.2425.
Acknowledgments
We thank Damghan University authority for supporting lab work and instruments in the school of biology. We thank Mohammad Hosseinian Yousefkhani, who helped during the fieldwork in northern Iran. The authors are grateful to the anonymous reviewers and editor, Fatima Nasrin, for their valuable comments and help in manuscript finalization.
Supporting Information
Additional supporting information can be found online in the Supporting Information section.
Open Research
Data Availability Statement
The sequence data used to support the findings of this study are deposited in GenBank, and the relevant accession numbers are provided in Supporting Information Table S1.


