A Rapid and Cost-Effective Absorption Factor Method for the Multicomponent Quantification of Paracetamol and Orphenadrine
Abstract
In this work, we aimed to develop and validate a new absorption factor spectrophotometric method for the assay of the paracetamol (PRA) and orphenadrine (ORP) combination in bulk and tablet dosage form. The method utilizes mathematical processing of the total absorbance of the PRA-ORP mixture at two precisely selected wavelengths (203 and 243 nm). Employing the established absorption factor of standard PRA at these wavelengths, the individual absorbance of each drug within the mixture is obtained, eliminating the need for prior separation. The method showed excellent linearity for both drugs within the concentration range of 2–14 μg/mL, and the correlation coefficients (R2) were 0.9985 and 0.9986 for PRA and ORP, respectively. The limit of detection (LOD) values were determined to be 0.14 μg/mL for PRA and 0.16 μg/mL for ORP. Similarly, the limit of quantification (LOQ) values were 0.44 and 0.48 μg/mL for PRA and ORP, respectively. Furthermore, the method exhibited high accuracy, with recoveries ranging from 99% to 102%, and excellent precision, demonstrated by relative standard deviation (%RSD) values below 2%. These findings confirm the validity of our developed method for the routine analysis of PRA and ORP in both bulk and tablet dosage forms, making it a practical and cost-effective approach for quality control purposes.
1. Introduction
Assessing the quality of the drugs is a vital process to ensure the safety and efficacy of these molecules. In this context, analytical techniques, in particular spectroscopic and chromatographic techniques, possess significant importance in drug analysis [1, 2]. Additionally, the employment of mathematical derivations based on Beer’s law has provided novel approaches for the analysis of multicomponent pharmaceutical formulations using UV-spectrophotometry. These approaches offer improved efficiency, effectiveness, and cost-effectiveness compared to traditional HPLC approaches, eliminating the need for extraction steps and overcoming a significant challenge for pharmaceutical analysts. The mathematical manipulations on Beer’s law resulted in novel methods in UV-spectrophotometry, especially for the analysis of multicomponent pharmaceutical formulations, overcoming a significant challenge for pharmaceutical analysis. These methods offer several advantages of improved efficiency and cost-effectiveness and eliminate the need for extraction steps and hence could be considered good alternatives for the costly HPLC method [3–5].
Acetaminophen (paracetamol, PRA) is a well-established analgesic and antipyretic agent; it primarily targets cyclooxygenase (COX) isoforms through a nonenzymatic pathway [6]. Orphenadrine citrate (ORP) is a centrally-acting skeletal muscle relaxant and possesses some additional analgesic properties [7]. The combination of these two medications demonstrates synergistic efficacy in alleviating pain associated with skeletal muscle spasms [7].
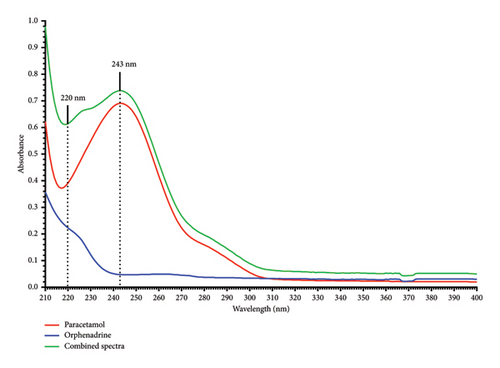
Literature review revealed several multicomponent analysis techniques for the analysis of PRA and ORP in their mixture form or their combination with other drugs [7–10]. However, there are no reports, to the best of our knowledge, for the determination of this drug mixture using the absorption factor UV spectrophotometric technique. This approach is based on recording and mathematical processing of absorption spectra where two components (x and y) have overlapping spectra; y shows interference at λmax of x (λ1), while x shows no interference with y at another wavelength (λ2), as in Figure 1.
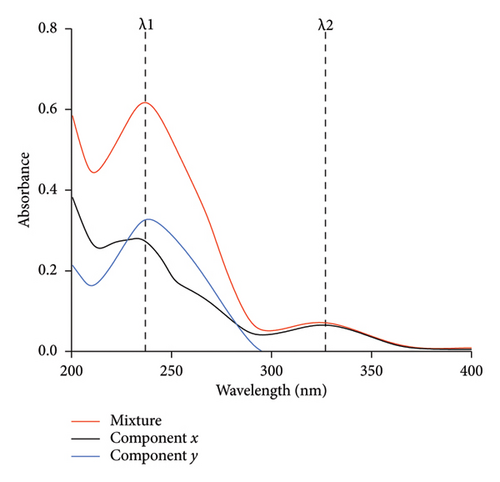
In this technique, the absorption spectra of the standard solutions of the component (y) with different concentrations were recorded in the wavelength range of 200–400 nm, and the average value of the absorption factor (Ay1/Ay2) was calculated.
The concentrations of x and y could be calculated from the corresponding regression equation obtained by plotting the absorption values of the zero-order spectra at λ1 and λ2 against the corresponding concentrations, respectively [11].
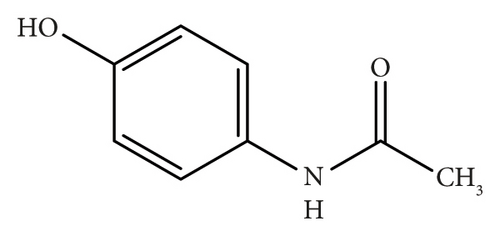
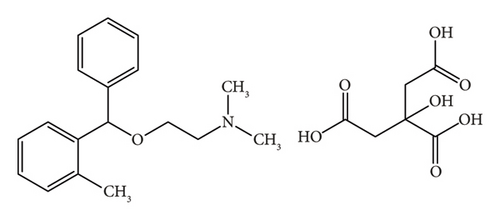
This approach is straightforward, especially in the case of the severe spectrum overlap between the two drugs. In this work, we aim to develop and validate a new absorption factor spectrophotometric method for determining the combination of PRA (Figure 2(a)) and ORP (Figure 2(b)) in bulk and tablet dosage form as per ICH guidelines [12]. Additionally, the developed method will be compared with other reported methods for the assay of this combination, including the absorbance subtraction method [13], the simultaneous equation method [14], and the isoabsorptive point method [15].
2. Materials and Methods
2.1. Materials and Instrumentation
Authentic working standards of PAR and ORP were obtained from Humavet Drugs International Co. Ltd, Sudan. PAR-ORP commercial tablets (labeled to contain 50 mg ORP and 450 mg PRA per tablet) were purchased from the local market. Freshly prepared distilled water was used as a solvent for all solution preparations. Spectrophotometric measurements were performed using T80 double-beam UV-visible spectrophotometer (PG Instruments, UK).
2.2. Preparation of a Standard Mixture of PRA and ORP Combinations (Solution A)
Precisely weighed aliquots (100 mg each) of PRA and ORP reference standards were transferred to a 100 mL volumetric flask, dissolved in distilled water, and sonicated for 10 min. The volume was adjusted to the mark using the same solvent to obtain a concentration of 1000 μg/mL for each drug in the mixture.
2.3. Preparation of a Standard PRA Solution (Solution B)
100 mg of PRA standard powder was accurately weighed and transferred to a 100 mL volumetric flask, dissolved in distilled water, and sonicated for 10 min. The volume in the flask was then made up to the mark using the same solvent. Subsequently, 1 mL of this solution was further diluted with distilled water to prepare a working standard solution of 10 μg/mL, and the volume was completed to the mark with distilled water.
2.4. Preparation of a Standard ORP Solution (Solution C)
Precisely weighed 100 mg of ORP standard powder was transferred to a 100 mL volumetric flask, dissolved in distilled water, and sonicated for 10 min, and the volume was completed to the mark with distilled water to obtain a standard solution of 1000 μg/mL.
2.5. Preparation of a Sample Stock Solution (Solution D)
Twenty commercially distributed PAR-ORP tablets, each labeled to contain 450 mg of PRA and 35 mg of ORP, were weighed and collectively pulverized to a fine powder. An accurate quantity of the powder equivalent to 100 mg of PRA and 7.777 mg of ORP was transferred to a 100 mL volumetric flask, dissolved in distilled water, and sonicated for 10 min to facilitate complete dissolution. The volume was adjusted to the mark with distilled water and filtered through Whatman filter paper (No. 41). 1 mL of the filtrate was transferred to a 100 mL volumetric flask. To ensure the concentration of ORP falls within the established linear range of the analytical method, 0.9 mL of Solution C was added to the flask. The volume in the flask was then brought to the mark with distilled water. This final solution (Solution D) theoretically contains 10 μg/mL of PRA and 9.78 μg/mL of ORP.
2.6. Scanning the Spectra and Selection of Wavelengths
1 mL of the standard mixture (Solution A) was transferred into a 100 mL volumetric flask and diluted with distilled water to give a solution containing 10 μg/mL of each drug. The absorbance of the solution was scanned between 200 and 400 nm via a UV-visible spectrophotometer using distilled water as a blank, and the combined spectrum of both PRA and ORP drugs was recorded (Figure 3).
2.7. Determination of the PRA Absorption Factor
Six samples of the PRA standard solution (Solution B) were prepared, and the absorbance of each solution was measured at λ = 220 nm and λ = 243 nm individually.
2.8. Method Development
Two calibration curves were constructed by relating the absorbance at λ = 220 nm for each drug individually to their corresponding concentrations in the mixture in μg/mL, and then the regression equations were computed.
2.9. Assay Procedure for the Tablet Formulation
The tablet solution (Solution D) was prepared in triplicate and then measured at 220 and 243 nm wavelengths against the blank. The individual absorbance of each drug at 220 nm wavelength was calculated according to the proposed method, and their actual concentrations were determined according to the calibration equation for each drug individually. The tablet content % and %RSD were determined.
2.10. Method Validation
The method was validated according to the ICH guidelines regarding linearity, precision, accuracy, limit of detection (LOD), limit of quantification (LOQ), and stability of solution parameters [16].
2.10.1. Linearity and Range
The linearity of the constructed calibration curves for both PRA and ORP was assessed within the concentration range of 2–14 μg/mL for each drug individually, and the parameters of the slope, intercept, and correlation coefficient were determined.
2.10.2. LOD and LOQ
2.10.3. Precision
The precision of the proposed analytical method was evaluated at two levels: intraday precision (repeatability) and interday precision (intermediate precision).
2.10.4. Repeatability (Intraday)
2.10.4.1. System Repeatability
From the standard mixture (Solution A), a solution containing 10 μg/mL of each drug was prepared. The absorbance of this solution was measured six times at λ 220 nm and λ 243 nm wavelengths on the same day. The system repeatability was measured as the relative standard deviation of these replicate measurements [16].
2.10.4.2. Analysis Repeatability
From the standard mixture (Solution A), six solutions containing 10 μg/mL of each drug were prepared on the same day. The solutions were measured at the two proposed wavelengths, and the analysis repeatability is determined as the relative standard deviation of the absorbance of these solutions [17].
2.10.5. Intermediate Precision (Interday)
From the standard mixture (Solution A), six solutions containing 10 μg/mL of each drug were prepared on day one, and another six were prepared on day two. The absorbance of the solutions was measured at the two proposed wavelengths using two different instruments. The intermediate precision is determined as the relative standard deviation of the resulting absorbance [18].
2.10.6. Accuracy
The second approach involved the determination of the recovery of spiked samples to assess the method’s accuracy [20]. Subsequently, the recovery percentage of known amounts of the standard drug mixture added to the constant quantity of tablet solution was calculated using the proposed method. A fixed volume of 0.45 mL of Solution C was added to increase the ratio of ORP in the sample.
2.10.7. Stability of the Sample Solution
The stability of the tablet solution was evaluated by keeping the sample solutions at three levels (80% (8 μg/mL), 100% (10 μg/mL), and 120% (12 μg/mL)) of the test concentration at room temperature without the protection of light and tested after 1, 2, and 3 h.
The stability was measured as a %RSD of the absorbance of each solution at the different stability times [21].
3. Results and Discussion
The correlation coefficients (R2) obtained from the calibration curves were found to be 0.9985 and 0.9986 for PRA and ORP, respectively, as shown in Table 1, consequently demonstrating the method’s good linearity and reliability for quantitative analysis (Figure 4). The LOD values were found to be 0.14 and 0.16 μg/mL for PRA and ORP, respectively, in their mixture solution. The minimum concentrations that can be quantified (LOQ) were 0.44 and 0.48 μg/mL for PRA and ORP, respectively. The values of LOD and LOQ were less than the smallest concentration in the linearity range, which supports the higher sensitivity of the proposed method [22].
| Parameters | PRA | ORP |
|---|---|---|
| Absorption wavelength (nm) | 220 | 220 |
| Range (μg/mL) | 2–14 | 2–14 |
| LOD (μg/mL) | 0.14 | 0.16 |
| LOQ (μg/mL) | 0.44 | 0.48 |
| Correlation coefficient | 0.9985 | 0.9986 |
| Regression equation | Y = 0.038X + 0.0012 | Y = 0.0191X + 0.0024 |
| Standard error of intercept | 0.00497 | 0.002748 |
| Standard error of slope | 0.00055 | 0.000299 |
| t-stat of intercept | 0.24836 | 0.87652 |
| t-stat of slope | 69.1747 | 63.7709 |
| p value of intercept | 0.8109846 | 0.4098166 |
| p value of slope | < 0.001 | < 0.001 |
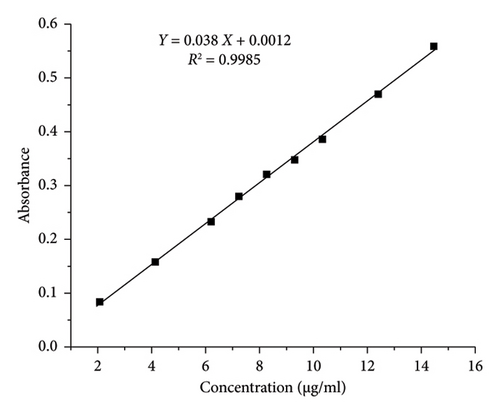
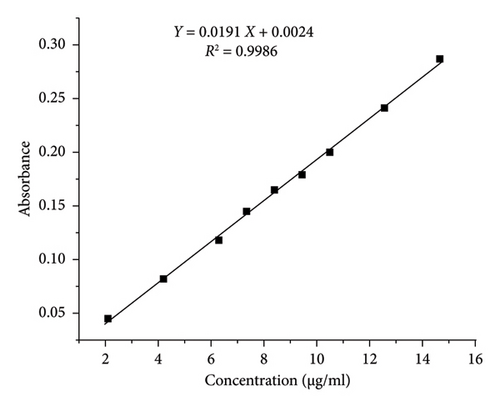
The results of the analysis of variance (ANOVA) performed for the two calibration plots revealed that the p values of the intercepts are higher than the significance level (p > 0.05), indicating a nonsignificant difference from zero. Importantly, the p values for the slopes were found to be statistically significant (p < 0.05), which indicates a strong linear relationship between concentration and absorbance, which is a desirable characteristic for sensitive calibration curves in UV-spectrophotometry [23].
The %RSD for the system repeatability of the analytical method is ≤ 0.25, and the %RSD values for the analysis repeatability and the intermediate precision were less than the acceptable limit of 2% [24]. Consequently, these findings demonstrate the method’s repeatability and precision within the specified concentration range (Tables 2 and 3).
| Repeatability | Mean absorbance | %RSD | ||
|---|---|---|---|---|
| 220 nm | 243 nm | 220 nm | 243 nm | |
| System repeatability | 0.5845 | 0.6695 | 0.25 | 0.22 |
| Analysis repeatability | 0.583 | 0.6605 | 0.39 | 0.67 |
| Instrument | Instrument 1 | Instrument 2 | Pooled RSD (%) | |||
|---|---|---|---|---|---|---|
| Wavelength (nm) | 220 | 243 | 220 | 243 | 220 | 243 |
| Absorbance | 0.583 | 0.661 | 0.587 | 0.676 | 0.8 | 1.3 |
The data for the percentage recovery of both drugs using the recovery of standard solution approach determined at three concentration levels: 80%, 100%, and 120%, of the target concentration are presented in Table 4. The average recovery for PRA ranged from 101.03% to 101.67%, while for ORP it ranged from 100.73% to 101.30% across all levels. The method demonstrated excellent accuracy, with all average recoveries falling within the 98%–102% range, which is typically considered acceptable for pharmaceutical analysis. The precision of the method was also notable, with %RSD not exceeding 1.26% for any level. Similarly, the average recovery of PRA and ORP using the recovery of spiked samples approach was 100.3% and 101.2%, respectively (Table 5). Notably, the RSD values for both drugs were less than 2%. The recovery values for the standard mixture solutions and the standard added to the tablet solutions were in the acceptance range for PRA and ORP.
| Concentration level | PRA | ORP | ||
|---|---|---|---|---|
| Average recovery | %RSD | Average recovery | %RSD | |
| 80% (8 μg/mL) | 101.43 | 0.54 | 101.17 | 1.26 |
| 100% (10 μg/mL) | 101.67 | 0.35 | 101.30 | 0.34 |
| 120% (12 μg/mL) | 101.03 | 0.89 | 100.73 | 0.72 |
| Sample no. | Standard added (μg/mL) | Standard recovered (μg/mL) | Recovery (%) | |||
|---|---|---|---|---|---|---|
| (PRA) | (ORP) | (PRA) | (ORP) | (PRA) | (ORP) | |
| 1 | 4 | 4 | 3.97 | 4.03 | 99.3 | 100.7 |
| 2 | 6 | 6 | 6.12 | 6.08 | 102.0 | 101.4 |
| 3 | 8 | 8 | 8.14 | 8.13 | 101.8 | 101.6 |
| Average recovery (%) | 101.0 | 101.2 | ||||
| %RSD | 1.5 | 0.5 | ||||
The content % of both drugs in assaying tablet solutions was found to be 101.2% and 100.2% for PRA and ORP in the sample mixture, respectively (Table 6). These results were within the acceptable limit for the assay.
| Theoretical concentration | Mean absorbance mixture (nm) | Actual concentration | Content (%) | ||||
|---|---|---|---|---|---|---|---|
| 220 | 243 | PRA | ORP | PRA | ORP | ||
| 10 μg/mL | 0.584 | 0.667 | 10.17 | 10.15 | 101.2 | 100.2 | |
| % RSD | 0.69 | 0.47 | |||||
For both PRA and ORP drugs in the mixture, the %RSD of the measured absorbance values among the different stability times was found to be within the acceptable limits of ≤ 2.0% for the three-hour stability time examined (Table 7), which supports the stability of the sample solution [25].
| Test concentration levels | ||||||
|---|---|---|---|---|---|---|
| 80% (8 μg/mL) | 100% (10 μg/mL) | 120% (12 μg/mL) | ||||
| PAR | ORP | PAR | ORP | PAR | ORP | |
| Mean abs | 0.500 | 0.556 | 0.608 | 0.685 | 0.742 | 0.813 |
| %RSD | 0.7 | 0.9 | 0.9 | 0.5 | 0.7 | 0.5 |
Our newly developed method, based on the absorption factor approach, was compared with the other reported spectrophotometric methods developed for the analysis of PAR-ORP combination. These methods included the simultaneous equation method, the Q absorbance method, the isoabsorptive point method, and the absorption subtraction method. Several key parameters were compared, including method simplicity, solvent used, linearity range, slope, LOD, and LOQ. All these methods were useful for the assay of this drug combination, but the newly developed absorption factor method offers some advantages over these methods.
When considering simplicity, the simultaneous equation method is more complex due to their multistep nature and the requirement to prepare two calibration curves for each drug to determine the absorptivity values, which must then be substituted into the two developed equations to calculate the concentrations. Conversely, the absorbance subtraction and isoabsorptive point methods were simpler, similar to our developed method, requiring only the determination of absorbance factor and creation of two calibration curves before direct application to the two generated equations. It is known that a change in solvent type can alter the absorption spectra, affecting the peak shape, position (solvent shift), intensity, and even the analyte solubility. All the compared methods utilized methanol as a solvent for preparations. In contrast, our method employs distilled water, which offers several advantages: it is nontoxic, cost-effective, nondestructive, and effectively solubilizes PRA and ORP without excessive extraction of the tablet excipient. The linearity range for PRA was 2–14 μg/mL and that for ORP was 2–14 μg/mL in the developed method. This was comparable to other methods which had ranges of 2–12 μg/mL (simultaneous equation [14]), 4–22 μg/mL (isoabsorptive point [15]), and 4–20 μg/mL (absorbance subtraction [13]) for PRA, and 2–12 μg/mL (simultaneous equation [14]), 5–50 μg/mL (isoabsorptive point [15]), and 5–45 μg/mL (absorbance subtraction [13]) for ORP. The LOD and LOQ for PRA were 0.14 and 0.44, respectively, and for ORP, they were 0.16 and 0.48, respectively, in the developed method. These LOD and LOQ values are lower than those reported using the simultaneous equation method, indicating that the developed method has better sensitivity compared to the simultaneous method. Other methods did not report these parameters. A limitation of the current work is that the selectivity with respect to common tablet excipients was not evaluated through individual excipient spiking studies due to limitations in available materials and experimental conditions. Nevertheless, the satisfactory recoveries obtained from standard addition experiments suggest minimal interference from formulation components.
4. Conclusions
In this work, a new and simple UV-spectrophotometric method has been developed and validated for the determination of PRA and ORP in both pure forms and pharmaceutical formulations. The developed method is based on the absorption factor principle and the manipulation of the resulting absorbance of the drug combination without the need for separation steps. The method showed excellent linearity for both drugs within the concentration range of 2–14 μg/mL, and the correlation coefficients (R2) were 0.9985 and 0.9986 for PRA and ORP, respectively. The method adheres to the ICH guidelines regarding sensitivity, accuracy, precision, and recovery. Notably, the method exhibited good sensitivity with LOD of 0.14 μg/mL for PRA and 0.16 μg/mL for ORP and LOQ of 0.44 and 0.48 μg/mL for PRA and ORP, respectively. Additionally, the method showed excellent accuracy and precision with recoveries ranging from 99% to 102% and relative standard deviation (%RSD) values below 2%. The developed method presents a valuable tool for the rapid, simple, and cost-effective analysis of PRA and ORP in pure forms and pharmaceutical formulations.
Conflicts of Interest
The authors declare no conflicts of interest.
Author Contributions
A.M.O. performed the measurements and drafted the manuscript. M.A. and S.W.S. aided in interpreting the results and worked on the manuscript. E.A.G. designed and supervised the work. All authors discussed the results and commented on the manuscript.
Funding
No funding was received for this manuscript.
Open Research
Data Availability Statement
The data that support the findings of this study are available from the corresponding authors upon reasonable request.


