Investigation on the Wavelength Dependency of Eu3+ by Time-Resolved Luminescence Spectroscopy
Abstract
The general method to measure lifetime of Eu3+ was to collect the decay curve at the peak with maximum intensity. In this work, lifetimes of Eu3+ spanning the whole luminescent range are collected by time-resolved emission spectroscopy, corresponding to the transitions from 5D0 to 7F0, 1, 2, 3, 4. The trace peak of decay curves resembles the emission spectrum, and outlines of time-resolved spectra taken at different decay times are similar to each other. By measuring lifetimes at different wavelengths, we notice the almost identical result of 99.96 ± 6.10 and 207.65 ± 2.55 ms All the results obtained suggest that lifetimes are independent of wavelength in Eu2O3. This conclusion is further verified by an algebraic deduction. Configurational coordinate diagram is employed to explain this phenomenon. It is the weak ion-lattice coupling that endows the lifetime of Eu3+ with this special transient character.
1. Introduction
The luminescence of lanthanide elements has been widely explored for applications in solid-state lighting, scintillators, emergency indicating, and backlight source for liquid crystal display [1]. The luminescence of lanthanide ions arises from the transitions between excited and ground state levels, and a series of characteristic sharp-line peaks have been established for +3 valence lanthanide ions with 4f-4f transitions [2, 3]. Due to the electric screening effect of the outer 5s and 5p electrons, the relative energy positions of 4f levels have small variations among different hosts, which could be interpreted by Dieke levels. On the contrary, the decay lifetime characterizes the transient properties, which describes the de-excitation process of electrons from the excited state to the ground state statistically. Nevertheless, a question remains unclear for the lifetimes of +3 valence lanthanide ions. In various studies, the lifetime values are measured at different peak wavelengths. When the lifetimes measured at different hosts are compared, is it correct to use the data from different peak wavelengths?
In this work, we select Eu3+ to investigate the wavelength dependence of lifetime in +3 valence lanthanide ions. The photoluminescence (PL) spectrum of Eu3+ is characterized by a series of sharp lines in the red light region, whereas the dipole-allowed emission of Eu2+ could be varied from blue to red, with a broad-band profile [4]. For Eu3+, the sharp peaks at 579, 591, 613, 653, and 701 nm stem from the 4f ⟶ 4f transitions in the range 580–590 nm (5D0 ⟶ 7F1), 615–625 nm (5D0 ⟶ 7F2), 650–660 nm (5D0 ⟶ 7F3), and 700–710 nm (5D0 ⟶ 7F4) [5, 6]. To eliminate the influences introduced by different Eu3+ doping concentrations, we select Eu2O3 to perform a series of spectroscopic measurements. Eu2O3 is an important kind of lanthanide dioxides and finds its applications in many fields such as phosphors [7], optical glasses [8], catalysts [9], dielectric materials [10], tracing hydration in cement paste [11], and luminescence probes [12–14]. The Eu2O3 powders have a white or slightly pink appearance due to the optically active europium ions. It crystallizes in the body-centered Ia-3 space group or monoclinic structure, depending on the synthesis conditions [15]. The cubic phase has a density of approximate 7.42 g/cm3. The powders are thermodynamically stable in air at room temperature, with melting point around 2350°C. Under reducing conditions, Eu2O3 could be reduced to EuO. It is insoluble in water but soluble in acids, forming europium salts. Eu2O3 exhibits paramagnetic behavior due to the unpaired electrons in the 4f shells. The sharp line emission of the 4f-4f transition within Eu3+ is relatively insensitive to the host because the 4f electron orbitals are shielded by the outer 5s and 5p shells. This luminescent property has drawn great attention, and many researchers have been focusing on lifetimes of Eu3+. Chen et al. studied the lifetime change in YVO4:Eu3+ at high pressure [16]. Berry, May, and Xu investigated the temperature dependence of lifetime [17]. Meltzer et al. [18] and Werts, Jukes, and Verhoeven [19] gave the effect of different surrounding medium on the lifetimes of Y2O3:Eu3+ nanoparticles. Mochizuki et al. studied the photo-induced and defect-induced spectra of Eu3+ [20, 21]. Other than bulk materials, Pol and Calderon-Moreno, Castro et al., and Bellocchi et al. synthesized Eu2O3 thin films/superstructure and measured the lifetimes [15, 22, 23]. Liu and Chen and Chen et al. analyzed lifetimes of Eu3+ in nanoparticles [24, 25]. The typical magnitude for lifetime measured is several milliseconds [26, 27]. However, the above researchers measured lifetime of Eu3+ only at the peak of maximum intensity. The lifetimes of other peaks have not been reported. It is very interesting to check whether the lifetimes between different energy level schemes (5D0-7FJ) of Eu3+ are the same or different.
In this work, we measure the time-resolved luminescence spectroscopy to investigate the wavelength dependency of Eu3+. This method is very effective in distinguishing luminescence centers with different lifetimes [28, 29]. By monitoring the de-excitation process at various peak maxima, the dataset could be sliced to present the temporal evolvement of the decay process from the excited state to multiple sublevels of the ground term. In this work, time-resolved spectra of Eu2O3 spanning the whole wavelength range are analyzed and corresponding results are verified by an algebraic deduction. Configurational coordinate diagram is adopted to explain those phenomena. The results will be helpful for spectroscopist and chemist in measuring and interpreting luminescence decay lifetimes.
2. Materials and Methods
Analytical grade Eu2O3 samples are measured in this work. Photoluminescent and time-resolved spectra were measured by Edinburgh Instruments FLS920. The light source for time-resolved spectra is a pulsed xenon lamp with a frequency of 100 Hz at room temperature. The photomultiplier used is Hamamatsu R928P which provides very low dark noise level. The emission and excitation spectra are all corrected according to the spectral instrumental response and the spectral output of the light source. Photoluminescent spectra were measured with step 0.1 nm in order to obtain better resolved data, and a long wave pass filter was employed to eliminate spray light. For time-resolved measurements, a series of lifetime decay curves with varying emission wavelength (step 0.2 nm) were collected. Every decay curve was measured by the same time range (4 ms), amounts of channels (4000), trigger time (0.1 ms), and measuring duration (30 s). F900 software is used to slice the raw lifetime curves to obtain time-resolved spectra.
3. Results
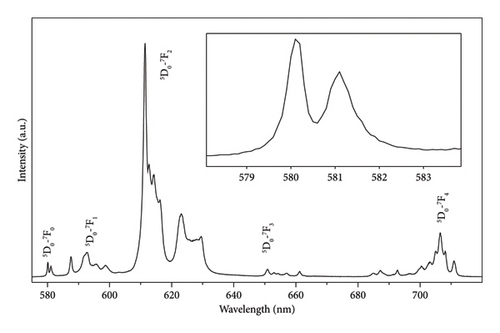
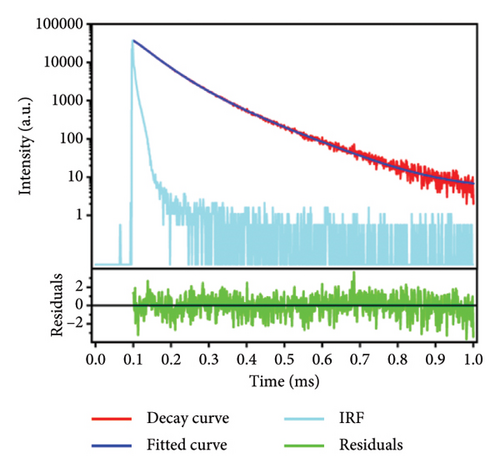
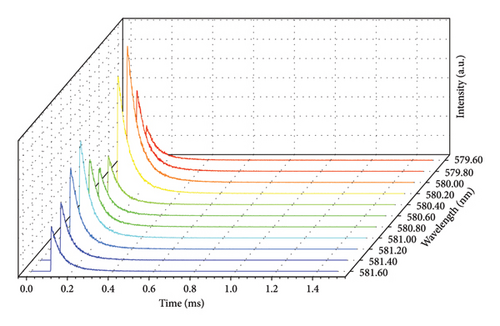
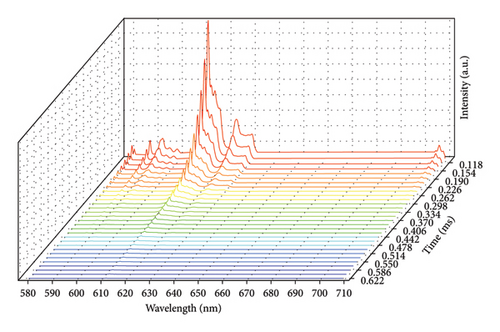
The emission spectrum of Eu2O3 is illustrated in Figure 1(a). It is characterized by discrete sharp lines, and some parts get blurred due to the thermal broadening. They originate from the transitions from 5D0 to 7F0, 1, 2, 3, 4 levels of Eu3+, as illustrated in Figure 1(b). Since Eu3+ has two crystallographic sites in Eu2O3, two series of sharp-line transitions could be recognized from the emission spectra. A series of decay curves with emission wavelength ranging from 579.6 nm to 581.6 nm with step 0.2 nm are collected and illustrated in Figure 2(a). All the curves are normalized to the maximum photon counts and displayed in the emerged graph. It can be concluded that all the decay curves have the same slope. Therefore, the lifetimes do not change regarding different wavelengths. As shown in Figure 2(b), the representing decay curve could be well fitted by a dual exponential expression because in Eu2O3 there exist two different crystallographic sites. As a result, the two lifetimes are fitted to be 99.96 ± 6.10 and 207.65 ± 2.55 ms. The 3D illustration (Figure 3) of decay curves varying with wavelength shows that the trace of the peak of each curve is in accordance with the corresponding part of emission spectrum in (Figure 1(a), enlarged one). The maximum intensities of those decay curves vary in the same manner as their corresponding intra-configurational transitions.

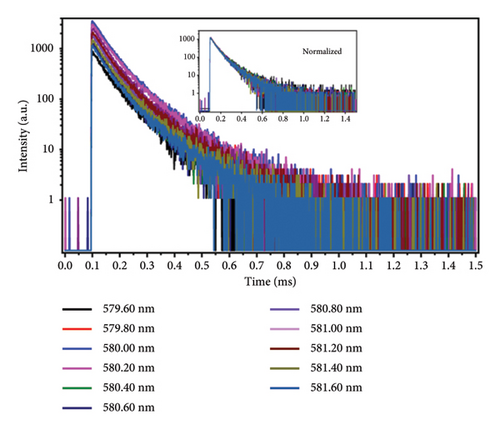
Other groups of decay curves with varying wavelength (586.6 nm–600.0 nm, 607.2 nm–631.6 nm, and 704.6 nm–708.8 nm) are also measured at the same conditions and they present identical results: lifetimes measured at all the different wavelengths are the same and the peak trace resembles the emission spectrum. For brevity, those bunches of curves are not given.
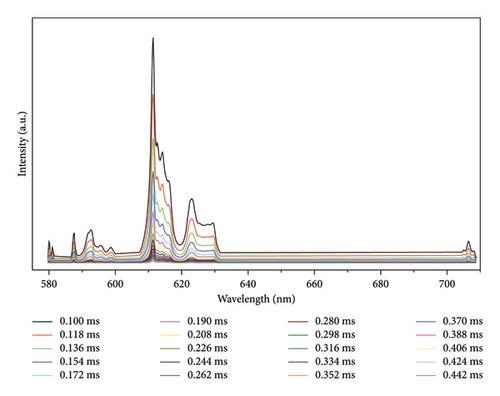
Time-resolved emission spectrum (Figure 4) is obtained by slicing decay curves measured at the whole wavelength range. At the very beginning of decay (0.1 ms, the trigger time), the excited electrons at 5D0 state start to return to ground states by emitting photons. Due to the different energy levels of 7FJ ground states, the photons emitted exhibit different wavelengths. As depicted in Figure 4, the number of emitted photons decays gradually within the entire wavelength range, and emission peaks do not shift during the decay process. In Figure 5, those spectra are packed together to show that the outlines are similar to each other at different decay times. Those results can all be explained by the independence of lifetime on wavelength in Eu2O3.
4. Discussion
As stated above, the peak trace of decay curves resembles the emission spectrum and the outlines of time-resolved spectra are similar to each other. This can be proved by an algebraic deduction.
Equation (4) provides the proof that the difference between emission spectrum (E) and peak trace of decay curves (E(t0)) exists only in numerical value ([]). Consequently, the peak trace of decay curves resembles the emission spectrum.
From equation (5), it can be seen that different time-resolved spectra differ merely in intensity. Their outlines are similar to each other.
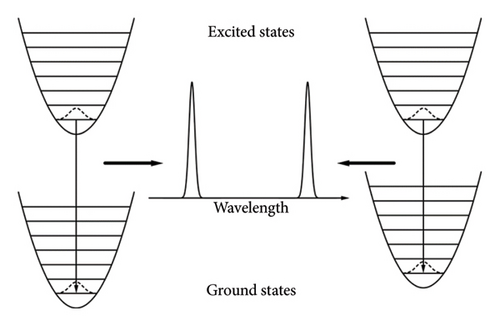
The essential point of this work is the independence of lifetime on wavelength, which has been testified by experimental results and algebraic deductions. Configurational coordinate diagram is adopted to try to demonstrate this phenomenon in physical level [30].
When trivalent europium ions get excited, they will vibrate around the equilibrium position . According to the weak coupling, the change in electronic state will not interfere with ionic movements [32]. Therefore, the equilibrium position of Eu3+ in excited state is identical to that in ground state ( in (6)). The excited Eu3+ returns to ground state with no phonons involved. The 7FJ ground states of Eu3+ occupy different energy levels, and the de-excitation processes from 5D0 state to those ground states emit photons with different energies/wavelengths. As depicted in Figure 6, Eu3+ ions before and after the de-excitation process share the same ionic movement and photons emitted experience the same decay process regardless of wavelength. Therefore, the lifetimes at different wavelengths remain the same.
5. Conclusions
Transient properties of Eu2O3 are measured and investigated. Series of decay curves measured at different wavelengths give the evidence that they share the same slope, and the peak trace of decay curves resembles the emission spectrum. Time-resolved spectra reveal that the outlines of spectra at different decay time are similar to each other. All the results obtained suggest that lifetime is independent of wavelength. An algebraic deduction and configurational coordinate diagram are employed to explain this phenomenon in physical level. The change in electronic state will not interfere with ionic movements which stay the same during the de-excitation process. And this may be the origin of the independence of lifetime on wavelength.
Conflicts of Interest
The authors declare no conflicts of interest.
Author Contributions
Conceptualization, Guijiu Xie and Mingyue Chen; methodology, Mingyue Chen; validation, Yang Bai, Zhu Liu, and Yuguang Liu; data curation, Yongchao Jia; formal analysis, Yuanhang Li; data curation, Yuguang Liu; writing – original draft preparation, Guijiu Xie; writing – review and editing, Mingyue Chen; visualization, Yuanhang Li and Mingyue Chen; and supervision, Mingyue Chen. All authors have read and agreed to the published version of the manuscript.
Funding
This research was funded by Fundamental Research Funds for the Central Universities (grant number FRF-TP-22-002A1) and Natural Science Foundation of Hebei Province (No. E2021203126).
Acknowledgments
This research was funded by Fundamental Research Funds for the Central Universities (grant number FRF-TP-22-002A1) and Natural Science Foundation of Hebei Province (No. E2021203126).
Open Research
Data Availability Statement
The spectrum data used to support the findings of this study are available from the corresponding author upon request.


