Application of Mo-Doped Carbon Quantum Dots Influorescencesensing of Lemon Yellow in Beverages
Abstract
A novel fluorescence sensor based on molybdenum-doped carbon quantum dots (Mo-CQDs) was developed to determine lemon yellow in beverages. Mo-CQDs were prepared from β-cyclodextrin(carbon source) and ammonium molybdate through a bottom-up, one-step hydrothermal synthesis. The composition and structure of Mo-CQDs were determined using transmission electron microscopy, x-ray energy spectrum analysis, and FT-IR. The amount of Mo-CQDs involved in the reaction and the pH of the system were optimized to determine the optimal reaction conditions. A quantitative standard curve was established based on the quenching effect of lemon yellow on Mo-CQDs, allowing the determination of lemon yellow in beverage samples. The experimental results show that Mo-CQDs were successfully prepared at 180°Cover 24 h, exhibiting good optical properties. Lemon yellow effectively quenches the Mo-CQDs fluorescence peak at 460 nm when excited at 330 nm in a phosphate buffer solution (PBS, pH = 6.0). The quenching degree of Mo-CQDs presents a good linear relationship between 0.10 and 100.00 μmol/L (R2 = 0.9955), and the detection limit is 0.03 μmol/L (S/N = 3). The average recovery rate in actual samples was 102.05%, and the relative standard deviation was 0.72%. The results were consistent with those obtained using HPLC, demonstrating satisfactory determination of lemon yellow content in various beverages, suggesting a good application prospect.
1. Introduction
Lemon yellow (C16H9N4O9S2Na3) is a highly stable food additive known for its bright color and is one of the most commonly used synthetic pigments in the food industry [1, 2]. The regulation of pigments in food has always been a crucial aspect of food safety. Although lemon yellow has no nutritional value, market research shows that many beverages, especially energy drinks, are predominantly yellow or golden [3]. This is largely due to the addition of lemon yellow, which enhances the visual appeal for some consumer groups. However, recent studies have shown that excessive intake of lemon yellow can be harmful, potentially causing damage to human DNA, it was found that lemon yellow was genotoxic to human lymphocytes and could directly bind to DNA and, in severe cases, cancer [4, 5]. Moreover, children consuming too much lemon yellow may face risks such as mental retardation, hyperactivity, and other issues [6, 7]. Excessive consumption has also been linked to nervous system impact, headaches, kidney dysfunction, reproductive toxicity, and intestinal flora imbalance. In additionally, the combined effects of multiple food additives can significantly increase health risks compared with single additive use [8]. Due to these toxic side effects, many countries and regions limit its usage to about 0.10 g/kg. For example, China’s National Standards (GB15266-2009, Sports drinks) set the maximum dosage of lemon yellow at 0.10 g/kg [4]. Therefore, it is necessary to develop a straightforward and accurate analytical tools for detecting and quantifying lemon yellow in beverages.
At present, the fluorescence probe method based on carbon quantum dots (CQDs) has been increasingly applied to the determination of lemon yellow [9, 10]. CQDs are a class of zero-dimensional carbon nanomaterials with significant fluorescence properties, consisting of ultra-fine, dispersed, quasispherical carbon nanoparticles with less than 10 nm in size. CQDs are characterized by low preparation cost, good water solubility, strong biocompatibility, stable fluorescence performance, and low toxicity and have shown tremendous potential in the fields of energy storage, optical, catalysis, and biomedical applications [11]. Compared with other analytical methods such as high performance liquid chromatography (HPLC) [12, 13], capillary electrophoresis [14], electrochemical method [15], and spectrophotometry [16], the CQDs fluorescence method offers high sensitivity and accuracy. In addition, the detection equipment is miniaturized and portable, making it particularly useful in food analysis [17, 18]. However, the low quantum yield of CQDs limits their broader application. This limitation can be addressed by modifying the electronic structure of CQDs through doping with different elements, surface modification, and analytical method optimization. These methods also can change the inherent properties of CQDs and improve their fluorescence quantum yield [19, 20]. For example, N-doping is the most commonly used approach to overcome this limitation and improve their fluorescence. Jiang et al. developed a new fluorescent sensor based on N-CQDs for the determination of lemon yellow, and the N-CQDs exhibited the blue fluorescence with a quantum yield of 28% [21]. Notably, metal doping can significantly alter the charge density and optical and physicochemical properties of carbon nanodots [22, 23]. Li et al. obtained fluorescence quenching method based on GSH-CdTeCQDs for the detected the concentration of lemon yellow in soft drink successfully [24]. Furthermore, the Mo doping CQDs could not only especially enhance the yield of CQDs but also facilitated the increase of catalytic activity of CQDs [25]. Therefore, CQDs doped with molybdenum metal have a good application basis, but there has been no report on their use in detecting lemon yellow.
In this work, a novel fluorescence sensor based on molybdenum-doped carbon quantum dots (Mo-CQDs) was developed to determine lemon yellow in beverages.
2. Experimental Section
2.1. Reagents and Chemicals
β-cyclodextrin, ammonium molybdate, ethylene glycol, sodium chloride, dipotassium hydrogen phosphate, potassium dihydrogen phosphate, potassium sulfate, potassium nitrate, magnesium chloride, ascorbic acid, and glucose were supplied bySinopharm Chemical Reagent Co., Ltd. All of the above chemicals were of analytical grade. Lemon yellow, a guaranteed reagent, was obtained from Shanghai Titan Technology Co., Ltd.
2.2. Apparatus
The following equipment was used in this study: Lumina fluorescence spectrophotometer (ThermoFisher, USA), 7021HX-ray energy spectrum analyzer (Horiba, Japan), JEF-2100 electron transmission microscope (JEOL, Japan), Nexsa G2 x-ray Photoelectron Spectroscopy (ThermoFisher, USA), AVATAR-370 Fourier transform infrared spectrometer (Nicola, USA), and LC-20Aliquid chromatograph (Shimadzu, Japan).
2.3. Synthesis of the Mo-CQDs
The facile, one-step hydrothermal synthesis was applied to prepare Mo-CQDs following the previously described method [26]. In brief, β-cyclodextrin (0.4256 g, 0.0125 mol/L) was dissolved in 7 mL of glycol. Afterultrasonic stirring for 20 min, ammonium molybdatetetrahydrate (0.1854 g, 0.005 mol/L) and 20 mL of high-purity water were added. Following 30 min of ultrasonication, the homogenous solution was placed in a 50 mL cuvette with a polytetrafluouroethylene lining and inserted into an autoclave for hydrothermal treatment at 180°C for 24 h. After cooling to room temp., the solution containing CQDs was purified by centrifugation at 1000 rpm for 15 min and filtered through a 0.22 μm membrane. The purified Mo-CQDs were stored at 4°C for further use.
2.4. Determination of Lemon Yellow
First, 250 μL of Mo-CQDs were added to a brown colorimetric tube. Then, various concentrations of lemon yellow were added, and the mixture was diluted to 10 mL with PBS (pH 6.0). After allowing the reaction to proceed for 3 min, the solution was transferred to a brown volumetric flask for fluorescence measurements. The obtained fluorescence intensity was denoted as F. The same process was repeated without lemon yellow, and the resulting fluorescence intensity was recorded as F0.
2.5. Determination of Lemon Yellow in Real Samples
One mL of beverages from different brands purchased from the supermarket were placed into a 100 mL volumetric bottle. High-purity water was added to the bottle and stirred for 10 min. The solution was then filtered using a 0.22 μm membrane to obtain the sample solution. For detection in real samples, 1 mL of diluted solution was used. The amount of lemon yellow in the sample was calculated using the following formula: Cx = X × M × 10−3, where Cx is the content of lemon yellow (g/kg), X is the concentration of lemon yellow (μmol/L), and M is the molar mass of lemon yellow (534.36 g/mol).
HPLC analysis was performed using an ODS-C18 column (5 μm, 4.6 mm × 150 mm). The column temperature was set at 35°C and the mobile phase was methanol: water (V:V) 20:80 with the flow rate of 1 mL/min. The volume of the injected sample was 20 μL, and the UV detection wavelength was 254 nm. Both the 0.0005 mol/L lemon yellow standard solution and the sample solution were injected, and the results were calculated using the comparison method.
3. Results and Discussion
3.1. Characterization of Mo-CQDs
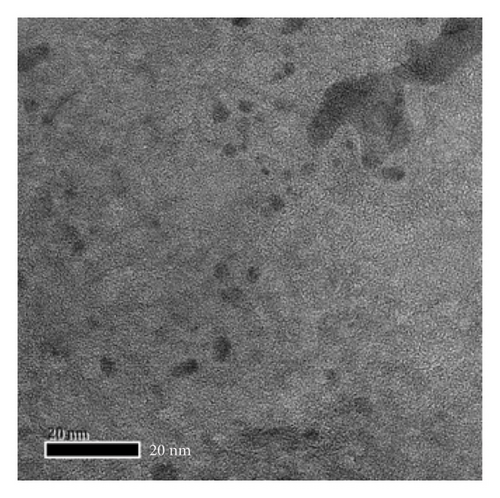
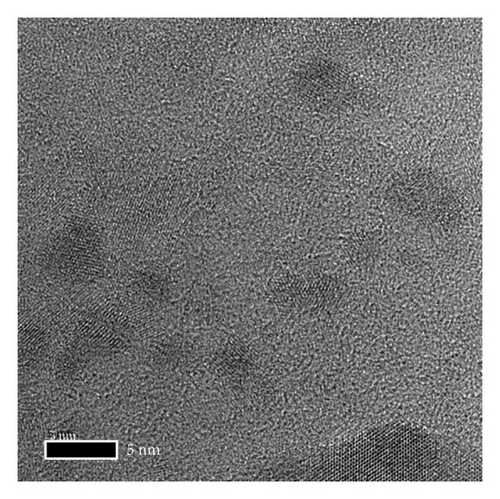
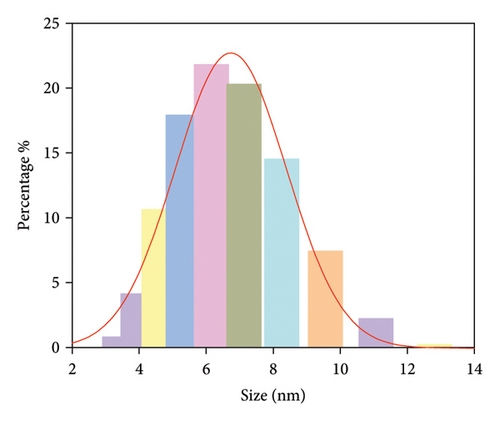
The morphology and functional groups of synthesized Mo-CQDs were studied using TEM. According to Figures 1(a) and 1(b), the Mo-CQDs exhibit a nearly spherical structure, with good dispersion and no agglomeration. The random counting of particles is shown in Figure 2(a) suggests that the particle size distribution of 30 observed Mo-CQDs ranges from 4.8 to 8.8 nm.
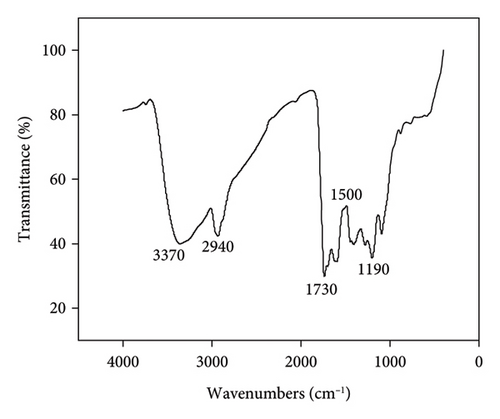
FT-IR spectroscopy was then used to analyze the surface functional groups of Mo-CQDs. As displayed in Figure 2(b), the absorption peak at 3370cm−1originates from the stretching vibrations of N-H and O-H bonds,while the absorption peak at 2940 cm−1corresponds to the C-H stretching vibration. Moreover, the intense peak at 1730 cm−1indicates the presence of carbonyl groups in Mo-CQDs, and two peaks near 1500 cm−1could be attributed to the stretching vibrations of imino (C=N) bonds. In addition, the IR peak around 1190 cm−1 indicates the presence of C-O bond in the structure [27]. Therefore, the results of FT-IR analysis suggest that Mo-CQDs exhibit a rich pattern of diverse functional groups, including carboxyl, hydroxyl, carbonyl, and nitrogen functional groups, which endows the doped CQDs with advantageous properties such as enhanced fluorescence, chemical stability, and enhanced solubility in water.
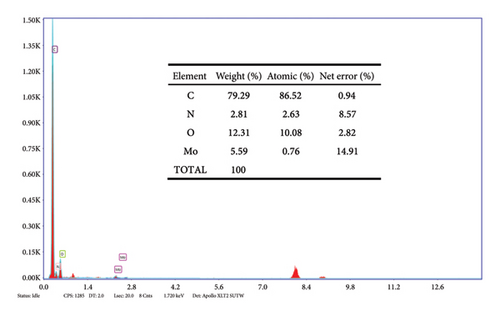
The elemental composition of Mo-CQDs was analyzed using an energy dispersive spectrometer (EDS). As shown in Figure 3, the Mo-CQDs are composed of four elements: C, N, O, and Mo, which correspond to the composition of the prepared raw materials. According to the results listed in Table 1, the weight percentages of four elements are 79.29%, 2.81%, 12.31%, and 5.59%, respectively. These results confirm that Mo-CQDs were successfully prepared.
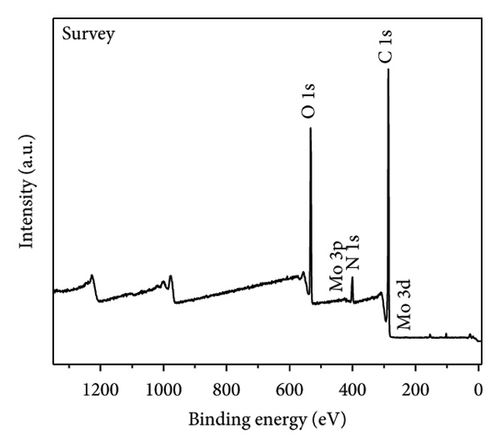
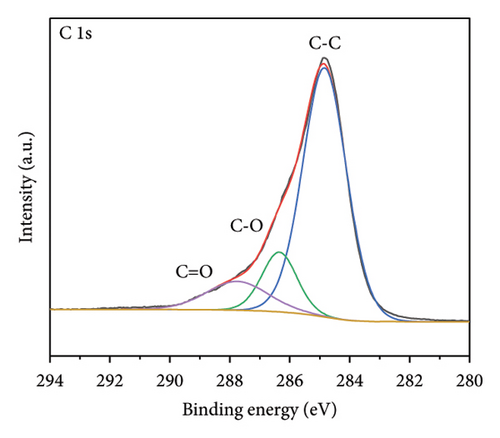
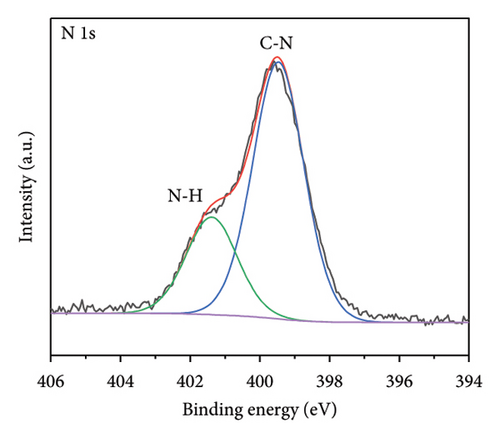
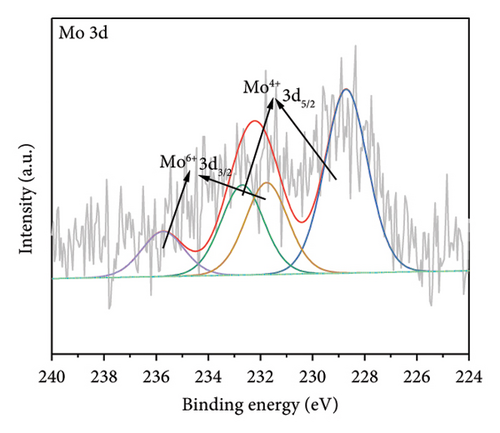
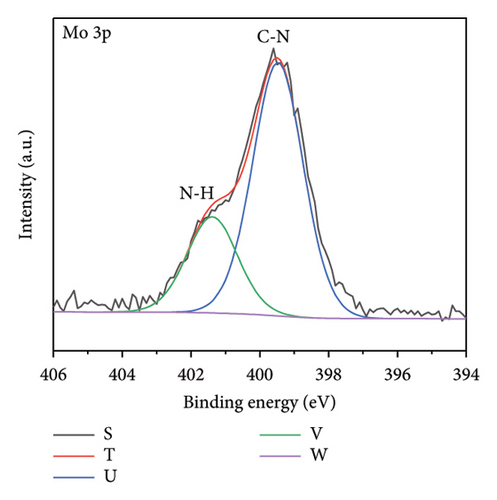
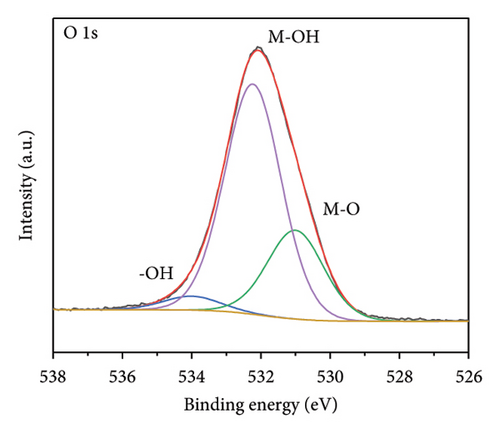
The functional groups on the surface of Mo-CQDs were further characterized using XPS. The XPS survey spectrum displayed in Figure 4(a) shows three intense peaks at 533 eV, 400 eV, and 286 eV, associated with the O 1s, N 1s, and C 1s energy levels, respectively. The high-resolution C 1s XPS spectrum (Figure 4(b)) can be deconvoluted into three peaks at 287.9 eV, 286.5 eV, and 284.6 eV, which correspond to C=O, C–O and C=C/C–C groups, respectively [34]. The high-resolution N 1s spectrum (Figure 4(c)) shows two maxima at binding energies of 401.4 eV and 399.5 eV, corresponding to N–H and C–N bonds, respectively [35]. The presence of two peaks in the Mo 3d spectrum at 226 eV and 238 eV (Figures 4(d) and 4(e)) suggests the existence of Mo element in the structure, indicating that (NH4)2Mo4O13 successfully participated in the synthesis of carbon dots. Moreover, two peaks at 235.7 and 231.7 eV in Mo 3d XPS are attributed to Mo6+, while peaks at 232.7 and 228.7 eV are associated with Mo4+species. The coexistence of Mo6+ and Mo4+ can be explained by the reduction between Mo6+ and β-cyclodextrin or ethylene glycol. In addition, the high-resolution O 1s spectrum (Figure 4(f)) can be decomposed into three peaks at 534.0 eV, 532.1 eV and 530.5 eV, corresponding to M–OH, C–OH, and M–O bonds, respectively [36]. From the results of XPS analysis, it can be concluded that Mo atoms were successfully doped into the structure of Mo-CQDs, confirming the FT-IR analysis results.
3.2. The Optical Properties of Mo-CQDs
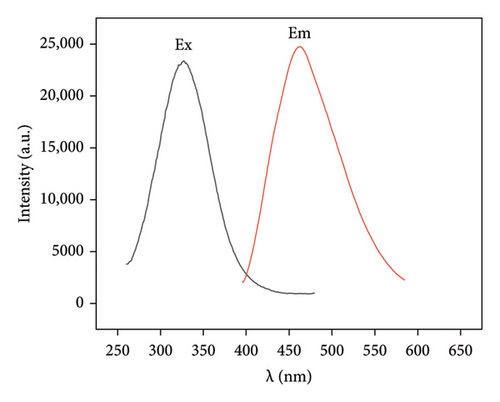
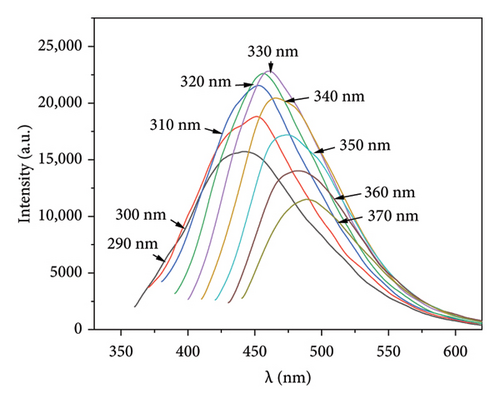
To investigate the optical properties of the synthesized Mo-CQDs, we recorded their excitation spectrum (Ex) and fluorescence emission spectrum (Em). As shown in Figure 5(a), the maximum excitation wavelength (λex) of Mo-CQDs is330 nm and the maximum λem is 460 nm. The partial overlap of the excitation and emission spectra suggests the occurrence of fluorescence quenching due to the inner filter effect and Försterresonance energy transfer (FRET) [37]. Moreover, the λem peak position changes with variations in the excitation wavelength from 290 nm to 370 nm, with a Stokes shift of about 50 nm (Figure 5(b)). This phenomenon may be caused by the size effect of Mo-CQDs and the existence of intermolecular forces between Mo-CQDs [38].
3.3. Optimization of Experimental Variables for Lemon Yellow Detection
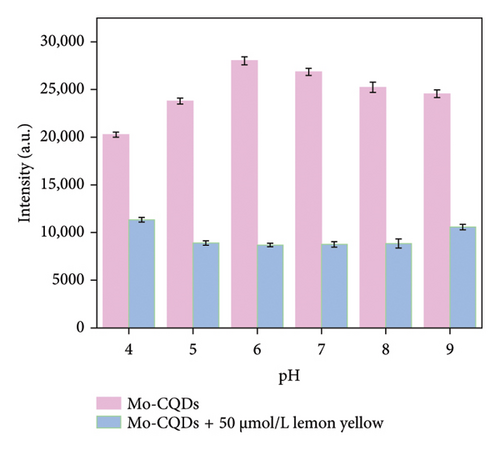
To optimize the conditions for detecting lemon yellow in real samples using our Mo-CQDs, we tested different pH values of the solution and the volumes of carbon dots added. We started with KH2PO4-K2HPO4 buffer (PBS) at pH values between 5.0 and 9.0, with a total concentration of 0.1 M, and measured the quenched fluorescence intensity (F-F0) to find the best pH value for fluorescence detection. As shown in Figure 6(a), the fluorescence intensity of Mo-CQDs increases up to pH 6.0 and then gradually decreases. After adding lemon yellow, the fluorescence quenching effect on Mo-CQDs was the greatest at pH = 6.0, as the difference in fluorescence intensities (ΔF) before and after the addition of dye solution was the largest. Therefore, pH 6.0 was selected as the optimum condition for further analyses.
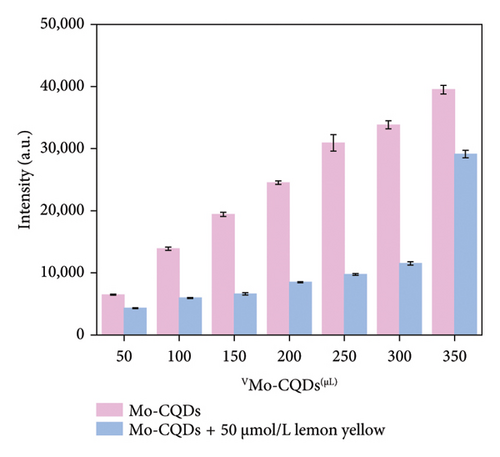
Next, we tested different volumes of Mo-CQDs (ranging from 50 to 350 μL in50 μL increments) ina 50 μmol/L lemon yellow solution in 0.1 mol/L PBS at pH 6.0. As shown in Figure 6(b), when the volume of Mo-CQDs was 250 μL, the 50 μmol/L lemon yellow solution exhibited the most significant quenching effect on the Mo-CQDs, with the largest fluorescence difference (ΔF). Therefore, 250 μL of Mo-CQDs was determined to be the optimal dosage.
3.4. Anti-Interference Performance
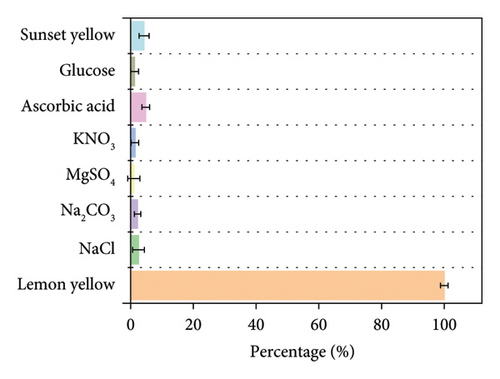
The possible interferences from minerals and small molecules in the beverage on the determination of lemon yellow using Mo-CQDs were investigated under optimal experimental conditions. Solutions of NaCl, Na2CO3, MgSO4, KNO3, ascorbic acid, and glucose at concentrations 20 times that of lemon yellow, and a sunset yellow solution at 5 times the concentration of lemon yellow, were added to a 10 mL colorimetric tube containing 250 μL Mo-CQDs and a 50 μmol/L lemon yellow standard solution. The fluorescence intensity was then measured. As shown in Figure 7, the interference did not exceed the tolerance range of ±5%, indicating that these interferences had little effect on the determination of lemon yellow. This demonstrates that the proposed method is reliable for analysis.
3.5. Calibration Curve for the Quantification of Lemon Yellow
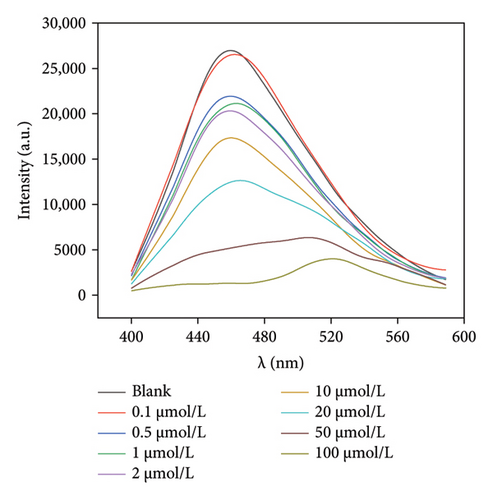
Given that Mo-CQDs exhibit a strong fluorescence quenching effect on lemon yellow, different concentrations of lemon yellow were added to the Mo-CQDs fluorescence sensor under optimal experimental conditions. As shown in Figure 8, the fluorescence intensity of Mo-CQDs progressively decreased with increasing amounts of lemon yellow. The logarithm of the ratio of initial to final fluorescence intensity (lg(F0/F)) and the concentration of lemon yellow in the range of 0.10–100.00 μmol/L displayed a good linear relationship, with the regression equation y = 0.0126x + 0.0794 (R2 = 0.9955). The detection limit was 0.03 μmol/L (S/N = 3). Compared to other reported methods for detecting lemon yellow, the method proposed in this paper has a wider linear range, is simple to operate, is low cost, uses easily sourced raw materials, and is environmentally friendly, making it superior to other sensors listed in Table 1.

3.6. Lemon Yellowdetermination in Various Beverages
To validate the real-world application of the sensor, the fluorescence measurements for the detection of lemon yellow in beverages were performed under optimal experimental conditions. In addition, 20 μL of a 0.01 mol/L lemon yellow standard solution was added to verify the fluorescence detection. The experimental results are provided in Table 2, with recoveries of the assays ranging from 101.20% to 102.50% and an RSD of 0.72%. This demonstrates the reliability of the Mo-CQDs sensor in real sample analysis. Furthermore, the sample was analyzed for lemon yellow content using HPLC as a standard method, yielding a result of0.32 μmol/L. Therefore, the results obtained with the Mo-CQDs sensor were consistent with those from HPLC,indicating that this sensor can be applied to the detection of lemon yellow in various beverages to facilitate quality control and improve the safety of such products.
| Detected (μmol/L) | Average (μmol/L) | RSD (%) | Added (μmol/L) | Found (μmol/L) | Recovery (%) | Average (%) | RSD (%) | |
|---|---|---|---|---|---|---|---|---|
| 1 | 0.36 | 0.34 | 2.08 | 20 | 20.85 | 102.45 | 102.05 | 0.72 |
| 2 | 0.32 | 20.82 | 102.50 | |||||
| 3 | 0.35 | 20.59 | 101.20 |
4. Conclusion
Functional Mo-CQDs with high fluorescence efficiency were successfully synthesized using a one-step hydrothermal method with molybdenum salts. The Mo-CQDs surface contains a variety of organic groups, providing good water solubility and stability. Based on the fluorescence quenching effect of lemon yellow on Mo-CQDs, a linear relationship between the concentration of lemon yellow solution and the fluorescence intensity of Mo-CQDs was established, with a detection limit of 0.03 μmol/L. Moreover, the quantification of lemon yellow in a variety of beverages was achieved. Therefore, Mo-CQDs can be initially used as an ideal CQD for the rapid detection of lemon yellow, showing good potential in food safety analysis.
Conflicts of Interest
The authors declare no conflicts of interest.
Author Contributions
Xiaojing Si and Yaping Ding: conceptualization; Xiaojing Si and Yue Huang: methodology; Jiali Zheng and Yuhan Liu: investigation; Yue Huang and Yang Lan: data analysis; Xiaojing Si: writing and editing; Yaping Ding: funding acquisition.
Funding
This research was funded by the National Natural Science Foundation of China (22274096, Yaping Ding) and the Shanghai Municipal Education Commission of China in 2023 (Shanghai key course construction project, Xiaojing Si).
Acknowledgments
This work was supported by National Natural Science Foundation of China (22274096), Shanghai key course construction project of Shanghai Municipal Education Commission in 2023 (Modern Instrumental Analysis).
Open Research
Data Availability Statement
The data that support the findings of this study are available on request from the corresponding author. The data are not publicly available due to privacy or ethical restrictions.


