Unveiling the Anticancer Potential of Formylbenzyl-N,N-Dimethylmethanaminium-Based Ionic Liquids via Cheminformatics Approaches
Abstract
Inhibiting tubulin polymerisation, an essential step for cell proliferation, can control cell division. Our in silico study aims to screen out the derivatives of 1,3-benzodioxole-tagged formylbenzyl-N, N-dimethylmethanaminium ionic liquid for their potential as anticancer agents. All parameters requisite for a compound to act as a pertinent drug candidate are sequentially measured. A library of fifteen 1,3-benzodioxole-based ionic liquids with different anions has been designed for molecular docking. Based on binding affinity obtained from protein–ligand molecular docking, ionic liquid comprising of anion bistrifluoromethylamide, octyl sulphate, trifluoromethanesulphonate, dichloroacetate and trifluoroacetate, with common cation—1-(benzo[d][1,3] dioxol-5-yl)-N-(4-formylbenzyl)-N,N-dimethylmethanaminium, was found potent among all. The hydrogen bonding and nonbond interactions among ligands and proteins were analysed to determine the efficacy of ligands. The docking results revealed that Compounds 7 and 10 (binding energy −361.33 and −345.4 kcal/mol) might pave the way for potential pharmaceutical candidates. The physicochemical and absorption, distribution, metabolism, excretion and toxicity (ADMET) properties of selected compounds were studied to know their potential as drug candidates. The docked complexes of screened compounds were further commenced for dynamic simulation to fathom the compatibility of compounds. These potent compounds can be synthesised and biologically evaluated for their inhibition effect on microtubule formation.
1. Introduction
According to mortality data collected by the National Center for Health Statistics, the leading cause of death is cancer, approximately 350 deaths per day in the United States because of lung cancer [1]. The COVID-19 pandemic also resulted in the delayed exposure of cancer cases. There are different types of cancer; however, the most commonly occurring are breast, uterine corpus, colon, rectum, prostate, colorectal and melanoma [2]. These can be treated by numerous methods such as chemotherapy, cytotoxic antitumour drugs, targeted therapy and the most advanced genetic engineering [3]. Recently, therapies involving ionic liquids (ILs) emerged due to physicochemical characteristics of ILs which can be attuned for therapeutic use [4, 5]. There is also an uptick in research focused on in silico approaches used for preclinical studies and reduced research costs [6–9]. Molecular docking is the commonly used tool to understand the druggability and specificity of ligands against target protein molecules [10–14]. HexServer is a publicly available docking server (https://hexserver.loria.fr/) powered by graphics processors and does not require any registration [15]. The server gives high-quality docking predictions by using FFT-based rigid body docking. Blind docking is carried out because the whole molecule is considered for searching the most probable binding site [16]. The search algorithm of docking is performed to meet the minimum energy conformation of the ligand docked with protein [17].
Microtubule proteins are composed of α-β-tubulin subunits and are the centre of several cellular processes. Alteration in the expression of any isotype of these proteins may lead to disruption of regular cell processes such as proper segregation of chromosomes during mitosis [18–20]. Hence, microtubule-targeting compounds can be used in the treatment of cancer [21]. The novel derivatives with known antimicrotubular moiety can be designed and studied for their effectiveness [22]. 1,3-Benzodioxole is an important ingredient of several drugs, an integral part of biologically active compounds that possess antimalarial, antimicrobial, antifungal and cytotoxic activity against cancer cell lines [23, 24]. Many natural anticancer agents—podophyllotoxin, stesganacin, and combretastatin—are reported to have benzodioxole moiety. Benzodioxole-based dithiocarbamate derivatives have shown cytotoxic activity against A549 human lung adenocarcinoma and C6 rat glioma cell lines [25]. Several studies have demonstrated the cytotoxic effects of 1,3-benzodioxole compounds on various cancer cell lines such as breast cancer, lung cancer and leukaemia cell lines [26]. By activating the proapoptotic factors, 1,3-benzodioxole derivatives can induce programmed cell death [27]. The chemical structure of 1,3-benzodioxole allows various chemical modifications that can enhance its potency and selectivity. Derivatives of 1,3-benzodioxole and its higher homologue 1,4-benzodioxine have been assessed for tubulin polymerisation inhibition activity resulting in an antiproliferative effect [28]. 1,3-Benzodioxole moiety causes the inhibition of tubulin polymerisation as mentioned in our previous research articles [9, 27–29, 29–31]. In the continuation of drug discovery and to know the molecular mechanisms, we have performed molecular docking of designed compounds followed by pharmacological analysis for compounds with better binding affinity against tubulin protein [32, 33]. Furthermore, other virtual screening approaches, such as in silico preclinical trials, were followed as docking is not a wholesome method for screening biologically active compounds.
2. Material and Methods
2.1. Construction of Library
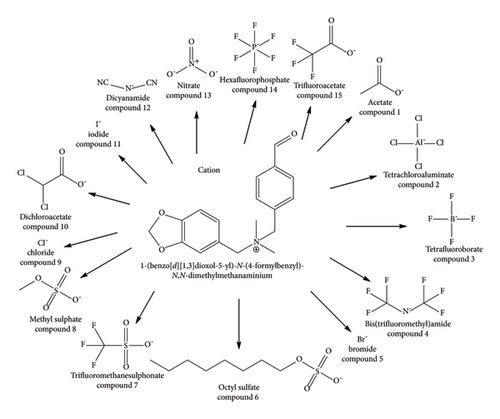
The compounds were drawn by using the ChemDraw workspace [34]. A library of fifteen ILs was created by replacing the anion moiety from the 1,3-benzodioxole compound (Figure 1). The anions were selected from established literature based on pharmacokinetic properties. Energy minimisation of ligands was performed using MMFF94 force field in Chem3D [35, 36]. The maximum number of iterations was set to 10,000, and the minimum RMS gradient was set to 0.100.
2.2. Modelling and Energy Minimisation of Targeted Protein
The FASTA sequence of targeted protein tubulin was obtained from RCSB Protein Data Bank followed by submission to the SWISS MODEL server (https://swissmodel.expasy.org) [37, 38]. The protein model was prepared from the template having a hundred percent identity. MolProbity score, QMEANDisCo and local quality estimate plot did the structural assessment of the prepared model [39–41]. The unwanted ligands were removed from the receptor protein, and then, energy minimisation of protein was performed with the GROMOS96 implementation of Swiss-PdbViewer [42, 43].
2.3. Molecular Docking Analysis
The optimised ligands, encompassing both the anionic and cationic constituents as a complex, were subsequently subjected to blind docking analyses with tubulin protein utilising the HEX server [44, 45]. The parameters used for docking control were correlation type—shape only; FFT Mode—3D; sampling method—range analysis; grid dimension—0.6; solutions—2000; receptor range—180, step size—7.5; ligand range—180, step size—7.5; twist range—360, step size—5.5; distance range—40, box size—10; translation step—0.8, substeps—0; score threshold—0.0 and final search—25. The amino acid residues involved in nonbond interactions were observed using the PLIP server [46]. The docked complex of the top five potent candidates was analysed in UCSF Chimera and PyMOL Molecular Graphics System [47–50].
2.4. ADMET Analysis
Many drugs are withdrawn from the market owing to their detrimental effect witnessed during clinical studies. Hence, the performance of drugs after administration can be anticipated via in silico ADMET studies. The physicochemical and ADMET properties were predicted using ADMETlab 2.0 (https://admetmesh.scbdd.com/) [51–54]. The behaviour of pharmacological candidates inside the body is described by pharmacokinetic properties which in turn are influenced by physicochemical properties [55]. The online server adumbrates several properties mandatory for screening of biologically active compounds such as how effectively the compound is absorbed and distributed in the human body; how the compound would be metabolised and cleared out from the biological system and how much it will affect the biological system either positively or adversely [56].
2.5. Molecular Dynamic Simulation
To validate the docking results obtained from molecular docking, dynamic simulation was performed with GROMACS open-source software using CHARMM27 (all-atom force field) force field [57–59]. Before the simulation, topology files for ligands were created by using SwissParam [60–62]. The unit cell was created, and the recommended TIP3PBOX solvent model was chosen. Energy minimisation of structures was performed before conducting the NVT and NPT ensemble. The NVT and NPT equilibration were conducted for 100 ps, and MD simulation was run for 1 ns to obtain the output values for root mean standard fluctuations, root mean square deviations, the hydrogen bond between protein and ligand, total protein and ligand energy and values for kinetic energy [63, 64]. XMgrace software was used to plot the graph from these output values [65].
3. Results
3.1. Ligand Optimisation
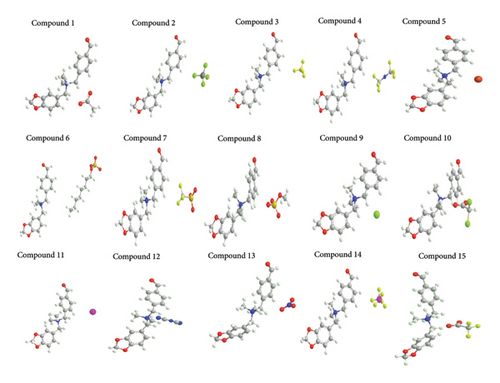
The minimum energy conformations of all compounds were examined for change in bond length and bond angle; details are provided in Supporting Information (Supporting Information-Optimisation Details). The three-dimensional structures of ligands optimised by Chem3D are given in Figure 2.
3.2. Modelling of Protein
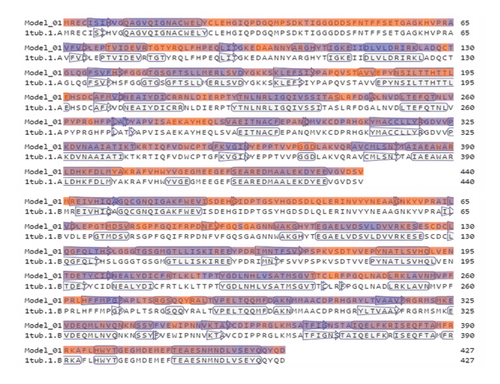
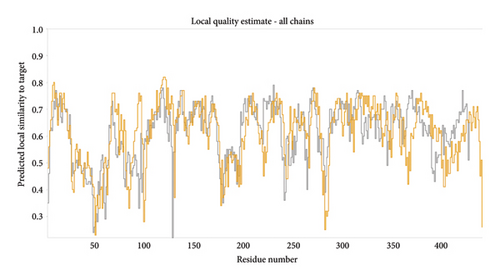
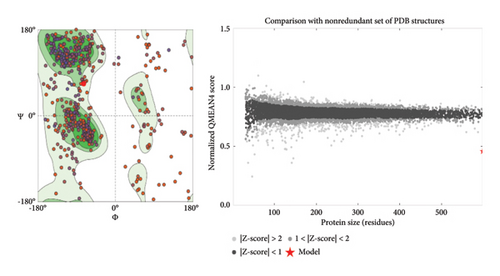
The three-dimensional structure (1TUB) downloaded from RCSB Protein Data Bank has some missing amino acid residues; hence, modelling of protein was conducted through the online open-source software SWISSmodel. The sequence alignment for both chains is shown in Figure 3(a). The MolProbity score was calculated as 2.62, and the local quality estimate plot is presented in Figure 3(b). The MolProbity score suggests the quality of protein by combining all geometric scores clashscore, rotamers and Ramachandran evaluations, and the local quality plot shows the similarity of the model structure to its native structure. The Ramachandran plot predicts the validity of the three-dimensional structure of a protein by discriminating the phi and psi space into allowed and disallowed regions, and here, the plot shows that Ramachandran favoured, Ramachandran outliers and rotamer outliers are 78.79%, 8.34% and 5.97% (Figure 3(c)). The amino acids with poor chemical parameters are presented by C-β deviation (38), bad bonds (0/6944) and bad angles (161/9418). The reliability of quality estimation can be improved by the QMEANDisCo Global score which was found to be 0.61 ± 0.05 (Figure 3(c)).
3.3. Molecular Docking Analysis
The ligands and receptor tubulin protein were subjected to docking through the HEX CUDA server. The binding energy values are mentioned in Table 1, interpreting that Compound 7 has scored the lowest with −361.33 kcal/mol followed by Compound 10 (−345.4 kcal/mol), Compound 4 (−333.8 kcal/mol), Compound 6 (−328.5 kcal/mol) and Compound 15 (−321.85 kcal/mol). Compounds 3 and 13 have almost similar values for binding energy. The outcome of docking studies of Compounds 7 and 10 are better than our previous 1,3-benzodioxole-tagged dacarbazine derivatives [9].
| Compound | Binding energy (kcal/mol) |
|---|---|
| Compound 1 | −309.9 |
| Compound 2 | −312.62 |
| Compound 3 | −318.64 |
| Compound 4 | −333.8 |
| Compound 5 | −288.31 |
| Compound 6 | −328.5 |
| Compound 7 | −361.33 |
| Compound 8 | −292.67 |
| Compound 9 | −288.93 |
| Compound 10 | −345.4 |
| Compound 11 | −297.19 |
| Compound 12 | −286.93 |
| Compound 13 | −318.97 |
| Compound 14 | −301.44 |
| Compound 15 | −321.85 |
- Note: The compounds with better docking results are displayed in bold.
3.4. Visualisation of Docked Complexes
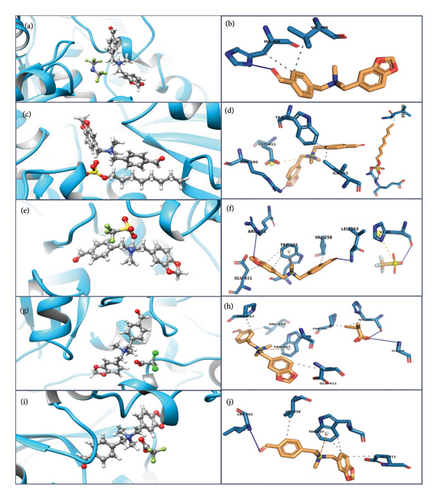
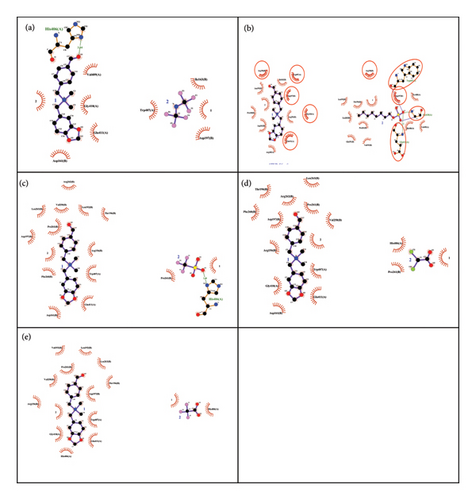
The resulting complex obtained from docking was analysed in Chimera and PyMOL. Compounds 4, 6, 7, 10 and 15 have shown hydrophobic, salt bridge, pi-cationic and hydrogen bond interactions with receptor protein (Table 2). The amino acid residues of tubulin protein involved in nonbonding interactions are supported by literature [31]. Compound 4 has shown hydrophobic interactions with HIS406 and VAL409 amino acid residues of Chain A and hydrogen bond with HIS406 amino acid residue (Figures 4(a) and 4(b)). The protein—Compound 6 complex is stabilised through hydrophobic interactions with amino acid residues ILE163B, TRP407A and LEU263B; salt bridge formation with GLU411A and hydrogen bonding with ARG105A, GLY410A and GLU411A amino acid residues (Figures 4(c) and 4(d)). Compounds 7 and 15 both have hydrophobic interactions with VAL258B, TRP407A and GLU411A and pi–cation interaction with TRP407A. Compound 7 has formed salt bridge with HIS406A and three hydrogen bonds with ARG251B, LEU263B and HIS406A (Figures 4(e) and 4(f)), whereas Compound 15 has one hydrogen bond with LEU263B (Figures 4(g) and 4(h)). Compound 10 interacts with PRO261B, VAL258B, GLU411A and HIS406A amino acid residues through nonbond interaction, and the stability of the complex is enhanced by pi–cation interactions with TRP407A and hydrogen bonding with HIS406A and GLY410A amino acid residues (Figures 4(i) and 4(j)). The protein–ligand interactions are presented in two-dimensional format in Figure 5(a) (Compound 4), Figure 5(b) (Compound 6), Figure 5(c) (Compound 7), Figure 5(d) (Compound 10) and Figure 5(e) (Compound 15).
| Compound | Amino acid residues involved in | No. of hydrogen bonds | |||
|---|---|---|---|---|---|
| Hydrophobic interactions | Salt bridge | Pi–cation interaction | Hydrogen bond | ||
| Compound 4 | HIS406A, VAL409A | HIS406A | 1 | ||
| Compound 6 | ILE163B, TRP407A, LEU263B, | GLU411A | ARG105A, GLY410A, GLU411A | 3 | |
| Compound 7 | VAL258B, TRP407A, GLU411A | HIS406A | TRP407A | ARG251B, LEU263B, HIS406A | 3 |
| Compound 10 | PRO261B, HIS406A | HIS406A, GLY410A | 2 | ||
| Compound 15 | VAL258B, TRP407A, GLU411A | TRP407A | LEU263B | 1 | |
- Note: The amino acid residues of protein involved in nonbond interactions with ligands and the type of interactions are mentioned in the table.
3.5. Physicochemical and Pharmacokinetic Analysis
In silico studies were carried out with ADMETlab 2.0 server to predict the physicochemical, absorption, distribution, metabolism, excretion and toxicity profile of designed compounds. Here, we presented these properties for potent compounds only in Tables 3, 4, 5, 6, 7, 8, 9, 10. The same data for Compounds 1, 2, 3, 5, 8, 9, 11, 12, 13 and 14 are given in supporting table (SI) (available here).
| Physicochemical properties | Compound 4 | Compound 6 | Compound 7 | Compound 10 | Compound 15 |
|---|---|---|---|---|---|
| MW (g/mol) | 450.14 | 507.23 | 447.1 | 425.08 | 411.13 |
| nHA | 5 | 8 | 7 | 6 | 6 |
| nRot | 7 | 13 | 6 | 6 | 6 |
| Flexibility | 0.412 | 0.684 | 0.316 | 0.333 | 0.333 |
| TPSA | 49.63 | 101.96 | 89.57 | 75.66 | 75.66 |
| logS (log mol/L) | −1.156 | −0.294 | −0.054 | 0.388 | 0.456 |
| logP (log mol/L) | 2.494 | 2.285 | 1.458 | −0.371 | −0.151 |
| logD (log mol/L) | 3.411 | 1.665 | 1.332 | 0.054 | 0.243 |
 |
- Note: The green-coloured cells predict excellent results, and red-coloured cells predict poor results. QED, quantitative estimate of drug-likeness; SA score, synthetic accessibility; Fsp3, number of sp3 hybridised carbon; NPscore, natural product-likeness score.
 |
- Note: The green-coloured cells predict excellent results, and yellow- and red-coloured cells predict poor results. Caco-2, human colon adenocarcinoma cell lines; F20%, human oral bioavailability 20%; F30%, human oral bioavailability 30%.
- Abbreviations: HIA, human intestinal absorption; MDCK, Madin-Darby canine kidney cells; Pgp-inh, P-glycoprotein inhibitor; Pgp-sub, P-glycoprotein substrate.
 |
- Note: The green-coloured cells predict excellent results, and red-coloured cells predict poor results. Fu, fraction unbound in plasma.
- Abbreviations: BBB, blood–brain barrier; PPB, plasma protein binding; VD, volume distribution.
| Metabolism | Compound 4 | Compound 6 | Compound 7 | Compound 10 | Compound 15 |
|---|---|---|---|---|---|
| CYP1A2-inh | 0.786 | 0.201 | 0.677 | 0.332 | 0.47 |
| CYP1A2-sub | 0.965 | 0.916 | 0.884 | 0.595 | 0.663 |
| CYP2C19-inh | 0.554 | 0.075 | 0.079 | 0.028 | 0.047 |
| CYP2C19-sub | 0.879 | 0.826 | 0.304 | 0.728 | 0.179 |
| CYP2C9-inh | 0.064 | 0.008 | 0.011 | 0.005 | 0.02 |
| CYP2C9-sub | 0.662 | 0.621 | 0.572 | 0.534 | 0.185 |
| CYP2D6-inh | 0.974 | 0.9 | 0.965 | 0.204 | 0.604 |
| CYP2D6-sub | 0.915 | 0.886 | 0.898 | 0.742 | 0.65 |
| CYP3A4-inh | 0.866 | 0.495 | 0.43 | 0.083 | 0.185 |
| CYP3A4-sub | 0.905 | 0.066 | 0.252 | 0.135 | 0.18 |
- Abbreviations: Inh, inhibitor; sub, substrate.
 |
- Note: The green-coloured cells predict excellent results, and red-coloured cells predict poor results. CL, clearance of drugs; T1/2, half-life of a drug.
 |
- Note: The green-coloured cells predict excellent results, yellow cells indicate medium results, and red-coloured cells predict poor results. hERG, human ether-a-go-go; Ames, Ames test for mutagenicity; ROA, rat oral acute toxicity (mg/kg); FDAMDD, maximum recommended daily dose (mmol/kg-bw/day); carcinogenicity (TD50 values); EC/EI, eye corrosion/irritation.
- Abbreviations: DILI, drug-induced liver injury; H-HT, human hepatotoxicity; SkinSen, skin sensitisation.
| Environmental toxicity | Compound 4 | Compound 6 | Compound 7 | Compound 10 | Compound 15 |
|---|---|---|---|---|---|
| BCF | 1.507 | 0.926 | 0.575 | 0.53 | 0.579 |
| IGC50 | 3.418 | 5.04 | 3.253 | 3.67 | 2.876 |
| LC50FM | 5.268 | 6.427 | 4.259 | 4.434 | 3.914 |
| LC50DM | 6.008 | 4.499 | 5.388 | 4.94 | 5.023 |
- Note: BCF, bioconcentration factor, log 10 (L/kg); IGC50, concentration causing 50% growth inhibition of Tetrahymena pyriformis, log10 [(mg/L)/(1000 × MW)]; LC50FM, concentration causing 50% fathead minnow to die, log10 [(mg/L)/(1000 × MW)]; concentration causing 50% of daphnia magna to die, log10 [(mg/L)/(1000 × MW)].
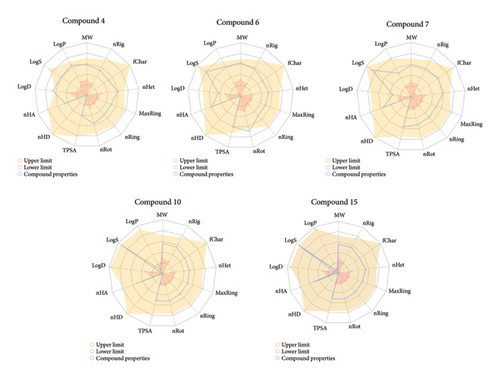
For a compound to be a biologically suitable candidate, it should possess number of hydrogen bond acceptors (nHA)—0 to 12; number of rotatable bonds (nRot) 0–11; topological polar surface area (TPSA)—0 to 140 based on Veber rule; logarithm of aqueous solubility value (logS)—4 to 0.5 log mol/L; logarithm of n-octanol/water distribution coefficient (logP)—0 to 3 log mol/L and logarithm of n-octanol/water distribution coefficient at pH 7.4 (logD)—1 to 3 log mol/L. The compounds with molecular weight less than 500 g/mol are more potent to be drug candidate as they are transported and diffused. The logP value measures the lipophilic potency; the compound with higher logP does not pass through the cellular membrane [66]. Bioavailability radar gives a quick glance at physicochemical properties (Figure 6).
The quantitative estimate of drug-likeness (QED) value is output from the integration of eight drug-likeness properties, with a higher score for attractive compounds. QED values lie between 0 (all properties unfavourable) to 1 (all properties favourable) [67]. Synthetic accessibility (SA score) less than 6 indicates easily synthesizable compounds. The higher the natural product-likeness (NP) score, the higher the probability of a molecule being a NP. Halides and dichloroacetate have a higher score of 0.274 and 0.203. The compounds following the Lipinski rule MW ≤ 500; logP ≤ 5; Hacc ≤ 10; Hdon ≤ 5, Pfizer rule, and golden triangle have more favourable ADMET profiles [39, 68, 69]. None of the compounds has violated the PAINS alert. Among these seven compounds, Compounds 7, 10 and 15 should possess favourable properties. Synthetic accessibility score was good for all ligands.
Human colon adenocarcinoma cell lines (Caco-2 cell) permeability is considered an important index for an oral drug due to morphological and functional similarity with the human intestinal epithelium [70, 71]. All selected candidates have a little bit of poor permeability. The apparent permeability coefficient (Papp) for Madin-Darby canine kidney (MDCK) cell permeability is used to effectively absorb chemicals into the body. The compounds have high passive MDCK permeability as the Papp value > 20 × 10−6 cm/s [72]. P-Glycoprotein belongs to the ATP-binding cassette transporter family. The P-glycoprotein inhibitor (P-gp-inh) and P-glycoprotein substrate (P-gp-sub) values denote the probability of being the corresponding molecule [73]. The p-gp substrate may either enhance or inhibit the pharmacokinetic implications [74]. The red, green and yellow colours in the human intestinal absorption (HIA) column indicate the probability of being a molecule with low, medium and high absorption, parading that Compounds 4, 6 and 10 have better absorption. F20% (human oral bioavailability 20%) and F30% (human oral bioavailability 30%) indicate how efficiently the drug is delivered to the human biological system [75]. Compounds 4 and 10 have better oral bioavailability than 6, 7 and 15 (Table 5).
The compounds that bind to plasma protein (plasma protein binding) in higher amounts have a low therapeutic index and lower fraction unbound (Fu) because they diffuse through the cell membranes less efficiently [76]. The volume of distribution (VD) was considered proper if it lies in the range 0.04–20 L/kg as the value denotes the in vivo distribution of drugs [77]. The peripheral targeting drugs should have little blood–brain barrier (BBB) permeability [78]. Compounds 7, 10 and 15 are found to have better distribution in systematic circulation.
The isozymes of cytochrome P450 family 1A2, 2C19, 2C9, 2D6 and 3A4 metabolise two-thirds of known drugs in Phase I process of drug metabolism and catalyse cholesterol and steroid synthesis [5]. The study of being inhibitor and substrate of cytochrome isozymes is necessary to know the effectiveness and to improve the pharmacokinetics of anticancer medication. The values in Table 7 denote the probability of being substrate/inhibitor [79].
The clearance of drugs (CL) informs about the frequency of dosing required for the drug [80]. CL values lying in the range of 5–15 mL/min/kg denote moderate clearance. The values lying between 0 and 1 indicate the probability of being a molecule with T1/2 less than or equal to 3. The half-life of a drug (T1/2) is predicted by involving both factors—clearance and VD (Table 8).
The human ether-a-go-go (hERG)–related gene encodes a voltage-gated potassium channel which is responsible for proper cardiac activity, and blockade of hERG may cause other life-threatening diseases [81]. The output value denotes the probability of being a molecule with IC50 more than 10 μm. All other factors of toxicity are predicted in terms of the probability of a molecule being toxic, within the range of 0 to 1. Human hepatotoxicity (H-HT) and drug-induced liver injury (DILI) factors can predict the adverse effects on the liver which may cause the late withdrawal of drugs from the market. Mutagenicity and carcinogenicity (TD50 values) are interrelated; the mutagenic effect is predicted by AMES toxicity. Rat oral acute toxicity (ROA in mg/kg), skin sensitisation (skinSen), eye corrosion (EC) and eye irritation (EI) factors are evaluated to determine how much drug candidate is safe for our skin and eyes. The maximum recommended daily dose (FDAMDD in mmol/kg-bw/day) value predicts the threshold amount of toxic dose. The diagnosis of respiratory toxicity is delayed because it does not show distinct symptoms but may lead to mortality (Table 9).
Bioconcentration factor is the ratio of the chemical concentration in biota to that in water at a steady state. Bioaccumulation is the absorption of chemical concentrations present in water bodies via a nondietary route, and it may lead to health issues. IGC50 is the concentration of chemical causing 50% growth inhibition of Tetrahymena pyriformis after 48 h, LC50FM is the concentration of compound causing 50% fathead minnow to die after 96 h, and LC50DM is the concentration of drug causing 50% of Daphnia magna to die after 48 h. The environmentally toxic compounds may possess secondary poisoning potential and affect human health via the food chain.
Based on pharmacological evaluation, Compounds 4, 7, 10 and 15 were found more suitable for further studies.
3.6. MDS Analysis
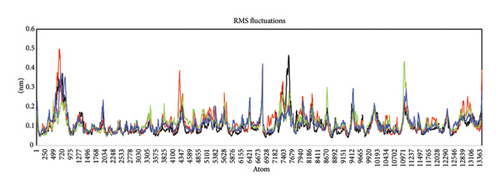
The RMSD, RMSF and radius of gyration were examined as a function of time, and the kinetic energy of the complex was also evaluated in kj/mol. The RMSF value determines the flexibility of individual residues during simulation. The average RMSF value for Compounds 4, 7, 10 and 15 was lying in the range of 0.05–0.15 nm presenting little fluctuation and better stability of binding amino acid residues (Figure 7(a)). The lower RMSF value indicates the less flexibility of amino acid residues lying on the binding site.
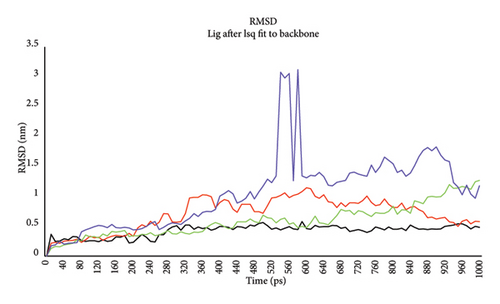
RMSD was calculated for four potent ligands—Compounds 4, 7, 10 and 15. The RMSD value steadily increases to 200 ps for all ligands and then reaches a maximum of 1 nm throughout the simulation for Compounds 4, 7 and 10, but Compound 15 has shown a bit more deviation (Figure 7(b)). The MD of Compound 4 has shown consistent stability as its RMSD value is lower than 0.5 nm throughout the simulation. The protein and Compound 15 complex presented the most instability because its RMSD value swayed considerably.
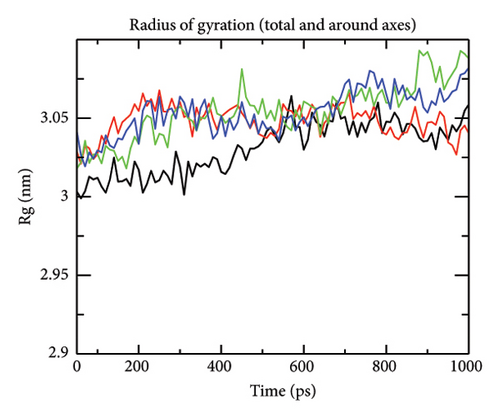
The radius of gyration values (a measure of compactness) for receptor–ligand complexes was determined between 3 and 3.05 nm till 700 ps and then remained stabilised for Compounds 4 and 7 but increased up to 3.09 for Compound 10 and Compound 15 (Figure 7(d)). The lower value of Rg indicates the higher compactness that results from increased interaction between protein and ligand.
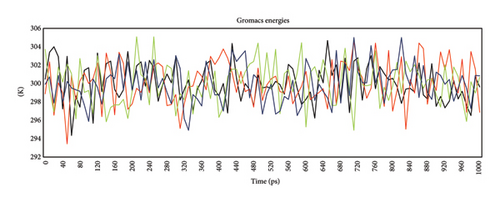
The kinetic energy of the complexes was lying between 2.13 × 10⁵ and 2.16 × 10⁵ kJ/mol. The results interpreted from molecular dynamic simulation confirmed the stability of receptor–ligand complexes. Compound 7, Compound 10 and Compound 15 can be possible drug candidates with good binding energy values (Figure 7(c)).
4. Conclusion
The study focuses on screening of 1,3-benzodioxole-tagged formylbenzyl-N, N-dimethylmethanaminium derivatives using computational methods. Based on binding energy and intermolecular nonbond interactions, Compound 4 (−333.8 kcal/mol), Compound 6 (−328.5 kcal/mol), Compound 7 (−361.33 kcal/mol), Compound 10 (−345.4 kcal/mol) and Compound 15 (−321.85 kcal/mol) have shown a significant effect on tubulin protein. The pharmacokinetic studies revealed the suitability of Compounds 4, 7, 10 and 15 as biological candidates. The molecular weight of Compound 4 (450.14 g/mol), Compound 7 (447.1 g/mol), Compound 10 (425.08 g/mol) and Compound 15 (411.13 g/mol) lies below 500 g/mol, and the number of rotatable bonds lies within the parameter of Lipinski’s rule. The parameters considered for medicinal chemistry revealed that Compound 7, Compound 10 and Compound 15 can have better applications as they possess QED scores closer to 1 than others; easily synthesizable, following Lipinski rule, Pfizer rule and Golden Triangle rule. Considering absorption properties, the HIA value is good for Compound 4 (0.057), Compound 6 (0.304) and Compound 15 (0.554); F (20%) is 0.2 for Compound 4 and 0.006 for Compound 10. Compound 7, Compound 10 and Compound 15 have shown high therapeutic index as PPB and Fu values are 89.18% and 8.39%; 73.91% and 25.26%; 87.42% and 8.80%, respectively. The value of CL has shown moderate clearance for Compound 4, Compound 6 and Compound 7. Compound 7, Compound 10 and Compound 15 are safer in use as parameters for hERG, and H-HT lies in the recommended range. Compound 6 and Compound 7 may cause skinSen but would not cause any harm to the eyes. The simulation studies interpreted the stability of docked complexes by RMSF, RMSD, radius of gyration and kinetic energy. Our study suggests that in silico studies could be of great importance in drug discovery by reducing the time and cost of the therapeutic process, and IL derivatives of 1,3-benzodioxole could be promising anticancer agents after improving a few pharmacokinetic properties and commencing some confirmatory analysis for their better efficacy in treatment.
4.1. Potential Synthesis Route
Piperonyl bromide or 5-(bromomethyl)-1,3-benzodioxole can be prepared from piperonyl alcohol using a bromination agent. Then, piperonyl bromide can be further reacted with 4-(dimethylamino) methyl benzaldehyde to obtain 1-(benzo[d][1,3]dioxol-5-yl)-N-(4-formylbenzyl)-N,N-dimethylmethanaminium bromide, followed by metathesis reaction.
Conflicts of Interest
The authors declare no conflicts of interest.
Funding
This study was supported by Council of Science & Technology, Uttar Pradesh, India (Project ID-3445).
Acknowledgments
We would like to express our heartfelt gratitude to the Baba Mastnath University, Rohtak, Islamic Azad University, Shoushtar, Iran and SRM Institute of Science & Technology, Delhi-NCR Campus, Modinagar, for their unwavering support. Dr. Ravi Tomar would also like to acknowledge the generous financial support provided by the Council of Science & Technology, Uttar Pradesh (Project ID: 3445).
Supporting Information
Table S1: Optimisation details. Table S2: Physicochemical properties of selected compounds estimated by the ADMETlab 2.0 server. Table S3: The pharmacokinetic properties required for medicinal use of possible drug candidates. Table S4: The absorption properties are predicted by in silico method. Table S5: The distribution properties predicted by the in silico method. Table S6: The properties required to know the metabolic process of the compound are predicted by in silico method. Table S7: Excretion properties predicted by in silico method. Table S8: Toxicity profile of selected compounds. Table S9: Environmental toxicity factors estimated by the ADMETlab 2.0 server.
Open Research
Data Availability Statement
The data that support the findings of this study are available on request from the corresponding author.


