Effect of Particle Size on the Colorimetric Sensing of Vitamin D Using Aptamer-Conjugated Gold Nanoparticles
Abstract
In this study, a colorimetric sensor was developed for the sensitive and selective detection of vitamin D2 (VTD2). Gold nanoparticles (AuNPs) ranging in size from 5 to 67 nm were synthesized and coated with VTD2-specific aptamers for the detection of VTD2. The size, diameter distribution, and optical properties of the AuNPs were characterized using scanning electron microscopy (SEM), dynamic light scattering (DLS), and UV-Visible spectrophotometry. The sensitivity and specificity of the nanosensor for detecting VTD2 were evaluated. The specific binding of VTD2 to its complementary aptamers induced conformational changes that promoted AuNPs aggregation, resulting in detectable plasmonic shifts and visible color variations. Optimization of the size and plasmonic properties of the AuNPs was carried out to maximize sensor sensitivity, achieving robust detection across a broad VTD2 concentration range (0.1 μM–0.16 mM). The sensor demonstrated a different color transition and UV-Vis spectral shifts correlated with VTD2 levels, with smaller AuNPs exhibiting superior sensitivity. A linear decrease in absorbance was observed with increasing VTD2 concentrations, highlighting the sensor’s precision and reliability.
1. Introduction
Vitamin D functions as a steroid hormone in the human body and is present in the forms of vitamin D2 (VTD2) (ergocalciferol) and vitamin D3 (cholecalciferol), synthesized naturally through sunlight exposure and dietary intake [1–3]. This essential vitamin plays a critical role in various physiological processes, including regulating calcium and phosphorus levels, as well as maintaining bone health [4, 5]. In the liver, vitamin D undergoes hepatic hydroxylation by the enzyme 25-hydroxylase (CYP2R1) to form calcidiol (25(OH)D), which serves as the primary indicator for assessing vitamin D levels. Subsequently, in the kidneys, CYP27B1 enzyme catalyzes the conversion of 25(OH)D to 1,25-dihydroxyvitamin D [1,25(OH)2D], responsible for the majority of vitamin D’s biological actions [6, 7].
Numerous studies have linked vitamin D deficiency to various health issues, such as cardiovascular disease, dental problems, osteoporosis, diabetes, and cancer [7–9]. Detection methods for vitamin D levels include immunoassays (enzyme-linked immunosorbent assay (ELISA), chemiluminescent immunoassay (CLIA), radioimmunoassay (RIA)) and chromatographic techniques (high-performance liquid chromatography (HPLC), HPLC-mass spectrometry) [10]. Given their complexity and expense, there is increasing demand for more sensitive, cost-efficient, and rapid vitamin D detection methods [11, 12].
Aptamer-based colorimetric sensing methods have emerged as promising alternatives to antibodies in biosensing applications [13]. Aptamers, single-stranded nucleic acids, rapidly recognize and bind to target molecules through interactions such as van der Waals or electrostatic forces, producing detectable signals [14]. Aptamers offer significant advantages for such applications, being readily screenable, synthesizable, programmable in design, and amenable to chemical modifications [13, 15]. A solid-phase colorimetric apta-biosensor for thrombin detection was developed using dual aptamer-conjugated gold nanoparticles (AuNPs) on an APTES substrate, where target-induced aggregation and plasmonic coupling amplified spectral shifts and enabled detection at 3 μg/mL, with a UV-vis limit of detection (LOD) of 1.33 μg/mL, offering simplicity and rapid analysis [16].
Many reports have been published using aptamer as potential recognition for vitamins detection. Gupata et al. reported the fabrication of graphene oxide and fluorescent aptamer-based biosensor for the detection of 25-hydroxyvitamin D3, with LOD of ca. 0.075 μg/mL [17]. Microcantilever-based aptasensor has been developed by Alzahrani et al. for the detection of vitamin D [18]. The study demonstrated a direct correlation between the concentration of vitamin D and both the deflection of the microcantilever and the frequency shift within a concentration range spanning from 1 to 300 nM, with the LOD of 0.3 nM. Cai et al.’s study showed that a label-free biosensor utilizing an aptamer-modified electrode with AuNPs demonstrated accurate and sensitive detection of 25-hydroxyvitamin D3 (25(OH)D3) over a broad concentration range (1.0–1000 nM) with a low LOD (1.0 nM), showing potential as a cost-effective and portable diagnostic tool for 25(OH)D3 assessment, with minimal interference from structurally similar molecules such as 25(OH)D2, vitamin D3, and VTD2 [19].
Recent advancements have seen aptamers immobilized on AuNPs surfaces, preventing aggregation induced by salt [20, 21]. AuNPs exhibit unique optical properties, allowing them to serve as versatile colorimetric indicators capable of detecting a range of targets [22, 23]. Many reports have been published on AuNP-based colorimetric assays for detecting DNA, proteins, metal ions, and small molecules [24, 25]. A novel nonaggregation colorimetric sensor based on gold nanorods was developed for the rapid and sensitive detection of vitamin C (Vc), exhibiting a low detection limit and practical utility in real samples, with changes in plasmon absorption wavelengths indicating Vc concentration [26]. A study explored the use of aptamer-conjugated AuNPs for colorimetric detection of antibiotics in raw milk, developing a preanalytical strategy to mitigate the influence of milk matrix components, enabling the detection of antibiotic residues at concentrations as low as 0.25-fold the maximum residue limits (MRLs) set by European and Chilean legislation, showcasing potential for semiquantitative analysis directly from dairy farms [27].
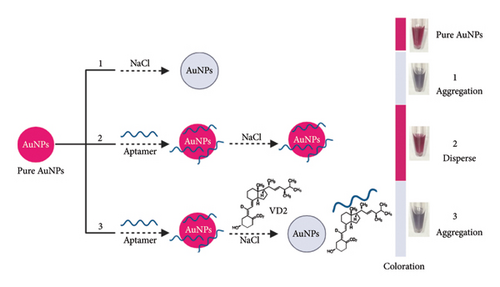
Aptamer-based biosensors’ sensitivity and selectivity depend critically on the surface area of AuNPs, which is governed by nanoparticle size. In this work, we present an optimized plasmonic colorimetric sensor for ultrasensitive detection of VTD2. We systematically investigated how AuNP dimensions (5–67 nm) influence the sensor’s performance. Aptamer-functionalized AuNPs were synthesized, and their size distribution, morphology, and plasmonic properties were characterized by dynamic light scattering (DLS), scanning electron microscopy (SEM), and UV-vis spectroscopy. The sensor operates via target-specific aggregation of AuNPs triggered by VTD2–aptamer binding, inducing measurable plasmonic shifts, see Scheme 1. By tuning nanoparticle size and optical properties, we achieved enhanced sensitivity and specificity, enabling precise quantification of VTD2.
2. Materials and Methods
2.1. Materials
VTD2 was purchased from Carbosynth Limited, Berkshire-UK. The aptamer (VD-APT) with catalog number 70 was obtained from Operational Technology Inc (OTC Biotech). Chloroauric acid (HAuCl4, ≥ 99.9%), sodium borohydride (NaBH4, 99%), ethanol (HPLC grade), and methanol (HPLC grade) were purchased from Sigma-Aldrich. Hydrochloric acid (HCl, 36%), sodium chloride (NaCl, > 99%), and sodium citrate (> 99%) were obtained from Fisher Scientific. All chemicals were used as received.
2.2. Synthesis of AuNPs
Prior to conducting the experiments, all glassware was cleaned using aqua regia, rinsed with distilled water, and dried before use. Different diameters of AuNPs were obtained by reducing various ratios of HAuCl4 with reducing agents such as sodium citrate and NaBH4, as shown in Table 1. AuNPs with diameters of 67, 31, and 23 nm were synthesized by modifying the published method by Wang et al. [28]. This involved heating a HAuCl4 solution to boiling under vigorous stirring. After 5 min, the sodium citrate solution was rapidly added to the boiling mixture and allowed to react to form the nanoparticles. This process was indicated by a color change in the solution over 10 min. The mixture was subsequently cooled down to room temperature (25°C) while stirring for an additional 15 min and then stored at 4°C in a dark beaker. The absorbance of the AuNPs solution was measured using a UV-nanodrop and SEM to determine the mean AuNPs size.
| Gold nanoparticle size (nm) | Reducing agent | HAuCl4 | Temperature |
|---|---|---|---|
| 67 | 0.2 mL, 38.8 mM sodium citrate | 25 mL, 0.3 mM | 135°C |
| 31 | 1 mL, 38.8 mM sodium citrate | 25 mL, 1 mM | 135°C |
| 23 | 9 mL, 38.8 mM sodium citrate | 12.5 mL, 1 mM | 135°C |
| 5 | 0.25 mL, 10 mM sodium citrate, and 0.3 mL, 100 mM NaBH4 | 0.25 mL, 9.7 mM | Room temperature |
AuNPs with a 5 nm diameter were obtained using a three-step synthesis method by Kesik et al. [29]. In the first step, 0.25 mL of 10 mM HAuCl4 was mixed with 9.5 mL of deionized water until homogeneous. Next, 0.25 mL of 10 mM sodium citrate was added to the mixture and stirred for 10 min. Finally, 0.3 mL of freshly prepared, ice-cold 100 mM NaBH4 solution was added, followed by vigorous stirring at 1000 rpm for 1 min. The solution was then left undisturbed for 3 h at room temperature (25°C).
2.3. Detection of VTD2
Adsorption reactions were conducted of VTD2 aptamer for all different diameters of AuNPs. AuNPs (100 μL) were incubated with freshly prepared VTD2 aptamer solution (50 μL) at room temperature and measured UV-vis absorption after 5 min.
To optimize the concentration of salt for all experiments, 100 μL of AuNPs, 150 μL of AuNPs−aptamer, and 200 μL of AuNPs−aptamer−VTD2 were incubated in 1 mL microtubes. Different volumes of NaCl solution (0–12 μL, 0.5 mM) were systematically added to the mixture. After each addition, the samples were gently mixed and incubated at room temperature for 5 min. Finally, the degree of aggregation was determined by UV-vis absorption.
The sensing test was conducted of VTD-3 for all different diameters of AuNPs. The sensing assay was performed by incubating 100 μL of aptamer-conjugated AuNPs with 50 μL of varying concentrations of VTD-3 for 10 min at room temperature. Subsequently, an optimized volume of NaCl solution (0.5 M) was added to induce controlled aggregation: 10 μL for 67 nm and 31 nm AuNPs and 8 μL for 23 and 5 nm AuNPs. The mixture was incubated for 15 min, and aggregation kinetics were monitored via UV-vis absorption spectroscopy (Thermo Scientific NanoDrop 1000).
Stock standard solution (1 mM) of VTD2 was prepared by dissolving VTD2 powder (3.97 mg) in 10 mL of a mixture of ethanol/DI-water and incubated at ultrasonication for 2 min at room temperature. The stock solution (1 mM) of VTD2 was diluted in DI-water for further dilutions to reach 0.976 μM concentrations. All aqueous target solutions were made freshly daily.
2.4. Characterization and Measurement
Topological images of AuNPs were obtained from transmission electron microscopy (TEM, JEOL JEM-1230) by placing 10 μL of AuNP sample onto a carbon-coated copper grid and dried under vacuum. Thermo Scientific NanoDropTM One/On Spectrophotometer was utilized in the adsorption study. The surface zeta potential and particle size of the samples were determined using Zetasizer Nano ZS equipped with a 633 nm laser (Malvern Instruments, UK) at 25°C.
3. Results and Discussion
3.1. Characterization of AuNPs
AuNPs with average sizes of 5, 23, 31, and 67 nm were synthesized using a modified Turkevich methodology. Different amounts of NaBH4 and trisodium citrate were used as reducing agents. The nanoparticles were characterized using UV-vis spectroscopy, SEM, and DLS. The optical properties of the synthesized AuNPs were determined by UV-vis spectroscopy within the wavelength range of 450–600 nm. The UV-vis absorption spectra, as depicted in Figure 1(a), revealed characteristic absorption peaks at 505, 520, 536, and 540 nm for nanoparticles with average diameters of 5, 23, 31, and 67 nm, respectively. These peaks and their corresponding curve appearances indicate size-dependent plasmonic behavior of the AuNPs.
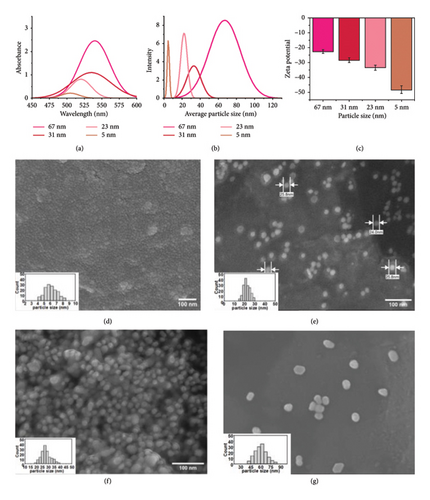
The hydrodynamic diameters of the AuNP dispersions in distilled water were determined by DLS, Figure 1(b). As expected, the DLS-measured sizes were larger than those observed by SEM, as the hydrodynamic diameter accounts for the AuNP core, its capping layer, and the associated hydration shell. Zeta potential measurements indicated negative values for all AuNP sizes (Figure 1(c)), confirming the successful coating of the nanoparticles with a negatively charged trisodium citrate layer, which ensured their colloidal stability.
The morphology and size distributions of the AuNPs were further confirmed by SEM analysis (Figures 1(d), 1(e), 1(f), and 1(g)). The nanoparticles exhibited predominantly spherical shapes with narrow size distributions. The average diameters, calculated using ImageJ software, were consistent with the targeted sizes of 5, 23, 31, and 67 nm.
Table 2 presents the determination of AuNP size and absorption maxima (λmax) using experimental characterization techniques, including DLS and SEM, alongside theoretical particle sizes calculated from UV-vis absorption maxima, based on the method reported in literature [30]. The data demonstrate that the experimentally measured particle sizes align well with the theoretical predictions, validating the reliability of UV-vis spectroscopy as a predictive tool for nanoparticle size estimation.
| Sample (nm) | λmax (nm) | Particle size (nm) calculation versus used methods | ||
|---|---|---|---|---|
| DLS | SEM | Theoretical [30] | ||
| 5 | 512 | 4.5 | 5.5 | 3.6 |
| 23 | 520 | 24.8 | 21.9 | 20.6 |
| 31 | 535 | 34.5 | 28 | 31.8 |
| 67 | 540 | 69.2 | 63.7 | 67.4 |
3.2. Optimization of the Experimental Conditions
To develop a colorimetric aptasensor based on AuNPs, assay conditions including NaCl concentration, NaCl with the aptamer (VD-APT), and NaCl with VTD2 were optimized. The concentration of NaCl plays a critical role in inducing AuNP aggregation. Thus, the first step involved determining the minimum NaCl concentration required to induce aggregation, assessed by changes in the absorption peak ratio from the UV-vis spectrum for each AuNP diameter and corresponding changes in solution color.
The stability of AuNPs was investigated by treating nanoparticles of different diameters with varying volumes of NaCl (0.5 mM), ranging from 0 to 12 μL, added to a final solution volume of 100 μL. As shown in Figure 2(a), AuNPs remained stable at low NaCl concentrations, with minimal aggregation observed. However, increasing NaCl concentration disrupted the electrostatic equilibrium of the AuNP surface, leading to aggregation. This effect was reflected in a gradual decrease in absorbance at the characteristic plasmonic peak for all AuNP sizes, as shown in Figures 2(c), 2(d), 2(e), and 2(f).
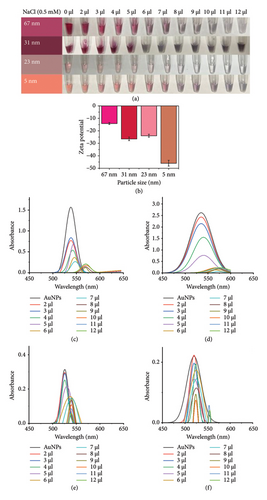
The zeta potential measurements further confirmed these observations. At a NaCl concentration of 12 μL, the zeta potentials of the AuNPs were approximately −14, −26, −24, and −46 mV for nanoparticles with diameters of 67, 31, 23, and 5 nm, respectively (Figure 2(b)). These results indicate that the smaller AuNPs (−46 mV for 5 nm) exhibited greater electrostatic stability compared with larger AuNPs, which contributed to their differential aggregation behavior under increasing NaCl concentrations.
The concentration of aptamers plays a critical role in determining the sensitivity and performance of colorimetric assays. Single-stranded DNA has been shown to bind effectively to AuNP surfaces, stabilizing them under various conditions. To evaluate the compatibility of VD-APT with AuNPs of different diameters and to confirm that aptamer-functionalized AuNPs remain stable without aggregation, salt-induced aggregation experiments were conducted.
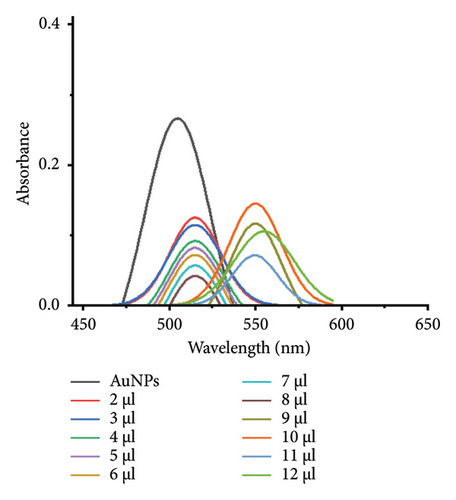
The minimum concentration of VD-APT required to stabilize AuNPs of all sizes was determined to prevent excess, nonfunctional aptamers that could reduce colorimetric sensing sensitivity. In this experiment, 100 μL of colloidal AuNPs was incubated with 50 μL of VD-APT for 5 min, followed by the addition of varying volumes of 0.5 mM NaCl. After a 5 min incubation period, solution color changes were monitored visually, and UV-vis spectrophotometry readings were recorded (Figure 3).
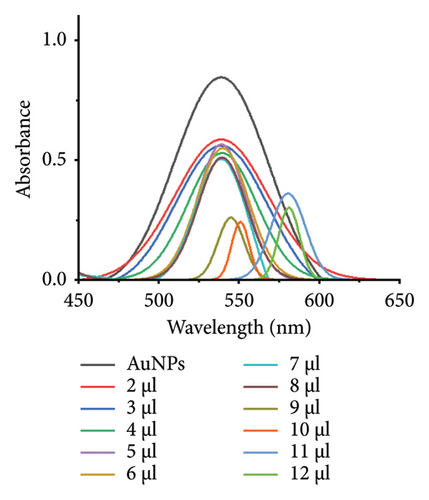
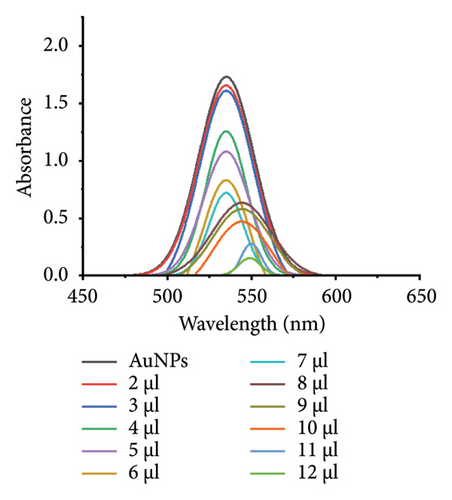
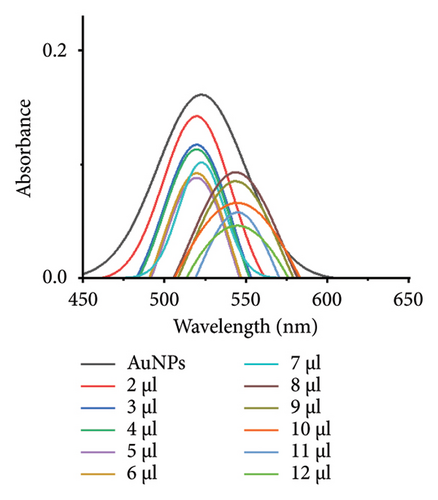
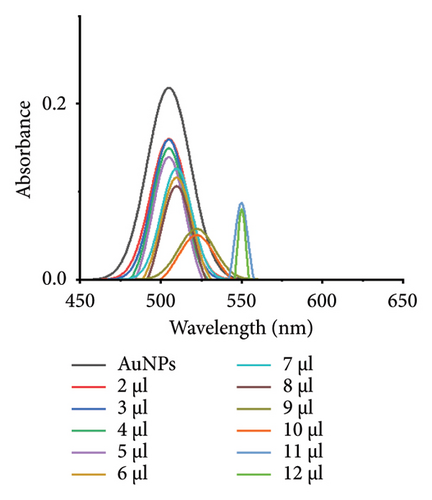
The results indicated that at the optimal NaCl concentration—defined as the minimum stabilization threshold—no color change occurred in the solution. This finding confirmed that the VD-APT effectively shielded the AuNPs from NaCl-induced aggregation across all nanoparticle sizes. The stability provided by the aptamer coating ensures robust colorimetric sensing while minimizing the impact of nonspecific interactions.
The compatibility of VD-APT with VTD2 was evaluated by analyzing the aggregation behavior of AuNPs conjugated with aptamers under varying NaCl concentrations in the presence of VTD3. Initially, 150 μL of AuNP−aptamer conjugates were incubated for 5 min to ensure uniform particle distribution and surface area. Subsequently, 50 μL of 1 mM VTD2 was added and incubated for an additional 5 min. Following this, varying volumes of 0.5 mM NaCl were added to the mixture, and the resulting aggregation behavior was monitored.
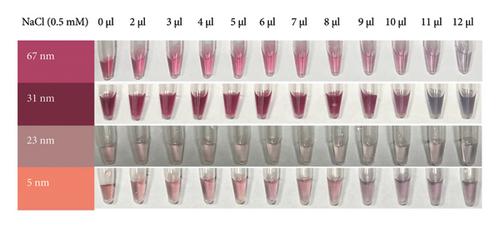
At the optimal NaCl concentration—deemed the minimum stabilization threshold for AuNPs of all diameters—a visible color change was observed. In the absence of VTD2, the aptamers remained bound to the AuNP surfaces, effectively shielding the nanoparticles from aggregation. However, in the presence of VTD2, the aptamers preferentially bound to VTD2 molecules, losing their stabilizing effect on the AuNPs, which subsequently aggregated upon NaCl titration. Figure 4 illustrates the observed color changes and corresponding UV-vis spectrophotometry results for AuNPs of different sizes, demonstrating the specificity and functionality of the VD-APT in detecting VTD2 through this aggregation-based mechanism.
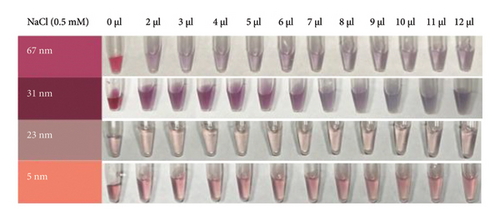
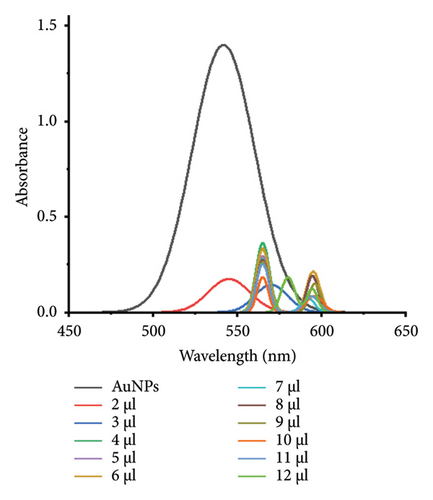
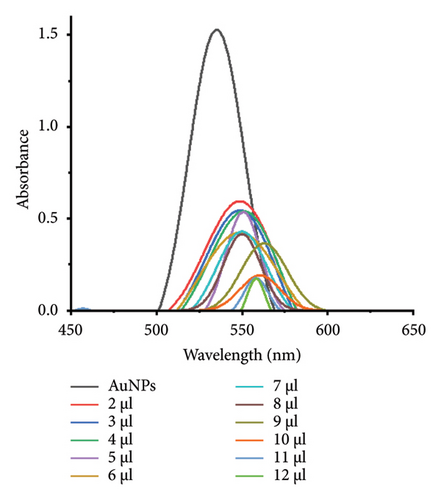
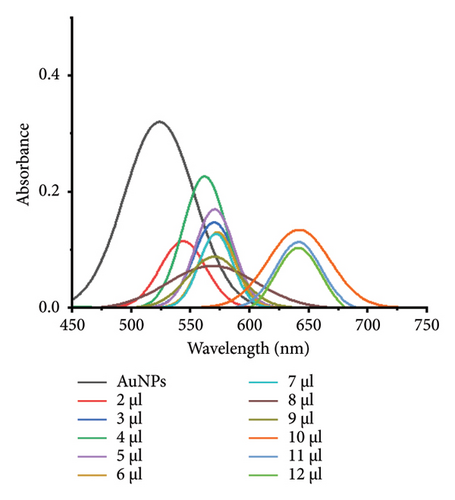
DLS) was employed to assess the surface zeta potential of the synthesized AuNPs with diameters of 67, 31, 23, and 5 nm, as shown in Figure 5. The DLS measurements revealed that the zeta potential varied with surface modifications, reflecting changes in surface charge. The synthesized AuNPs exhibited negative zeta potentials, attributed to the presence of citrate ions stabilizing the AuNP surfaces. Interestingly, the zeta potential measurements showed size-dependent differences, with values of −33, −33, −40, and −15 mV for nanoparticles with diameters of 67, 31, 23, and 5 nm, respectively. The less negative zeta potential observed for the smallest AuNPs (5 nm) can be attributed to their higher surface curvature, which limits the efficient adsorption of citrate ions. Smaller nanoparticles have a higher surface area-to-volume ratio but present a highly curved surface that reduces the effective binding of citrate ions due to steric effects and lower accessibility. This phenomenon aligns with observations reported in previous studies, where highly curved nanoparticle surfaces were shown to exhibit reduced affinity for biomolecule adsorption compared to larger particles. For instance, proteins adsorbed less efficiently onto nanoparticles smaller than 10 nm, forming incomplete layers due to steric hindrance and reduced available surface area for individual molecules [31–33]. Similarly, in our study, the reduced citrate coverage on smaller AuNPs likely contributed to the less negative zeta potential (−15 mV) compared with larger particles, which exhibited more uniform and extensive citrate ion adsorption. These observations underscore the critical role of nanoparticle size and curvature in determining surface charge and colloidal stability. Understanding these size-dependent effects is essential for optimizing AuNP behavior in applications such as sensor development, where surface charge plays a pivotal role in functionalization and aggregation dynamics.
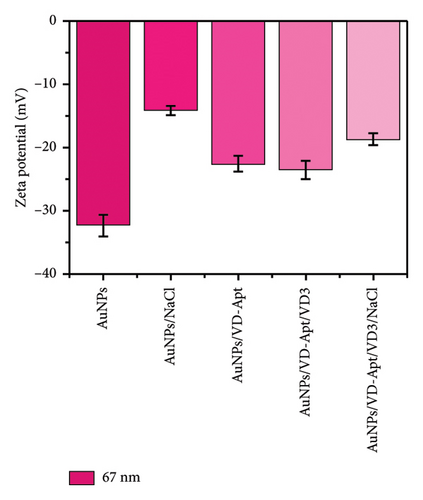
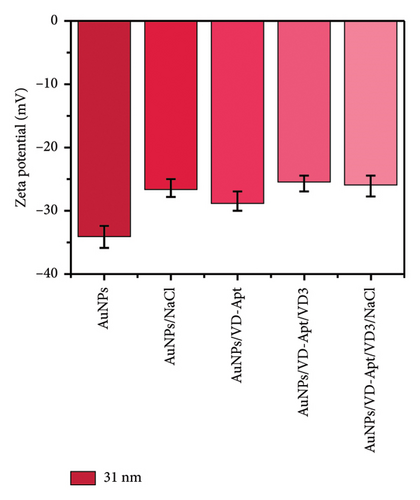
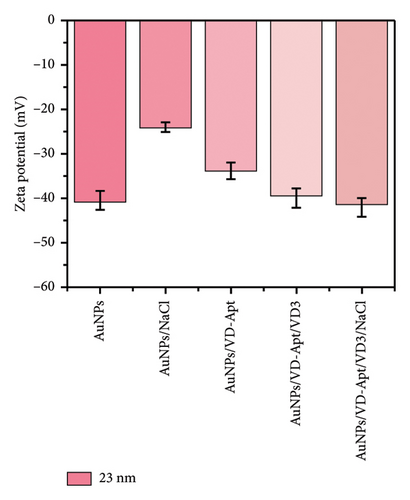
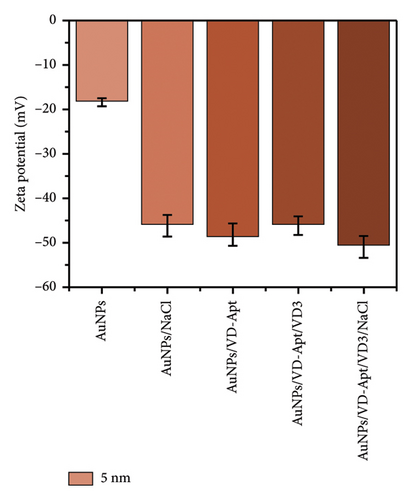
Upon titration with NaCl, the stability of the AuNPs decreased due to the disruption of electrostatic equilibrium, leading to particle aggregation. The resulting zeta potentials for the aggregated AuNPs were approximately −14, −26, −24, and −46 mV, corresponding to the 67, 31, 23, and 5 nm particles, respectively.
In the presence of the VD-APT aptamer, no aggregation occurred after salt addition, as the aptamer partially neutralized the negative surface charge of the AuNPs. This resulted in less negative zeta potentials, indicating effective stabilization. However, when VTD2 was introduced and subsequently titrated with NaCl, particle aggregation was observed, accompanied by a visible color change. The zeta potentials of the aggregated particles reverted to values similar to those of the unmodified AuNPs, with approximate values of −32, −0.6, −35, −40, and −20 mV, depending on the particle size. These results suggest that the aptamer was desorbed from the AuNP surfaces upon binding to VTD2, thereby exposing the nanoparticles to aggregation. This behavior underscores the specificity of the VD-APT aptamer for VTD and its impact on the colloidal stability of AuNPs under salt-induced conditions.
3.3. Colorimetric Sensing of VTD2
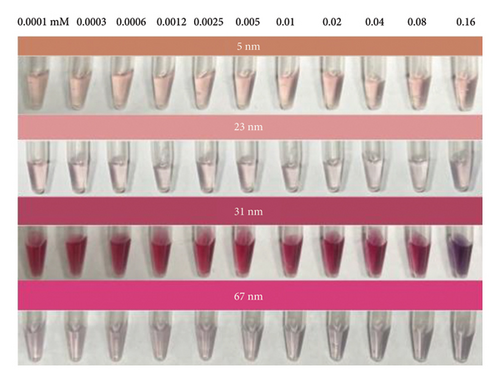
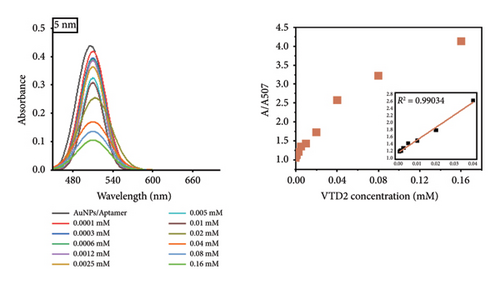
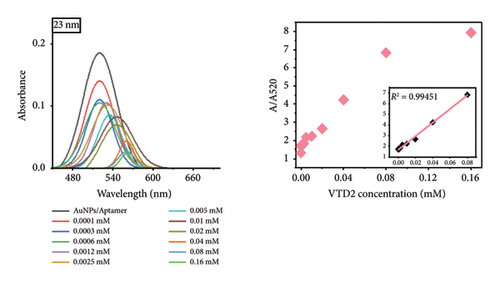
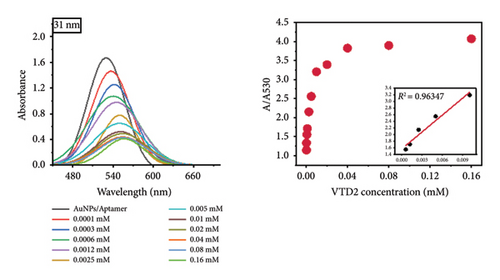
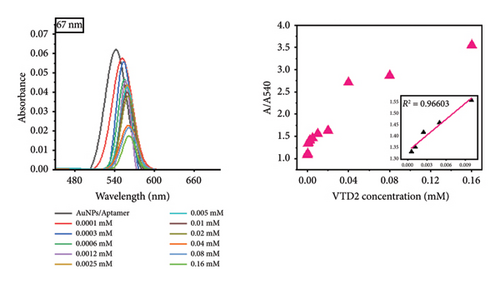
Notably, the 31 nm AuNPs exhibited the lowest LOD (0.005 mM), outperforming even smaller nanoparticles (5 nm: 0.006 mM and 23 nm: 0.009 mM), which could be attributed to their optimal balance of aptamer surface density, colloidal stability, and plasmonic response. Nevertheless, the lowest LOD was found to be 0.02 mM for 67 nm particle size.
The observed size-dependent sensitivity aligns with the unique physicochemical properties of AuNPs. Smaller nanoparticles (5–23 nm) demonstrated enhanced responsiveness to low VTD2 concentrations, as evidenced by pronounced localized surface plasmon resonance (LSPR) peak shifts (> 50 nm at 0.01 mM VTD2 for 5 nm particles) compared with larger counterparts (31–67 nm: < 30 nm shifts at equivalent concentrations). The enhanced sensitivity of smaller AuNPs arises from their greater surface reactivity and intensified plasmonic coupling from closer interparticle proximity during aggregation. However, the superior LOD of 31 nm AuNPs suggested a critical trade-off between surface reactivity and aggregation kinetics. While 5 nm particles exhibited greater theoretical sensitivity, their tendency toward nonspecific aggregation likely increased baseline noise, slightly elevating their practical LOD. As shown in Figure 6, the color transition correlated with increasing VTD2 concentrations across all particle sizes. AuNPs (> 31 nm) exhibited color gradients, enabling semiquantitative naked-eye detection at concentrations as low as 0.009 mM (23 nm) whereas larger particles (67 nm) required higher analyte levels (> 0.02 mM) for visual interpretation.
4. Conclusions
The optimized plasmonic aptamer–AuNP sensor successfully enabled sensitive detection of VTD2. AuNPs functionalized with a VTD2-specific ssDNA aptamer combined the large LSPR response of AuNPs with the high affinity of aptamers for small-molecule target. In practice, the assay produced clear color changes and corresponding UV-vis spectral shifts proportional to VTD2 concentration. Under optimal conditions, the sensor exhibited a linear response from 0.1 μM up to 0.16 mM VTD2. Such a broad dynamic range and the aptamer’s molecular specificity underscore the high of the system. Fine control of nanoparticle size and salt conditions was critical for performance. Five nm AuNPs required 8 μL of 0.5 M NaCl to trigger aggregation, giving the largest color transition with a LOD of ≈ 6 μM. Under the same salt volume, 23 nm AuNPs also aggregated with LOD ≈ 9 μM. A larger 31 nm AuNP preparation needed 10 μL NaCl to fully aggregate but achieved the highest sensitivity (LOD ≈ 5 μM). In contrast, the largest 67 nm AuNPs (10 μL NaCl) only showed noticeable aggregation at high VTD2 levels (LOD ≈ 20 μM). These observations highlight that intermediate AuNP sizes (∼30 nm) gave the best balance of stability and sensitivity.
Conflicts of Interest
The authors declare no conflicts of interest.
Funding
The authors extend their appreciation to the Deputyship for Research & Innovation, Ministry of Education in Saudi Arabia for funding this research work through the project number (DRI-KSU-958).
Open Research
Data Availability Statement
All data generated or analyzed during this study are included within the article.


