Elimination of Escherichia coli in a Packed Column Containing Jujube Seed Kernel Granular Activated Carbon Coated With Silver Nanoparticles (Ag-NPs/GAC)
Abstract
This study aims to develop a filter material capable of inhibiting bacterial growth and eliminating microorganisms from filtered water. Granular activated carbon (GAC) was prepared from jujube seed kernels by a chemical activation method whereby the kernels were heated at 650°C for 3 h in the presence of varied concentrations of phosphoric acid (H3PO4) (1, 2 and 3 M). Silver nanoparticles (Ag-NPs) were prepared using the polysaccharide reduction method with AgNO3 at two concentrations (2 and 4 mmol). The Ag-NPs obtained were characterised by a UV–visible spectrophotometer, optical microscope and microorganism inhibition test. GAC was coated with Ag-NPs by impregnating it with a fixed concentration of Ag-NPs in a supersaturated solution. The resulting GAC and Ag-NPs/GAC were characterised using several methods (pH, point zero charge and FTIR). The leakage of Ag fixed on GAC was evaluated. The antimicrobial properties of the synthesised Ag-NPs/GAC were investigated using inhibition zone, impregnation and column techniques against E. coli. The best nanoparticle shape with a large reactive surface was obtained after treatment with 2 mmol of AgNO3. There was no leaching of Ag ions in the treated water after passage through the bed. Except for the GAC not impregnated with Ag-NPs, no E. coli CFU/mL was found in the filtered water obtained from Ag-NPs/GAC beds at all tested pHs after 2–3 days of operation.
1. Introduction
Due to the rapid growth of the world’s population and the effects of global warming, the scarcity of clean water sources is growing exponentially. As a result, it has been recognised that the most effective way to conserve limited freshwater resources is the judicious use of water and the reuse of treated wastewater for multiple purposes [1–4]. The presence of bacteria is a significant indicator of polluted water. The contamination of water by bacteria is a major concern, as it often leads to health problems and changes in water characteristics such as odour and colour. Waterborne pathogens including Escherichia coli, Shigella spp, Salmonella spp, Vibrio spp and Cryptosporidium are known to cause adverse public health effects [5–7]. In 2023, the World Health Organization (WHO) reported that 80% of diseases can be traced back to contaminated drinking water. According to WHO guidelines, drinking water should be free of fecal and total coliforms [8]. However, several chlorine-based disinfection methods that are effective in killing microbial pathogens can also produce harmful carcinogenic disinfection by-products (DBPs). This occurs in the presence of natural organic matter (NOM), anthropogenic contaminants, bromide and iodide [9–11]. Ultraviolet (UV) water disinfection systems are expensive and require an energy source. Additionally, UV can produce dangerous DBPs when used with NOM and even more so when used with chlorine [12–14]. Recently, reverse osmosis membranes have also been used for water disinfection. However, the membranes are expensive, and biofouling occurs over time [15, 16]. New and innovative disinfection techniques and approaches must be developed to produce safe, inexpensive drinking water.
Granular activated carbon (GAC) is a powerful adsorbent capable of removing a broad range of contaminants from aqueous environments [5, 17–22]. Its widespread application is due to its exceptionally large surface area, microporosity and the presence of functional groups on its surface. Nevertheless, the porous nature of activated carbon (AC) gives the possibility for bacteria to grow in the pores, potentially leading to recontamination of the treated water over time. Environmental applications of nanomaterials have attracted considerable attention due to the rapid development of nanotechnology. In particular, their potential to revolutionise conventional water treatment processes that are centuries old has been recently highlighted [22–24]. Due to their large specific surface area and high reactivity, nanomaterials are excellent adsorbents, catalysts and sensors. Several natural and engineered nanomaterials have recently demonstrated potent antimicrobial properties [1, 25–29]. In contrast, when compared to traditional chemical disinfectants, these antimicrobial nanomaterials are not strong oxidising agents and are relatively inert in water. As a result, they are not expected to have any harmful impact. If properly integrated into treatment processes, they could have the potential to be a replacement or enhancement of traditional disinfection methods.
Silver is relatively nontoxic to human cells but highly toxic to bacteria such as Escherichia coli and Staphylococcus aureus, making it a safe and effective bactericidal metal [30–32]. This work aims to prepare silver nanoparticles (Ag-NPs)/GACs and to test their effectiveness in retaining and inhibiting bacterial growth in a filtration column without releasing silver ions into the water.
2. Materials and Methods
2.1. Jujube Seed Kernels
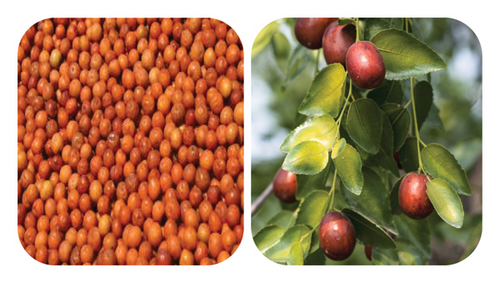
Figure 1 shows the mature jujube seed kernels provided by the water treatment and filtration research group of National Advanced School of Agro-Industrial Sciences (ENSAI).
2.2. Chemicals
All the chemicals used in this study were of analytical grade. Phosphoric acid (H3PO4) and silver nitrate (AgNO3) were obtained from Prolabo, France. Sodium hydroxide and hydrochloric acid (both at 0.1 M) were used for pH adjustments.
2.3. Preparation of GAC
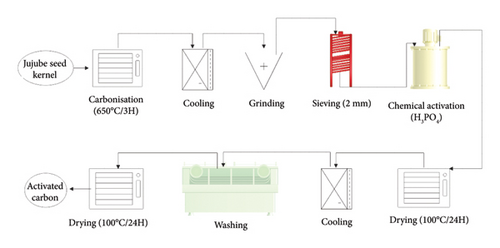
The carbonisation of the seed kernels (1 kg each batch) was performed at 650°C for 3 h in an oven (Nabertherm, Germany). After cooling, the charred products were ground using a mortar and pestle. The resulting samples were sieved through the 1.5-mm and 2-mm sieves to obtain particles of diameter between 1.5 and 2.0 mm, followed by chemical activation with H3PO4 solution (1, 2 and 3 M). Following the procedure described by Odebumi and Okeola [33], 50.0 g of the cleaned carbon sample was placed into beakers containing 500 mL of H3PO4 solution at different concentrations (1, 2 and 3 M). The contents were thoroughly mixed and heated until a paste was formed. Afterwards, they were transferred into crucibles and placed into an oven at 100°C for 3 h to vaporise the acid. The activated samples were allowed to cool at room temperature, after which they were washed using distilled water until the pH became neutral; the sample was then dried at about 80°C–100°C before coating them with Ag-NPs, following the procedure described by Dada et al. [34]. Figure 2 illustrates the production process of GAC.
2.4. Synthesis of Ag-NPs
To prepare Ag-NPs, we used the polysaccharide method described in [22, 29, 35, 36].
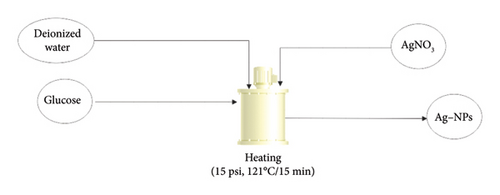
The method uses water, an environmentally friendly solvent, and glucose as a reducing and capping agent. Magnetic stirring was maintained throughout the Ag-NP synthesis experiment. The silver solution was prepared at 40 mM, and the amount of glucose was four times that of AgNO3, i.e., 0.68 g AgNO3 and 2.72 g glucose. Initially, glucose was dissolved in 20 mL of deionised water (Solution A) in a dark reaction flask, and different amounts of silver nitrate were dissolved in distilled water (Solution B) and injected dropwise at a constant rate of 1 mL min−1. The reaction mixture was then autoclaved at a pressure of 15 psi and a temperature of 121°C for 15 min, and a brown colloidal solution of Ag-NPs was obtained. Figure 3 illustrates the process of Ag-NP production.
2.5. Coating of GAC With Ag-NPs
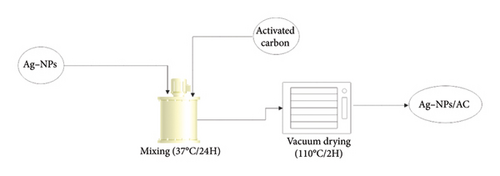
Fifty grams (50 g) of the treated GAC was immersed in 250 mL of Ag-NP solution at different concentrations (2 mmol and 4 mmol Ag) overnight at room temperature with vigorous stirring to achieve full coating. The silver-coated GAC was then cured in a vacuum oven at 110°C for 2 h to ensure complete coating of the GAC with Ag-NPs. The validation of the coating process involved comparing the weight difference of the GAC granules before and after coating and analysing the remaining silver in the solution using the Varian SpectrAA 50 atomic absorption spectrometer [22]. The process of coating the Ag-NPs is illustrated in Figure 4.
2.6. Characterisation of Ag-NPs
The surface plasmon resonance (SPR) property of the synthesised Ag-NPs was measured using Systronics UV-vis double-beam spectrophotometer 2202, and the morphological properties were determined using the Olympus CX43 optical microscope.
2.7. Antimicrobial Studies of Ag-NPs
The antibacterial property of Ag-NPs was evaluated using a zone inhibition test and indirect growth curve method (cell number vs. incubation time) for E. coli. For the inhibition zone test, 100 μL of E. coli grew overnight in Luria broth (LB) medium and was spread on a nutrient agar plate. The plates were then punctured and fed with a colloidal Ag-NPs solution and incubated at 37°C. The zone of inhibition was then measured after 24 h of incubation.
2.8. Characterisation of GAC and Ag-NPs/GAC
The multipoint Brunauer–Emmett–Teller (BET) surface area (m2/g), the pore size (nm), the micropore and Meso–macropore volumes (cm3/g) using surface and pore characterization device (Micromeritics ASAP 2020) (SBET) analysis were determined by the nitrogen (N2) gas adsorption technique in a liquid nitrogen environment at 77 K. Before the BET analysis, the temperature in the degassing treatment applied to the sample was 300°C, and the time was 360 min. The point of zero charge value (pHpzc) was also determined; pHpzc is the pH at which the net charge of the GAC surface is zero. Below this value, the surface carries a positive charge, and beyond pHpzc, the charge is negative. Infrared spectra of GAC and Ag-NPs/GAC were recorded with a Fourier-transform infrared (FTIR) spectrometer (Bruker, [Vertex-70]). The spectra of the sample were recorded in the range of 4000 cm−1 to 400 cm−1 wavenumbers.
2.9. Experimental Setup: Filtration Column
This analysis was performed to evaluate the ability of the prepared Ag-NPs/GAC to retain microorganisms. The filter column was used, and E. coli served as indicator bacteria.
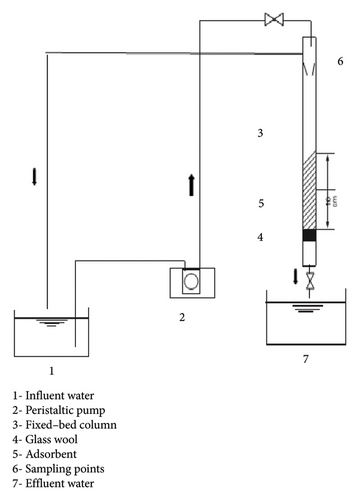
The experimental device used for the retention test is illustrated in Figure 5. A column with a capacity of 80 cm3, 40 cm height and outer and inner diameter of 2.00 and 1.6 cm, respectively, was used to determine bacterial retention on Ag-NPs/GAC. The column consists of a larger opening and a small outlet. At the top of the opening is a tube that helps remove excess water when the column is full. A tube with an adapted syringe is fitted to the outlet to regulate/vary the flow rate at the outlet. A GILSON Minipuls 2 pump was used to help aspirate the water and feed it into the column, the pump had a frequency of 50 Hz.
2.10. Preparation of Bacterial Suspension of E. coli
To produce E. coli, the bacterial suspension was prepared using a stock solution provided by the Laboratory of Food Microbiology and Biotechnology of the National School of Agro-Industrial Sciences, University of Ngaoundere. E. coli strains were grown in a reconstituted liquid medium at pH 6.5 containing meat extract (1 g/L), yeast extract (2 g/L), peptone (5 g/L) and sodium chloride (5 g/L). The microbial culture was centrifuged at 5000 g for 15 min at 4°C. The resulting pellet containing the desired biomass was suspended three times in physiological water and centrifuged again. After three washes, the pellet was suspended in physiological water.
2.11. Retention or Inhibition Test
The test column was washed with demineralised water for 5 min, and all types of equipment were cleaned with alcohol and rinsed with demineralised water before each run. Sample collection vials were immersed in 98% alcohol and rinsed well with water immediately before collection. To study adsorption and inhibition kinetics, experiments were carried out on volumes of 1000 mL of the solution to be studied, which were brought into contact with a bed of GAC in a column. Samples were taken at precise time intervals.
3. Results and Discussion
3.1. Morphological Characterization of Ag-NPs
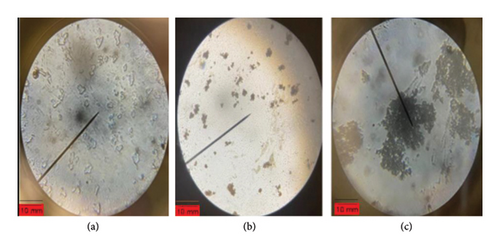
Figures 6(a), 6(b) and 6(c) show images obtained by optical microscopy. Figure 6(a) shows the image obtained with silver nitrate solution, while Figures 6(b) and 6(c) show the images for 2 and 4 mmol Ag ions, respectively. No nanoparticle images were observed in Plate A; however, different forms of nanoparticles with varying silver concentrations were observed in Plate B and Plate C.
3.2. Size Distribution of Ag-NPs
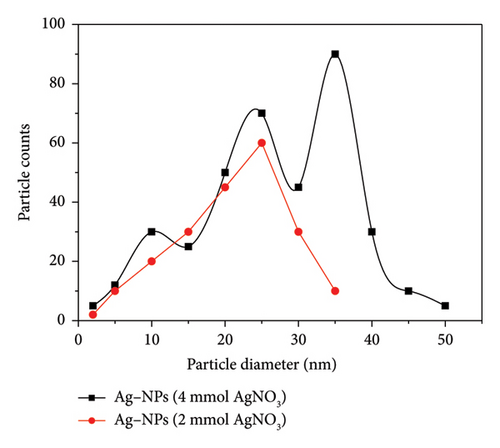
The result of the average size of the nanoparticles is presented in Figure 7. Generally, the sizes of the nanoparticles vary with the [Ag+] with an average size of 25 nm when [Ag+] is equal to 2 mmol. For [Ag+] equal to 4 mmol, the sizes ranged from 10 to 35 nm. The authors in [1, 27, 37, 38] reported a similar finding during their works on the nanoparticles. However, the difference in nanoparticle sizes between the two Ag concentrations may be due to the aggregation and spread-out shape of the nanoparticles, which shows that the size and shape of nanoparticles are a function of the concentration of the precursor [1, 28]. It is therefore desirable to use the concentration of a precursor that gives a spherical nanoparticle with a high specific surface area that can be grafted onto an adsorbent support.
3.3. Characterisation of Ag-NPs by UV–Vis Absorption Spectra
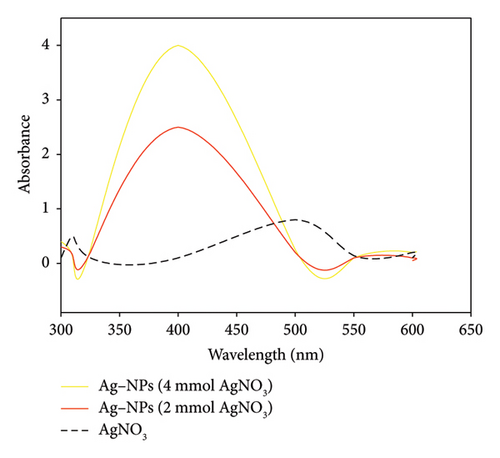
Figure 8 shows the UV–visible absorption spectra of three solutions. It can be seen that the absorbance and bandwidth varied with Ag concentration. The AgNO3 solution exhibited no peak. However, for the Ag-NPs, the figure shows that a peak was observed between 350 and 450 nm, regardless of the Ag concentration. At 2 mmol, we observed an absorbance of 2.4. But when the concentration increased to 4 mmol of Ag, the absorbance was at 4 with broadband. The absorption band within 350–450 nm is a characteristic peak of Ag-NPs [2, 19, 30, 39], indicating the presence of Ag-NPs in the solution. Due to the excitation of plasma resonances or interband transitions, some metallic nanoparticle dispersions exhibit unique bands/peaks [39]. The broadness of the peak is a good indicator of the size of nanoparticles.
3.4. Characterisation of GAC and GAC Impregnated With Ag-NPs (Ag-NPs/GAC)
The surface characterisation of GAC and GAC impregnated with Ag-NPs is presented in Table 1.
| Sample | SBET (m2/g) | Vtotal (cm3/g) | Vmicro (cm3/g) | Average pore size (Ǻ) | pHpzc |
|---|---|---|---|---|---|
| AC | 965.2 | 0.711 | 0.341 | 29.5 | 7.8 |
| Ag-NPs/GAC (2 mmol) | 897.7 | 0.564 | 0.310 | 28.2 | 7.3 |
| Ag-NPs/GAC (4 mmol) | 856.4 | 0.511 | 0.291 | 26.9 | 7.1 |
The results show that impregnation reduced particle surface area and pore size. Before impregnation, the surface area of GAC was 965.2 m2/g, which decreased to 897.7 and 856.4 m2/g after impregnation with 2 and 4 mmol of silver, respectively. Similarly, the initial pore size of GAC was 29.5 A°, and it decreased to 29.2 and 26.9 A° in the presence of 2 and 4 mmol of silver, respectively. Pores are typically categorised into three groups: micropores (< 20 Ǻ), mesopores (20–500 Ǻ) and macropores (> 500 Ǻ). Based on these classifications, the results show that the initial GAC particles were composed primarily of mesopores. After undergoing surface modification with Ag-NPs, the new materials exhibited a slight reduction in pore size but remained within the mesoporous range. The observed decrease in specific surface area and pore volume after impregnation is likely due to the partial blocking of AC pores by silver metal during the impregnation process. Several authors have reported similar results [40–42]. The pHpzc values for GAC, Ag-NPs–GAC (2 mmol) and Ag-NPs–GAC (4 mmol) were 7.8, 7.3 and 7.1, respectively. The slight decrease in pHpzc with surface modification can be attributed to an increase in oxygen content at the surface of the GAC. The presence of oxygen groups therefore reduces the electron density of the aromatic nuclei, thereby decreasing the basicity of the carbon [43].
3.5. Surface Modification of GAC Using FTIR
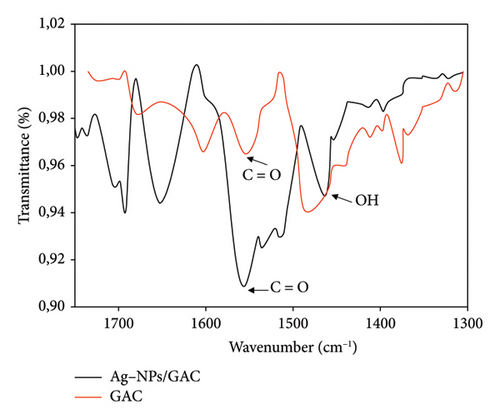
To observe whether the impregnation of Ag-NPsonto GAC has influenced the polar functional groups on the surface, IR analysis was performed. The results of the IR spectrum of GAC and Ag-NPs/GAC are shown in Figure 9. It shows the same shape of the curves with a variation in peak intensity and peak stretch that differs between GAC and Ag-NPs/GAC, which is evidence of GAC surface modification. The appearance and disappearance of some functional groups are also observed. The peaks at 1375 and 1600 cm−1 disappeared after modification, while the peaks at 1652 and 1690 cm−1 increased in intensity in the new materials. The peak at 1460 cm−1 is due to the -OH deformation of the carboxyl group. The stretching of the C=O bond is represented by the peak at wavenumber 1550 cm−1. Polar surface functional groups, such as carboxylic acid and carbonyl, are also present between 1800 and 1600 cm−1. This is an important zone and may contain absorption peaks for C=O bonds (carbonyl groups) in ketones, acids, esters and amides. Additionally, the C=C bonds in conjugated and aromatic systems also absorb in this range.
3.6. Studies of Antimicrobial Properties of Ag-NPs and Ag-NPs/GAC
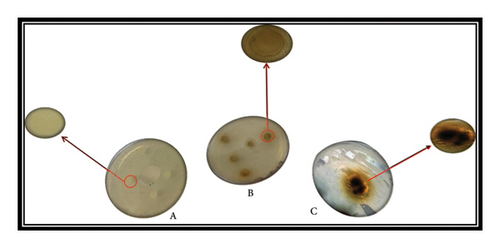
Figure 10 shows the Petri dishes in which 6-mm-diameter filter papers (A and B) were placed. In Dish A, where the filter paper lacks Ag-NP solution, no change is observed around the paper. Conversely, in Dish B, impregnated with 20 μL of nano silver particle solution, an inhibition zone appears around the filter paper.
- 1.
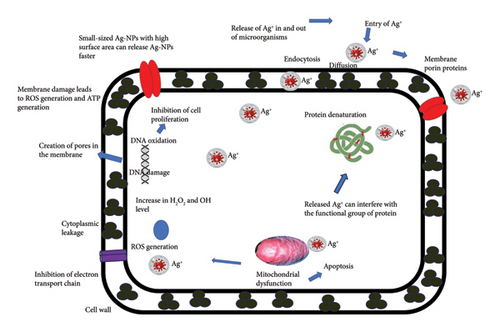
Membrane disruption: Ag-NPs can weaken E. coli’s outer membrane, causing cellular leakage [39].
- 2.
Intracellular damage: Nanoparticles can penetrate the inner membrane and bind to sulfur or phosphorus groups in intracellular components like DNA and proteins, altering their structure and function.
- 3.
Ion release: Silver ions released from the nanoparticles can interact with cellular components, disrupting metabolic pathways, membranes and genetic material [2, 4, 47–49].
The suggested potential mechanism for the antimicrobial mode of action of silver ions is depicted in Figure 11.
3.7. Residual Concentration of Silver in the Filtrate at Different pH Values
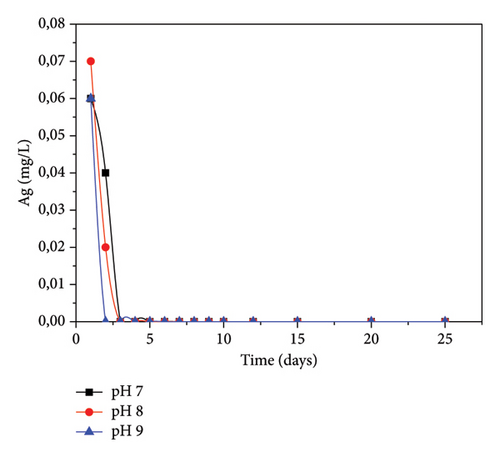
pH is one of the crucial parameters of the filtration unit operation. For all the studied pH values, silver concentration in the filtrate gradually decreases with time. As seen in Figure 12, on the first day, Ag concentration ranged from 0.60 to 0.07 mg/L, decreasing to 0 mg/L after 3 days, regardless of pH. It was found that the residual concentration of silver in the filtrate was lower than the standard value (0.2–0.3 μg/L), indicating that the antibacterial agent had been adsorbed onto the GAC. The fixation may be due to the presence of nonionic bonds (covalent bonds). The low concentration found in the filtrate at the beginning of filtration may be found on the surface of the filter. This suggests that the filter should be washed with water before use.
3.8. Breakthrough Times at Different pH Values
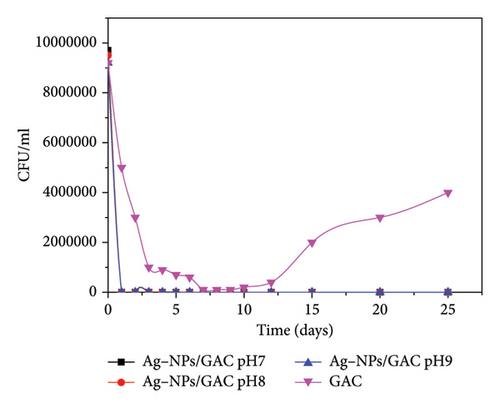
Figure 13 represents the variation in E. coli concentration as a function of time at different pH values for impregnated and unimpregnated carbon. For the Ag-NPs/GAC bed, the E. coli concentration drops from 9,700,000 to 0 CFU/mL after 1–2 days of operation irrespective of the pH of the suspension. For the control, the GAC bed has a retention rate that increases with time until Day 7, when the rate drops with the release of E. coli into the environment. The slight decrease in bacterial concentration observed for GAC could be attributed to the probable insertion of E. coli cells into the pores of the charcoal, most of which are made up of micropores (i.e., 0.341 cm3/g), bearing in mind that E. coli has approximately 7–8 nm in size. This means that the bacteria have a good chance of being trapped inside the fairly large pores, hence the adsorption phenomenon [50]. In addition, Ref. [51] showed that a high specific surface area can favour bacterial adsorption. However, in the case of the Ag-NPs/GAC bed, the strong bactericidal property observed is probably due to the presence of silver metal on the surface of the adsorbent, which has a strong bactericidal potential [52]. Furthermore, it can be assumed that bacteria are adsorbed on Ag-NPs/GAC and undergo the bactericidal activity of silver (particularly with the phosphorus contained in the bacterial DNA) by contact, thus inactivating DNA replication [42]. Also, research has shown that bacteria are destroyed by the combined action of silver and oxygen atoms adsorbed on the metal [53]. Silver serves to inhibit the growth of microorganisms and catalyse their detrimental oxidation processes [50]. Furthermore, Spreeprasad and Pradeep [54] explain the adsorption capacity of GAC–Ag through a synergistic effect between O–Ag and GAC.
3.9. Total Capital Investment
The cost estimation for setting up a single filter system using 400 g of activated carbon modified with silver nanoparticles (Ag-NPs/GAC) amounted to 16.69 USD (as indicated in Table 2), approximately one-third of the cost of common filters (48.83 USD) currently available in the local markets. This suggests that further research into establishing a company to produce and market these filters could be beneficial.
| Materials | Quantity | Unit price (USD) | Total price (USD) |
|---|---|---|---|
| Jujube seed | 1000 g | 1.63 | 1.63 |
| PVC column | 1 (50 cm) | 4.48 | 4.48 |
| Other materials (cole, connector, etc.) | // | 8.14 | 8.14 |
| Ag-NPs/GAC | 400g | 2.44 | 2.44 |
| Total | 16.69 |
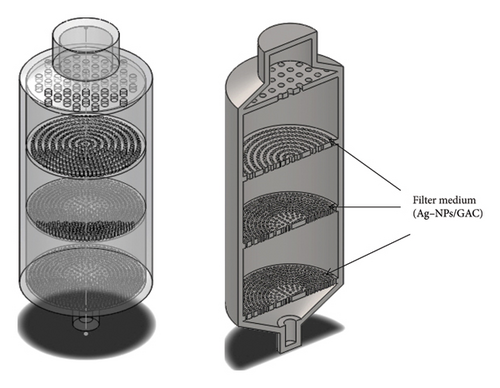
The 3D models of the proposed filter cartridge in the front view and section view are shown in Figure 14.
4. Conclusion
The study of the adsorption and inhibition of microorganisms (E-coli) using silver-coated GAC nanoparticles demonstrated the potential of this material for producing filters capable of eliminating pollutants, particularly microorganisms, from surface water. The results showed that the residual concentration of silver in the filtrate was lower than the standard value (0.2–0.3 μg/L) after passing through the silver-coated GAC nanoparticles bed. Initially, the silver concentration ranged from 0.60 to 0.07 mg/L on the first day of operation, decreasing to 0 mg/L after 3 days, regardless of the pH. Regarding the inhibition of microorganisms, in the presence of the silver-coatedGAC nanoparticles bed, the E.coli concentration drops from 9,700,000 to 0 CFU/mL within 1–2 days of operation, irrespective of the pH of the suspension. Such materials are expected to have widespread applications in drinking water disinfection.
Conflicts of Interest
The authors declare no conflicts of interest.
Funding
No funding was obtained for this study.
Open Research
Data Availability Statement
The data supporting this study’s findings are available from the corresponding author upon reasonable request.


