Effect of Enzyme on Chromed Leather Dyeing With Acidic Dyes
Abstract
Leather dyeing is a difficult task due to its heterogeneity and complexity. Several studies are aimed at improving the effectiveness of dyeing, including process optimization, use of dye auxiliaries, ultrasound, liposomes, and enzymes. Enzymes are receiving more attention due to their selectivity and high activity under optimum conditions. They are already applied in pretanning; however, information about enzyme application in the dyeing process is very limited. The study is aimed at investigating dyeing using enzyme preparation in the process together with a dye or pretreating leather with enzyme preparation prior to dyeing and comparing it with conventional leather dyeing. The results of the leather dyeing showed better adsorption in a control compared to the experiments, and it was also observed that the process is temperature dependent. Dyeing experimental samples had different kinetics. Using low dye concentration, enzyme preparations together with dye at 40°C resulted in the lowest adsorption; however, with higher dye concentrations, the tendencies were different. Fiber dyeing showed that pore removal has influence on enzymatic dyeing processes; dyeing together with EP resulted in better dye adsorption compared to EP pretreatment. To assess adsorption isotherms, three equations were applied: Langmuir, Freundlich, and Redlich–Peterson. The correlation coefficient showed that a suitable model depended on the sample and dyeing conditions. In some cases, the more suitable isotherm was Langmuir; in the other, it was Redlich–Peterson. The Langmuir adsorption capacity QL depended on the sample, the control had the highest values, and it increased with increasing temperature. Freundlich’s constant n indicated that all three processes are favorable. Although control dyeing had a higher dye exhaustion, better diffusion was observed with enzyme preparation. EP dyeing not only led to better dye diffusion into leather but also resulted in a darker shade compared to pretreated samples. Research results give new insight into the mechanism of the enzymatic dyeing process and its effect on dye penetration and color index values between samples.
1. Introduction
Leather is a natural and complex material that is made from hide/skin. Because of this, each leather has unique characteristics that vary within the matrix [1]. Processing raw material to the finished product includes a series of steps that can be divided into three main groups: pretanning, tanning, and post-tanning. Chemical treatments that are used in the processing modify the composition of the native skin [2]. Before the soaking, preservation of raw material is used to stabilize the skin and prevent putrefaction. Soaking rehydrates the preserved material and removes salts. Liming eliminates hair and flesh from the skins, deliming removes lime residues, bating splits fibers into fibrils, and degreasing is performed to eliminate fat. After pretanning, hide/skins are tanned; it is a crucial process for ensuring resistance against physical, biological, and chemical impact. During post-tanning, organoleptic properties (fulness, grain tightness, softness, and color) are ensured, and finally, the last step is as follows: finishing allows to hide defects of the product and gives aesthetic characteristics [3].
Due to the complexity and heterogeneity of leather, evenly dyeing is a difficult task [4]. Different from the textile, leather does not have a consistent thickness or flat structure [5]. Collagen is a protein that is a major ingredient in hide/skin and it plays a significant part in leather processing. The leather cross-section can be divided into three layers: grain layer, middle layer, and flesh layer [6]. Within the hidden structure, collagen fiber bundles form a three-dimensional weave. In the grain layer, collagen fiber bundles are more packed (netted) and smaller than in the middle and flesh layer. Because of this, leather can be viewed as a membrane that has unequal pores and is capable of chemical and physical adsorption [7].
The depth of dye penetration into the leather varies; using the same dye and different leather can lead to different results. The choice of dyes for the process depends on many factors such as affinity of materials, leather nature, and desired final product [5]. The affinity of dye to leather depends mutually on the structure and state of both the dye and leather. For the leather, it depends on the type of tannage, the presence of chemically active substances in the float, the surface active agents on the fiber surface, and the chemical modification types. For the dye, it depends on the chemical structure of the dyestuffs and their sensitivity to any of the dyeing conditions [8]. Poor dye diffusion and affinity result in insufficient colorant exhaustion. It is estimated that about 10% of unexhausted dyes are discharged into the waste streams regardless of the substrate involved in dyeing [9].
Traditionally, dyeing is executed in an aqueous bath of liquid medium with a high volume of water [10]. This process includes the diffusion of the dye in the aqueous phase, followed by adsorption on the outer surface of the fibers, and finally, diffusion and adsorption on the inner surface of the fibers. Depending on the final use, different dye strength properties may be required. The dye can be fixed to the fiber by different mechanisms, typically working in aqueous solution and ionic bonds. The Van der Waals interaction, hydrogen bonds, and covalent bonds can also be involved [11]. Drum dyeing remains as the most used method for leather coloration; the method employs a dyeing vessel rotating around in a horizontal axis, in which skins are agitated [4]. Acid/anionic dyes are usually used for the dyeing of chrome leather [7].
Several studies are aimed at enhancing the leather dyeing step and making it more sustainable, including process optimization, the use of dyeing auxiliaries, and environmentally friendly dyes [10]. Sivakumar et al. studied ultrasound application in the dyeing process; results showed that ultrasound helps to improve the kinetics of the leather dyeing process by increasing the apparent diffusion coefficient during the dyeing process [7]. A method of two-stage equilibrium dyeing resulted in much less dye discharge in effluent compared to conventional dyeing, but the shade obtained by this method did not match conventional dyeing [12]. Liposomes, used as dye vehicles, were able to accelerate dye deposition from 60 to 30 min and resulted in higher resistance to heat exposure [11]. Copolymer prepared from collagen hydrolysate, starch, and PVA, applied in dyeing at a 10% concentration level, improved dyeing characteristics with the maximum dye exhaustion of 96% [13]. The inorganic hydrotalcite-like synthetic material (HTLM) was successfully employed to bring color consistency in leather dyeing using three different dyes [1].
Environmental concerns encourage the development of ecofriendly processes. One of the promising approaches could be waterless leather dyeing using dense CO2 as a solvent for dyes or pigments. Prokein et al. performed waterless leather dyeing with supercritical CO2 as a solvent for the dye 1-(methylamino) anthraquinone in a technical scale autoclave. The waterless dyeing at 100 bar and 40°C led to uniform, intensive colorizations of the leather surface at a usage of 0.1 g of dye per square foot of leather. The dyed leathers achieved the highest rub fastness grades, and the exhaustion of dyestuff was almost 100%. The new process offered the potential to save significant amounts of dyestuff and reduce wastewater emissions by 100% [14]. The dye-encapsulated silica nanoparticles also offered a new opportunity for a sustainable leather dyeing process. The nanostructured dyes showed good uniform penetration as well as a surface fixation in all stages of the posttanning process. The presence of silica not only improved the dyeing characteristics but also enhanced the organoleptic properties during all the stages of the posttanning process [15].
Currently, many researchers are working on the development of inexpensive and efficient environmentally friendly dyes from natural sources that are less harmful to the environment and human health [16]. The aqueous colorant extract from the G. mangostana Linn peel waste could be applied in leather dyeing. Study results showed that using 20% dye and processing for 2 h led to an increase in color intensity [17]. In another study, leather dyed with colorant extracted from Bixa orellana seeds indicated good coloring properties [18]. Berhanu and Ratnapandian effectively dyed leather by using natural dye derived from the Cassia singueana plant along with natural mordants [19]. Furthermore, dyeing leather with colorants obtained from Coreopsis tinctoria flower petals [20], with lac dyes and the addition of mordants [21], with dye from Acacia Nilotica Plant Bark [22], and with indigo [23] also showed good finished leather properties. However, the main disadvantage of these natural dyes or pigments lies in the order of magnitude of their extraction yield factors [24].
Due to the growing biotechnology industry, enzymes attract more attention because of their high activity under ambient conditions and exquisite selectivity. Similarly to any catalyst, enzymes increase the rate of chemical reactions without being consumed [25]. Nowadays, enzymes are used in different industries such as pharmaceuticals, food, leather, detergent, biofuels, and textile [26–31]. In the textile industry, enzymatic processing can minimize the use of auxiliary chemicals in the dyeing step [32].
Enzymes have been a part of leathermaking for a long time, although they have not been recognized. Today, enzymes are used in all beam house processes and have even entered the tan house due to the enormous benefits they bring in terms of quality leather production [28]. However, information on enzyme applications to improve dyeing is very limited. Mitchell and Quellette studied lipase and protease application to clean the surface of chrome-tanned stock of grease, dirt, scud, and other stains for the purpose of making more uniformly colored leather. An improvement in the brightness and uniformity of the dyeing was observed with low enzyme concentrations [33]. Proteases alone also showed potential in dyeing application. Pretreatment with proteolytic enzymes resulted in leathers with uniform dyeing and intensity of color [34]. Later, studies by Kanth et al. with collagenase indicated that after treatment, the uptake of dye was as high as 99%. Scanning electron microscopy analysis showed a well-open fiber matrix for collagenase-treated leather [35]. Song et al. introduced the enzymatic post-tanning process as a method to improve the dye affinity in natural leather dyeing using Terminalia chebula Retzius (T. chebula). During the study, proteases such as flavourzyme, alcalase, and bromelain were used. Study results indicated that the enzymatic process with flavourzyme resulted in a better dyeing process [36]. Another study investigated the dyeing process with enzymes using the Cegarra–Puente equation. The absorption process resulted in higher absorption rate constants for enzymatic dyeing. The apparent activation energy has been found to be significantly reduced due to enzyme treatment, which enhanced dye absorption at lower temperatures with saving in terms of energy and time [9].
However, wet-blue pretreatment with enzymes does not always result in better dye exhaustion. A previous study showed that despite better dye penetration, colorant consumption after enzymatic treatment was lower compared to the conventional process [37]. For a better understanding of why the enzymatic process can enhance or decrease dye exhaustion, it is important to study process kinetics. In the present study, the dyeing kinetics were investigated when the chromed leather was pretreated with enzyme or with direct participation of enzyme as well as conventional dyeing. Three empirical equations were used: Langmuir, Freundlich, and Redlich–Peterson. The effect on dye exhaustion, color differences, and dye penetration were analyzed and compared.
2. Material and Methods
2.1. Materials
Bovine chromed tanned leather (wet blue) which was processed according to conventional technology was purchased from Lithuanian tannery “TDL Oda”. The main qualitative indexes of wet blue: thickness—1.60–1.65 mm; amount of Cr2O3—5.33 ± 0.21%; pH—4.25 ± 0.02; shrinkage temperature—113.3 ± 0.6°C and porosity—56%.
For leather kinetic studies, wet blue (washed in a drum for 40min at 22 ± 2°C temperature) was cut into pieces (4 × 5 cm), and a series of samples were formed and used in the experiments. For studies of leather fiber kinetics, wet blue was chopped, mixed with water (1: 80), and roll milled with IKA A11 basic mill (IKA-Werke, Germany) until fine fibers were obtained. The mass of the fibers was filtered through a Buchner filter (moisture 85%) and then used for the experiments.
In the study, the proteolytic enzyme preparation (EP) Zime SB (River Chimica, Italy), isolated from Aspergillus oryzae, was used. EP has an optimal pH—3.5–6.5.
For dyeing 1:2 metal complex dyestuff (Ciba-Geigy) CI Acid Red 423 (M = 960 g/mol) was used. Before use, the dyestuff was purified by extraction with acetone according to the procedure described in the literature [38]. The dyeing solution pH was 6.00 ± 0.1.
2.2. Methods
2.2.1. Determination of Dyeing Kinetics
Leather and leather fibers dye kinetics were studied at 40°C and 60°C temperatures. Five grams of leather was dyed for 8 h in 25 mL dye solution with an initial concentration of 6 and 24 g/L or 10 g of leather fibers were dyed in 50 mL dye solution with the same initial concentrations as with leather.
- a.
Control (dyeing without enzymes/enzymatic pretreatment)
- b.
Enzymatic pretreatment with 5% EP at 40°C for 1 h; after pretreatment dyeing was performed
- c.
Dyeing together with 5% EP
2.2.2. Obtaining Adsorption Isotherms
Three grams of leather was dyed for 7 h at 25°C, 40°C, and 60°C, at a concentration of 6–30 g/L; 3 g of leather fibers were dyed 7 h at 25°C, 40°C, and 60°C at a dye concentration of 14–60 g/L. The isotherms of sorption were drawn according to the concentrations of dyes in fibers and solution after reaching equilibrium. The Langmuir [39], Freundlich [40], and Redlich–Peterson [41] adsorption models were used for a description of the isotherms.
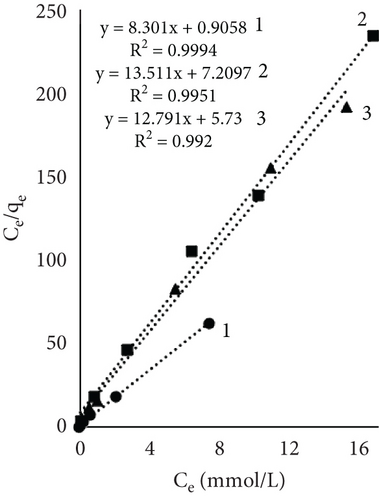
When Ce/qe versus Ce was plotted, the value of QL was calculated from the slope and the value of KL from the intercept.
2.2.3. Evaluation of Dye Penetration
The dye penetration through the leather was evaluated using a special optical microscope with scale (Magnification 15 times) MPB-2 (Izyum Instrument Making Plant, Ukraine). Dye penetration was calculated by evaluating the dyed and undyed leather cross section area.
2.2.4. Color Difference Measurements
3. Results and Discussion
3.1. Dyeing Kinetics
During dyeing, strong interactions of various types occur between mineral tannins and organic dyes [42]. To study the kinetics of different chromed leather dyeing processes, dye exhaustion was investigated using two different initial dyestuff concentrations and two different temperatures (Figure 1). A high concentration of EP (5% from leather mass) was used to observe more notable differences. The results show better dye exhaustion in a control sample, which was dyed without additional enzymatic treatment. Using low dye concentrations (6 g/L) the differences after the first few hours are significantly higher than at the end of the process. In the end, the exhaustion of the dyestuff between the control and the sample after EP treatment became similar at both temperatures. It is known that dyeing is a temperature-dependent process [4], and better uptake of dyestuff is observed with higher temperature. Interestingly, using EP together with dye (6 g/L) at 40°C resulted in 9.8% lower exhaustion compared to the control. However, with higher temperature, dye uptakes were more resembling between experiments. Since the optimal temperature of the EP Zime SB is 38°C–40°C [43], at this temperature, dye uptake may be lower due to higher enzyme activity. Possibly, the EP competed with dye during the process. Another reason for lower dye uptake could be that EP can bind to collagen molecules [44], which may reduce the number of active collagen sites within the pores and the amount of dye that can be absorbed.
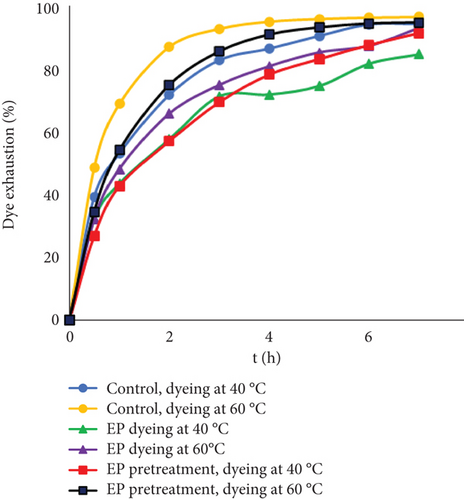
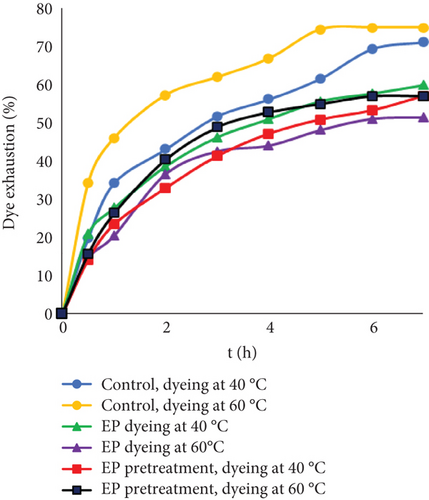
Dyeing at 24 g/L dye concentration increased the differences between the control and experimental samples. There are limited free groups of collagen or collagen with tanning material that can interact with dye molecules. The enzymatic process might decrease the number of sites available for bonding, and with a higher dye concentration, the effect was more noticeable. In most cases, better uptake of dyestuff was observed with higher temperature. However, using EP together with dyestuff at 60°C led to the lowest exhaustion. At this temperature, the enzymatic activity of protein decreases; temperatures above optimum can cause unfolding or denaturation resulting in loss of function [45]. It is known that dyes can aggregate to some extent in aqueous solutions. However, with higher concentrations, dye aggregation can occur more easily. Possibly, at higher concentrations and temperatures, more dye molecules or ions were associated in the solution and formed clusters or aggregates by itself or together with EP. Due to this, lower exhaustion rates might be observed. Even though EP may not interact with the leather itself, it could interfere with dye binding to leather.
The penetration and diffusion of dyes in the leather matrix are highly dependent on the relative population of macro, meso, and micropores of collagen fibers [46]. To eliminate the influence of pores in the process, the leather fibers were dyed (Figure 2). Using leather fibers, less time was needed to reach equilibrium; furthermore, at lower dye concentration, exhaustion between all samples was similar. Nevertheless, fiber dyeing led to different tendencies between the experimental series. It was observed that after half an hour, each experiment reached 90% exhaustion; however, pretreating fibers with EP resulted in the lowest exhaustion. The same tendency can be noted when dyeing with a higher initial concentration.
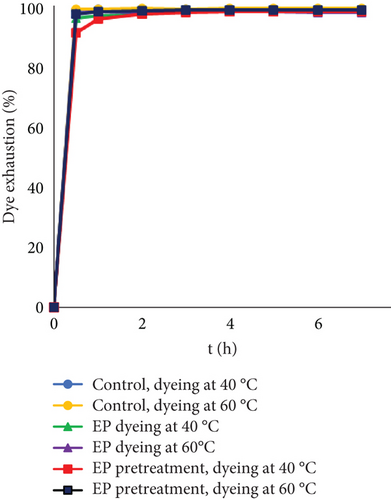
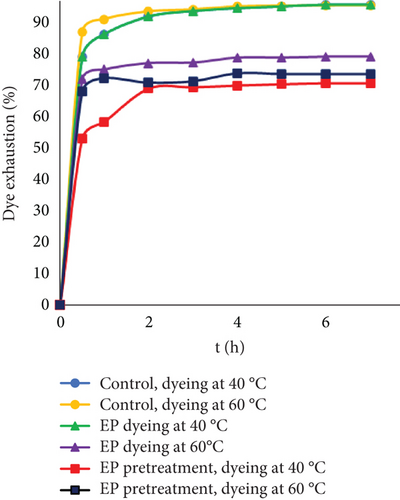
Interestingly, at higher dye concentrations, lower exhaustion was observed when EP was added together with the dyes at 60°C compared to dyeing at 40°C. The reason for this could be the same as it might be during leather processing. At higher concentrations and higher temperatures, dye molecules possibly aggregated easier and formed clusters by themselves or together with EP that could lead to worse sorption. Furthermore, by comparing two experimental samples, it was noted that the lowest dye uptake was observed when fibers were dyed after EP treatment. The reason behind this might be that during EP pretreatment, active collagen sites were modified and could no longer interact with dyes. When the substrate was leather, this effect after treating with EP was not observed; furthermore, dyeing together with EP resulted in better dye adsorption compared to EP pretreatment. The reason behind this might be that by eliminating pores in leather, it was easier for EP to act on the protein, and there was no need to diffuse deeper inside the pores. Despite different experimental exhaustions, control dyeing was most effective, and dye adsorption increased with higher temperature.
3.2. Assessment of the Adsorption Model
After investigating dyeing kinetics, adsorption isotherms were studied. First, leather was dyed at temperatures of 25°C, 40°C, and 60°C until equilibrium was reached. It was observed that the isotherms were different depending on the samples and the process temperature (Figure 3). Usually, four basic types (S, L, H, and C) of adsorption isotherms are recognized and used to identify the nature of the adsorption of solutes from aqueous solutions [47]. The control sample isotherm when dyed at 60°C showed the H type isotherm, while at 25°C and 40°C, the temperature was L type. The L (Langmuir) type is most recognized; the curving indicated that as more area in the substrates is filled, more difficult it becomes for the solute to find the unoccupied site. The H-type (high affinity) isotherm is a particular version of the L-type isotherm, where solute has a high affinity for the surface, especially at low concentrations [48]. The isotherm showed an adsorption dependency on temperature, with a higher temperature solute affinity to leather increased. This tendency was also observed using EP in the process. At 60°C, both experimental samples isotherms were H type; however, at 40°C, temperature adsorptions looked like L type. When dyeing in low temperature, experimental samples had the lowest affinity, also EP dyeing isotherm had S shape resemblance. For ion exchange processes, this type is not uncommon, where the selectivity is reversed after the occupation of active sites reaches a certain point [49]. This could be caused by the existence of two types of sites [50].
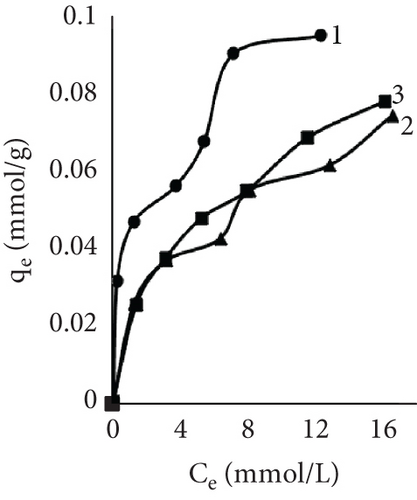
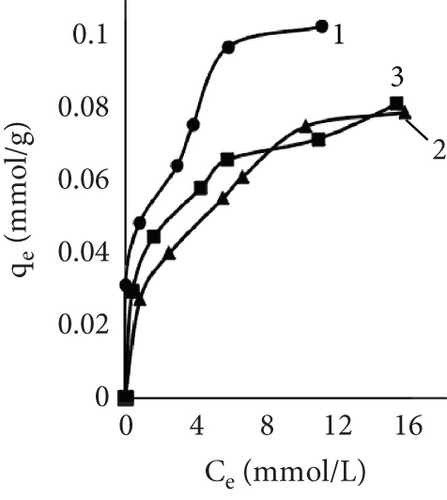
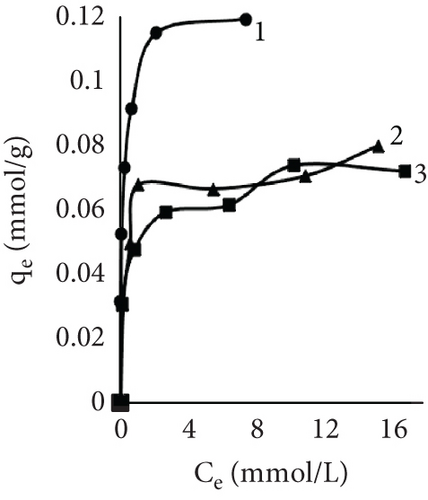
The mechanisms by which dyes are adsorbed and become substantive to fibers are dependent on the chemical nature and morphology of the fiber and on steric and electronic structural features of dyes. Although there are various models to explain the sorption behavior of dyes on fibers, the Nernst, Freundlich, and Langmuir sorption isotherms have proven quite useful in characterizing and classifying dye-fiber sorption processes [51]. The Langmuir isotherm model is based on the theory that the adsorbent surface is homogeneous with energetically analogous adsorption sites and the adsorbed material forms a monolayer on the surface [39, 52]. In contrast, Freundlich’s equation is based on multilayer adsorption. The model presumes that the adsorbent surface is heterogeneous with active sites whose energies are distributed exponentially [40, 53]. Considering the limitations of both Freundlich and Langmuir sorption isotherms, a three-parameter Redlich–Peterson model was proposed and could be used to describe the dyeing process [41]. This isotherm has the characteristics of both isotherms and can be used in homogeneous and heterogeneous systems [54].
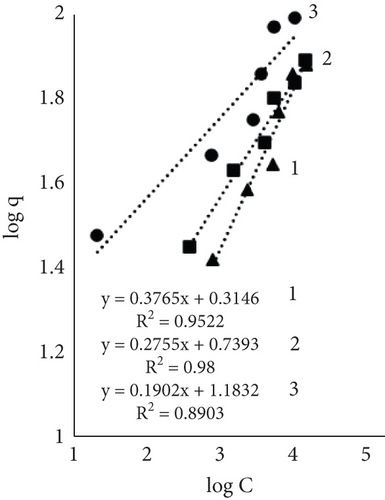
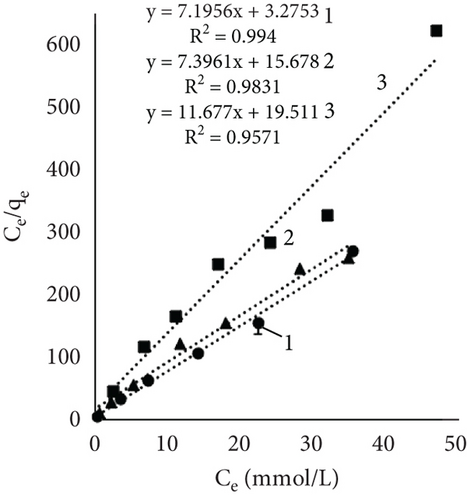
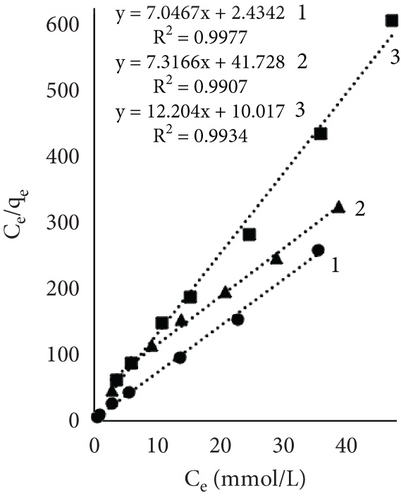
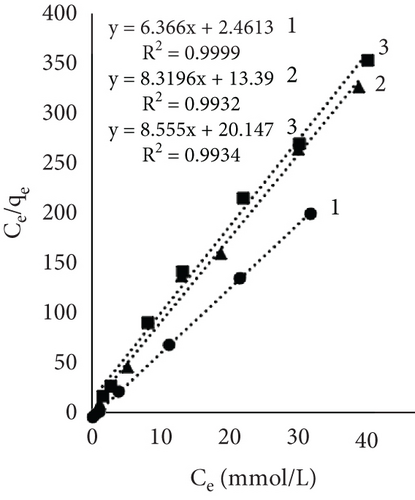
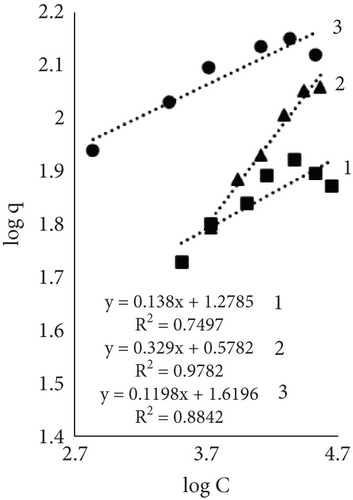
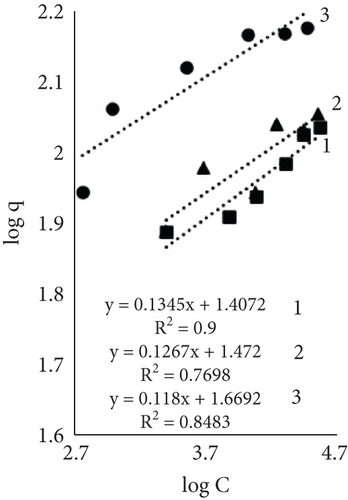
Figure 4 illustrates the adsorption isotherms of leather dyeing according to the Langmuir equation, while Figure 5 illustrates the Freundlich equation. Redlich–Peterson equation was not plotted due to its nonlinear expression. Although there are linearized forms, the estimation of parameters through linear regression has been found to be associated with various statistical issues [55].
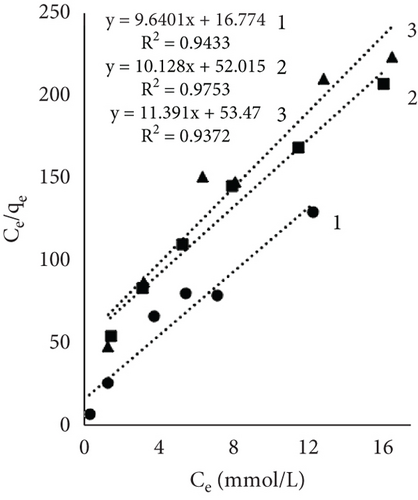
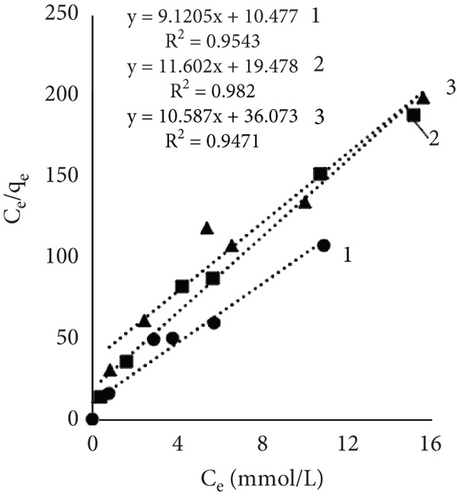
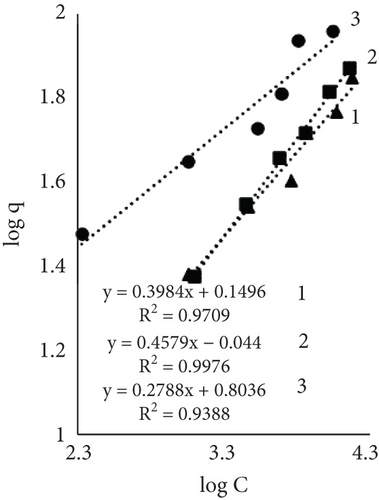
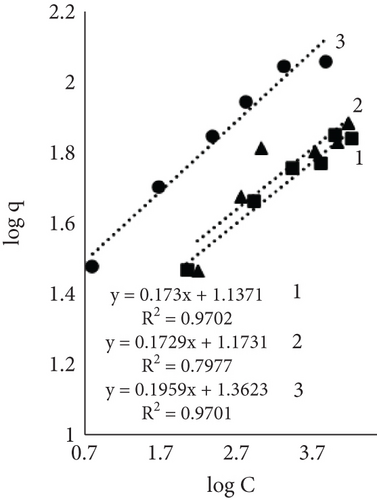
The results of Table 1 showed that all mathematical models can satisfactorily describe the adsorption of dye on leather. The adsorption isotherms obtained showed linear regressions with high correlation coefficient values (R2) in most cases. Interestingly, the highest R2 values depended on the sample and dyeing conditions. In some cases, the more suitable model was Langmuir; in the other, it was Redlich–Peterson. The calculated Langmuir adsorption capacity QL depended on the sample, results showed that control samples had the highest values, and it increased with rising temperature. Interestingly, using EP adsorption capacity at 60°C was lower compared to other temperatures. It might be, as mentioned before, when dyeing at this temperature, EP interfered with dye molecules, while EP pretreatment changed the number of available sites. At higher temperatures, the adsorption process is usually more rapid, and differences are easier to observe. The equilibrium constant (KL), which evaluates a ratio of sorption and desorption velocities, increased with increasing temperature. A higher K value indicated a higher adsorption energy [53].
| Indexes | Sort of leather and temperature (°C) | ||||||||
|---|---|---|---|---|---|---|---|---|---|
| Control | EP dyeing | EP pretreatment | |||||||
| 25 | 40 | 60 | 25 | 40 | 60 | 25 | 40 | 60 | |
| Langmuir | |||||||||
| QL (mmol/g) | 0.104 | 0.110 | 0.120 | 0.099 | 0.094 | 0.078 | 0.088 | 0.086 | 0.074 |
| KL (L/mmol) | 0.575 | 0.871 | 9.164 | 0.195 | 0.293 | 2.232 | 0.213 | 0.596 | 1.874 |
| R2 | 0.943 | 0.954 | 0.999 | 0.937 | 0.947 | 0.992 | 0.975 | 0.982 | 0.995 |
| Freundlich | |||||||||
| n | 3.584 | 5.263 | 5.102 | 2.513 | 2.656 | 5.780 | 2.193 | 3.623 | 5.780 |
| Kf ((mmol/g)(L/mmol)1/n) | 1.11 | 15.25 | 23.03 | 6.36 | 2.06 | 14.90 | 1.41 | 5.49 | 20.50 |
| R2 | 0.939 | 0.890 | 0.970 | 0.971 | 0.952 | 0.798 | 0.998 | 0.980 | 0.970 |
| Redlich–Peterson | |||||||||
| aR (L/mmol)g | 573.73 | 376.87 | 124.17 | 647.80 | 3.138 | 4.769 | 40.94 | 8.880 | 24.56 |
| Kr (L/g) | 452.12 | 207.16 | 11.83 | 13.88 | 0.118 | 0.345 | 0.914 | 0.389 | 1.269 |
| gr | 0.684 | 0.778 | 0.864 | 0.573 | 0.703 | 0.987 | 0.548 | 0.773 | 0.873 |
| R2 | 0.960 | 0.938 | 0.986 | 0.983 | 0.990 | 0.959 | 0.998 | 0.996 | 0.985 |
The Freundlich constant n is the intensity of adsorption or surface heterogeneity that indicates the relative distribution of energy and the heterogeneity of the adsorbate sites [56]. The constant provides information on how favourable the adsorption is; if n < 1, adsorption conditions are unfavorable; 1 < n < 2 shows difficult conditions, and if 2 < n < 10, the process is favourable [40]. Obtained values indicate that all three processes were favourable. The temperature effect using EP is obvious; the 60°C process was the most favourable, while the control sample constant values at 40° and 60° are similar. The adsorption coefficient Kf indicates the relative adsorption capacity of the adsorbent [53], and it increased with higher temperatures. This gives the assumption that dyes and leather interacted through the dominant hydrophobic action and the van der Waals forces [57].
As mentioned before, the Redlich–Peterson model incorporates the features of the Freundlich and Langmuir models and might be applicable to demonstrate adsorption equilibrium over a wide range of adsorbate concentrations. It is known that if g =1, the Redlich–Peterson equation becomes Langmuir’s [58]. Results showed an increasing exponent g value with higher dyeing temperature; with higher temperature, the process showed more similar behavior toward the Langmuir model. The dyeing of the leather sample together with EP at 60°C led to g = 0.987, which indicated a better applicability of the Langmuir isotherm in the process. The values of the control sample ar and Kr values indicated an interesting pattern; both parameters decreased with increasing process temperature. Decreased Kr could be attributed to increased molecular motion or changes in binding strength; lower ar values implied lower competition or easier access to adsorption sites.
The fiber adsorption isotherms (Figure 6) showed greater solute to leather in control samples. Despite dyeing at different temperatures, all three isotherms were H-shaped. However, dyeing after EP treatment or together with EP resulted in more complex processes. When dyeing at 40°C, EP dyeing isotherm was L-type. Even though the EP pretreated sample curve type was similar, this experimental trial had the lowest number of available sites for dye molecules to adsorbate. Isotherms of EP processes at 25°C indicated interesting patterns; both sample curves had multiple steps. There is no literature regarding this type of liquid–solid adsorption isotherms; however, multilayer adsorption on a uniform nonporous surface (VI type) is sometimes observed in gas–liquid systems [59–61].
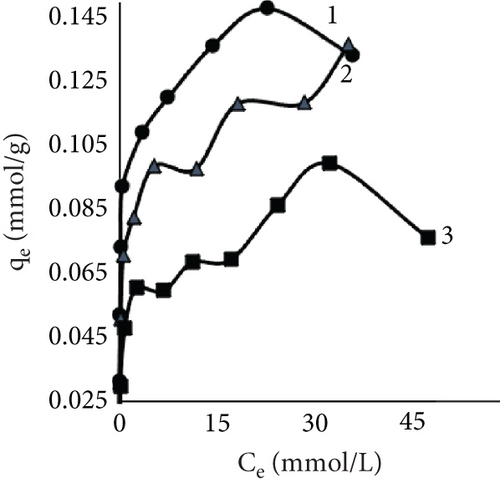
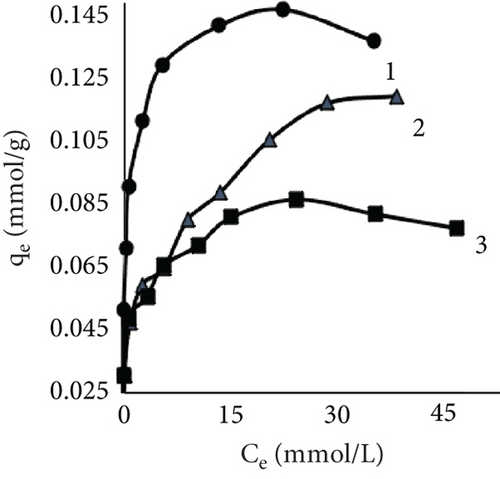
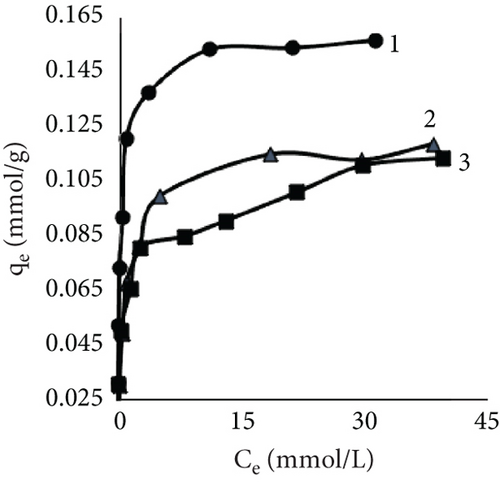
Results using three models for fiber dye adsorption (Figures 7 and 8, Table 2) showed Langmuir’s higher reliability, compared to Freundlich and Redlich–Peterson. This equation was more suitable to describe the adsorption process of dye on fibers.

| Indexes | Sort of leather fibers and temperature (°C) | ||||||||
|---|---|---|---|---|---|---|---|---|---|
| Control | EP dyeing | EP pretreatment | |||||||
| 25 | 40 | 60 | 25 | 40 | 60 | 25 | 40 | 60 | |
| Langmuir | |||||||||
| QL (mmol/g) | 0.139 | 0.142 | 0.157 | 0.135 | 0.137 | 0.120 | 0.086 | 0.082 | 0.117 |
| KL (L/mmol) | 2.197 | 2.895 | 2.596 | 0.472 | 0.176 | 0.621 | 0.548 | 1.218 | 0.425 |
| R2 | 0.994 | 0.993 | 0.993 | 0.983 | 0.991 | 0.993 | 0.957 | 0.998 | 0.999 |
| Freundlich | |||||||||
| n | 9.901 | 8.333 | 8.475 | 4.902 | 3.040 | 7.874 | 5.102 | 7.246 | 7.407 |
| Kf ((mmol/g)(L/mmol)1/n) | 48.150 | 41.649 | 46.687 | 16.562 | 3.786 | 29.648 | 5.742 | 18.989 | 25.539 |
| R2 | 0.906 | 0.884 | 0.848 | 0.760 | 0.978 | 0.770 | 0.583 | 0.750 | 0.900 |
| Redlich–Peterson | |||||||||
| aR (L/mmol)g | 47.195 | 45.641 | 14.304 | 11.006 | 11302.8 | 3.080 | 8.124 | 13.57 | 30.053 |
| Kr (L/g) | 4.759 | 4.401 | 1.703 | 0.848 | 502.37 | 0.263 | 0.427 | 0.748 | 1.926 |
| gr | 0.900 | 0.872 | 0.992 | 0.856 | 0.724 | 0.912 | 0.865 | 0.885 | 0.849 |
| R2 | 0.988 | 0.980 | 0.987 | 0.986 | 0.987 | 0.982 | 0.917 | 0.963 | 0.992 |
3.3. Trends in Dye Penetration and Color Measurement
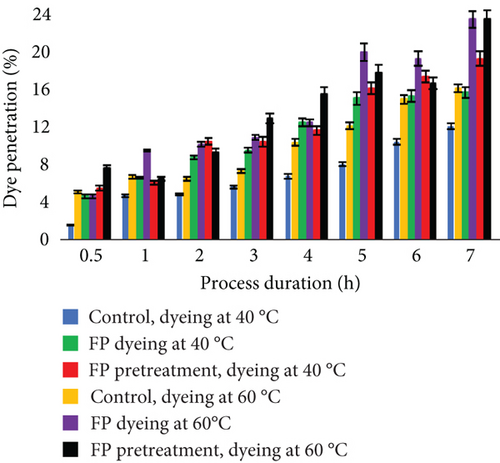
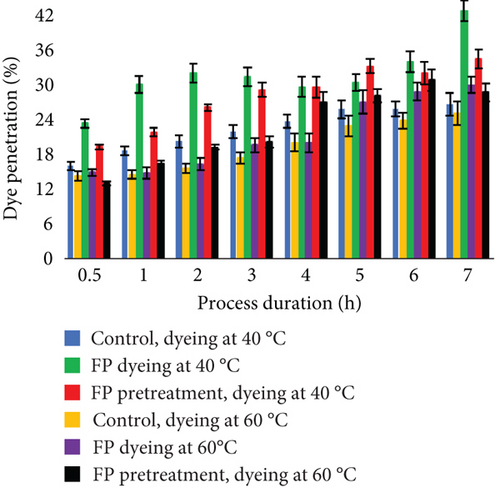
Even though dye adsorption was better while dyeing leather without EP, penetration to the material using EP was deeper (Figure 9). The effect of better diffusion into the leather fibers by using enzymes was noticed in previous studies [37, 62, 63]. It can be explained by the enzymatic removal of unwanted materials and the creation of spaces for facilitated penetration of dyes into the leathers [46]. At the end of the process, experimental trials with EP resulted in better dye diffusion. Furthermore, the use of EP together with dye led to the best dye diffusion. Total dye penetration in the control after 7 h of dyeing at 40°C was 38.9%, while EP dyeing was 58.6% and EP pretreatment was 53.9%. After dyeing at 60°C, total penetration was in control—41.41%, EP dyeing —53.6, and EP pretreatment—52.4. Interestingly, when dyeing experimental samples at 40°C, penetration was better through the flesh layer, while dyeing at higher temperature increased diffusion through the grain layer.
For color measurements, the leather was dyed with an initial colorant concentration of 24 g/L. All experimental samples were compared with the control, which was dyed at the same conditions (Table 3). EP dyeing not only led to better dye diffusion into leather but also resulted in a darker shade compared to pretreated samples. At both temperatures, a darker color was obtained using EP. Overall color difference ΔE was obtained dyeing EP pretreated leather; the difference between control and modified leather at 40°C was 7.07, while dyeing at 60°C was 3.28. This indicates that at lower temperatures, the color difference was notable. When color difference is lower than 1 unit, it is not noticeable [64, 65]. ΔE < 0.2 means “invisible,”ΔE among 0.2 and 1.0 means “very small,” ΔE among 1.0 and 3.0 means “small,” ΔE among 3.0 and 6.0 means “medium,” and ΔE > 6.0 means “large” [66].
| Sort of dyed leather | Dyeing parameters | Differencesa of color indexes | ||||||
|---|---|---|---|---|---|---|---|---|
| Duration | Temperature (°C) | ΔL∗ | Δa∗ | Δb∗ | ΔC∗ | ΔE | ΔH | |
| Leather pretreated with enzyme and dyed | 0.5 | 40 | −1.04 | −4.55 | −2.39 | −4.83 | 5.82 | 3.08 |
| 60 | −0.73 | −2.76 | −1.01 | −2.95 | 3.03 | −0.05 | ||
| 7 | 40 | −2.22 | −6.02 | −2.98 | −6.68 | 7.07 | 0.65 | |
| 60 | −0.49 | −3.08 | −1.02 | −3.24 | 3.28 | 0.27 | ||
| Leather dyed with the addition of enzyme | 0.5 | 40 | −0.42 | −2.17 | −0.61 | −1.82 | 2.29 | −1.32 |
| 60 | −0.64 | −0.97 | −0.38 | −1.06 | 1.22 | −0.21 | ||
| 7 | 40 | −1.04 | −2.51 | −0.90 | −2.65 | 2.87 | 0.36 | |
| 60 | −0.33 | −1.51 | −0.50 | −1.59 | 1.62 | 0.19 | ||
- aThe differences were given comparing with color indexes of conventionally prepared and dyed chromed leather.
4. Conclusions
The study investigated the kinetics of different chromed leather/fiber dyeing processes and temperatures. Three experimental trials were carried out: control (leather dyed without EP); dyeing with EP and EP pretreatment prior to dyeing. Results showed better dye exhaustion in a control compared to the experimental samples, and it was also observed that the process was temperature dependent. With a higher temperature, better adsorption in control was observed. Dyeing experimental samples had different kinetics. Using low colorant concentrations, dyeing together with EP at 40°C resulted in the lowest adsorption. However, with higher concentration, tendencies were different. To eliminate the influence of pores in the process, the leather fibers were dyed, which led to different tendencies between the experimental series. The lowest dye uptake was observed when dyeing fibers treated with EP; this might be due to modification of active collagen sites during EP pretreatment. It was easier for EP to act on fibers, as it was not necessary to penetrate into the pores.
In the investigation, three adsorption models were used: Langmuir, Freundlich, and Redlich–Peterson. The research investigated adsorption isotherms of leather dyeing at various temperatures (25°C, 40°C, and 60°C). The results showed that the adsorption isotherms varied depending on the samples and the process temperature. The Langmuir and Redlich–Peterson adsorption equations were found to be more accurate than the Freundlich equation in most experiments. The calculated Langmuir adsorption capacity (QL), while dyeing leather, depended on the sample; the highest values were observed at 60°C. The Freundlich constant (n) indicated that all three processes were favourable. However, dyeing fibers after EP treatment or together with EP resulted in more complex processes. The correlation coefficients indicated that for fiber, dyeing only the Langmuir isotherm model can be used.
Despite the better conventional dyeing, the use of enzymes in leather dyeing led to better diffusion of the dye. This was observed due to the removal of unwanted materials and the creation of spaces for facilitated dye penetration. The penetration of dyes into the leather, when EP was used, was better through the flesh layer, whereas higher temperatures increased diffusion through the grain layer. The color measurement showed a lighter color in the experimental trials; furthermore, the highest overall color difference ΔE was between control and pretreated leather. Nevertheless, research results gave new insights on the influence of enzymes on the dyeing process mechanism and its effect on dye penetration and color index values between the samples.
Conflicts of Interest
The authors declare no conflicts of interest.
Author Contributions
Conceptualization, R.B.-U. and V.V.; methodology, V.V. and R.B.-U.; validation, R.B.-U. and V.V.; formal analysis, R.B.-U.; investigation, R.B.-U.; data curation, R.B.-U. and V.V.; writing—original draft preparation, R.B.-U.; writing—review and editing, R.B.-U. and V.V.; visualization, R.B.-U.; supervision, V.V. All authors have read and agreed to the published version of the manuscript.
Funding
This research did not receive any specific grant from funding agencies in the public, commercial, or not-for-profit sectors.
Open Research
Data Availability Statement
The data that support the findings of this study are available from the corresponding author upon reasonable request.


