Development of Photocatalytic Ultrafiltration Membranes for Enhanced Removal of Carbamazepine: Optimization and Mechanistic Insights
Abstract
Carbamazepine (CBZ), a persistent antiepileptic drug, poses significant challenges in water treatment due to its recalcitrance to conventional degradation methods. This study presents a breakthrough in CBZ removal by integrating a photocatalytic ultrafiltration (UF) membrane with precisely engineered surface-immobilized TiO₂ nanoparticles (NPs) fabricated via an innovative technique developed in our prior work. The UF process, conducted under UV irradiation at 0.5 L/min crossflow, demonstrated exceptional performance when optimizing membrane composition (18% PVDF, 5% ethanol, and 1.5% embedded TiO2) and surface TiO2 NP density (3.04 g/m2), achieving 80% CBZ rejection with a high permeate flux of 100 L/m2/h at low pressures (0.05–0.1 MPa). Crucially, membranes lacking surface TiO2 NPs showed negligible CBZ removal, regardless of UV exposure or pressure, underscoring the necessity of photocatalytic activation. Further analysis revealed that increasing pressure (0.05 → 0.1 MPa) and CBZ concentration (1 → 4 mg/L) reduced rejection efficiency (80% → 42% and 80% → 55%, respectively), highlighting the interplay between operational parameters and membrane performance. This work establishes a groundbreaking strategy for enhancing CBZ elimination, offering critical insights for advancing engineered membrane technologies in water treatment applications.
1. Introduction
Pharmaceutical residues released into the environment are a growing concern because of their significant effects on humans, animals, and microbial communities [1]. Most of the time, these residues cannot be treated biologically and remain in the water system for an extended time. In recent years, photocatalytic membranes have drawn great attention in water treatment due to their superior characteristics (e.g., antifouling and improved permeate quality) [2]. The rapid growth of emerging organic contaminants (EOCs) in water bodies is of paramount consideration because of their potential health risks and persistence to removal [3]. One of the categories of EOCs includes drugs, comprising a big fraction. The nonpoint source of EOCs deems it challenging to control their invasion into the water bodies. Overall, the water bodies are being contaminated by two major routes: the release of untreated drugs from domestic wastewater and the inappropriate disposal of expired drugs [4, 5]. As a result of their presence in water bodies, they tend to bioaccumulate and biomagnify in aquatic organisms and could be part of the food chain [6], consequently increasing the deleterious health effects on humans [7]. Therefore, removing EOCs from water is one of the utmost concerns in acquiring a safe water supply per the sustainable development goals of UNDP.
Conventional water treatment methods are reportedly unable to remove many EOCs from wastewater [8]. Nevertheless, these complex chemicals are disposed of into freshwater bodies and treated wastewater. Therefore, the transformation of EOCs in freshwater bodies is becoming a popular research field, where EOCs are transformed into another product from their parent compound [9–11]. The transformation process could be achieved by several means, including photolysis, H2O2-assisted photolysis, and dissolved organic matter–induced photolysis [12, 13]. Transformation through photolysis is achieved by natural or simulated sunlight, where H2O2 and dissolved organic matter could also be added to enhance the transformation process. The process is achieved by producing highly reactive oxygen species [14].
One of the major persistent pharmaceutical residues in the food chain and water bodies is carbamazepine [15–17]. The drug is widely used for many purposes, including as an antiepileptic. CBZ has been detected in the range of nanograms per liter to micrograms per liter in surface and groundwater [18]. Its presence in aquatic environments poses a potential health risk to humans and has deadly effects on aquatic life [19]. The removal efficiency of CBZ by conventional wastewater treatment plants has been reported as negligible or less than 10% [20, 21]. The insignificant removal is attributed to its recalcitrant nature, small size, nonbiodegradability, and nonadsorptive behavior. Due to its very small size, even nanofiltration fails to remove a significant amount of CBZ. Vergili [22] reported that up to 30% of CBZ could be removed using NF. Meanwhile, photocatalytic degradation of CBZ has been reported with promising results. UV-assisted TiO2 photocatalysis has been widely reported to have a degradation of CBZ of more than 95% [23]. However, after treatment, the separation of the photocatalyst from the solution needs an appropriate solution. Membrane technology, which is widely used to treat different wastewater types, can be applied to remove carbamazepine and preserve the ecology. The treatment gap was identified in this study, and a novel membrane was used to achieve promising results.
This study prepared a novel UF membrane with an active layer of surface-located TiO2 NPs. Although UF is acknowledged for its low energy consumption, a wide range of pollutant removals, and adequate water quality production, removing minuscule compounds, especially those of a neutral nature such as CBZ, is impossible. We tailored the UF membrane and UF process so that CBZ could be effectively removed from an aqueous solution. Therefore, this study is of practical engineering importance for successfully removing persistent EOCs from water bodies.
2. Materials and Methods
2.1. Materials
PVDF (SOLEF 6020, Solvay Ltd, Belgium) was used as a polymer for membrane fabrication. TiO2 NPs (P25, Degussa Co., Germany) 30:70 rutile to anatase was used as a photocatalyst. Carbamazepine (ACROS organics, United States) was the target EOC to be removed. Dimethyl acetamide (DMAc) and ethanol (CH2OH) were of analytical grade, purchased from Sinopharm Chemical Reagent Corp. (SCRC), China, and used as they are, otherwise noted.
2.2. Membrane Fabrication and Characterization
All the membranes were fabricated using a nonsolvent-induced phase separation procedure [24], where predetermined polymer (PVDF), porogen (ethanol), additive (P25 TiO2 NPs), and solvent (DMAc) were added into a flask and mechanically stirred for 24 h at 60°C. After stirring, the membrane casting solution was kept stable for degassing for another 24 h. The degassed homogeneous mixture was spread over a glass plate using a casting knife (the height and speed of the casting knife were adjusted to 250 μm and 1.2 m/min, respectively). The glass plate containing casting solution was immersed in a water coagulation bath. After complete coagulation of the membrane solution, the fabricated membrane was transferred into deionized (DI) water, where the membrane remained soaked for 2 days for a complete exchange of solvent.
The photocatalytic membranes were prepared by immobilizing P25 TiO2 NPs on the membrane. The immobilization procedure was adopted from our previous research [25]. In detail, a glass plate was keenly cleaned and embarked certain areas with tape. On the other hand, P25 TiO2 NPs were suspended in ethanol and sonicated for half an hour. The well-sonicated TiO2–ethanol suspension was poured into the middle of an embarked clean glass plate. After the suspension covered the embarked area, the glass plate was left for ethanol evaporation. The final distribution density of TiO2 was 3.08 g/m2. The plate was kept at 50°C in a dry heat oven for 5 min. Finally, the casting solution was spread over a glass plate (immobilized with TiO2 NPs) with predescribed knife height and speed. The remainder of the procedure was the same as described above. TiO2 NPs were transferred to the membrane through an adhesion process; therefore, the process was termed surface adhesion of TiO2 NPs (SaT), and the membranes were named accordingly. The membrane was used after a complete exchange of the solvent with water. Notably, the TiO2-bearing membrane surface was the active surface used for filtration. All the membranes used in this study are described in Table 1 with their compositions.
| Membrane | Composition of casting mixture (wt.%) | P25 on membrane surface (g/m2) | |||
|---|---|---|---|---|---|
| PVDF | Ethanol | TiO2 | DMAc | ||
| PE-17 | 17 | 4.5 | — | 78.5 | — |
| PE-18 | 18 | 4.5 | — | 77.5 | — |
| PE-19 | 19 | 4.5 | — | 76.5 | — |
| PE-20 | 21 | 4.5 | — | 74.5 | — |
| SaT-PE-17 | 17 | 4.5 | — | 78.5 | 3.08 |
| SaT-PE-18 | 18 | 4.5 | — | 77.5 | 3.08 |
| SaT-PE-19 | 19 | 4.5 | — | 76.5 | 3.08 |
| SaT-PE-21 | 21 | 4.5 | — | 74.5 | 3.08 |
| SaT-PET-4.5 | 18 | 4.5 | 1.5 | 76 | 3.08 |
| SaT-PET-5.0 | 18 | 5.0 | 1.5 | 75.5 | 3.08 |
| SaT-PET-5.4 | 18 | 5.4 | 1.5 | 75.1 | 3.08 |
| SaT-PET-6.0 | 18 | 6.0 | 1.5 | 74.5 | 3.08 |
The surface characteristics of the membranes were observed under field emission scanning electron microscopy (FE-SEM) (JSM 7800F, JEOL, United States). The air-dried membrane was sputtered with Au particles to observe surface morphology, and SEM images were taken. The contact angle (CA) of the membranes was detected using a goniometer (Kuruss, Germany), where 4 μL of water droplet was dropped on the membrane pasted on a glass slide. After that, images of water drops were taken at various times. The zeta potential of the membranes was measured using an electrokinetic analyzer for solid surfaces (Surpass 3, Anton Paar, Austria), where two pieces of 1 × 2 cm were pasted on the sample holder to get a streaming potential. A 0.01 M KCl solution was passed between them as an electrolyte. The pH of the solution was varied with 0.05 M HCl and NaOH solutions.
2.3. Photolysis, Photocatalysis, and UF of CBZ
2.4. Photocatalytic UF
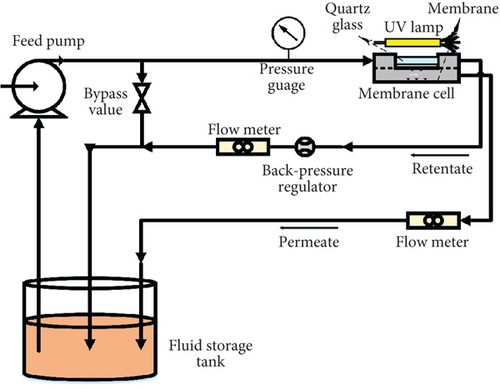
Photocatalytic UF was carried out using the custom-made photocatalytic crossflow UF system. The photocatalytic crossflow UF system is shown in Figure 1. The UF and photocatalytic UF are the same. The only difference is the assisted UV light. When studying photocatalytic UF, an externally assisted UV light was turned on. The membrane cell was equipped with a quartz window at its top, which allowed UV light to reach the membrane surface. The assisted UV light was UV-A, emitting maximum light at 365 nm with 1.2 mW/cm2 light intensity.
2.5. Performance Evaluation of Photocatalytic UF
Each membrane was precompacted before starting the filtration. A 48 cm2 (8 × 6 cm) piece of membrane was cut off from the prepared membrane. For precompaction, 100 L/m2 of DI water was filtered at 0.1 MPa pressure (without UV light). After precompaction, photocatalytic UF was started with CBZ solution. A 2-L CBZ solution was prepared in a feed tank; the concentration of CBZ is mentioned according to the experiment. The UV light was turned on before turning on the filtration system. The flow rate was adjusted to 0.5 L/min, and the pressure was adjusted according to the experiment. Each photocatalytic UF experiment was carried out for 90 min, and periodic samples were collected after 10 min to determine the CBZ concentration.
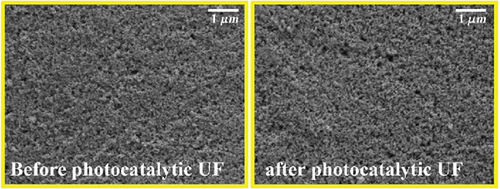
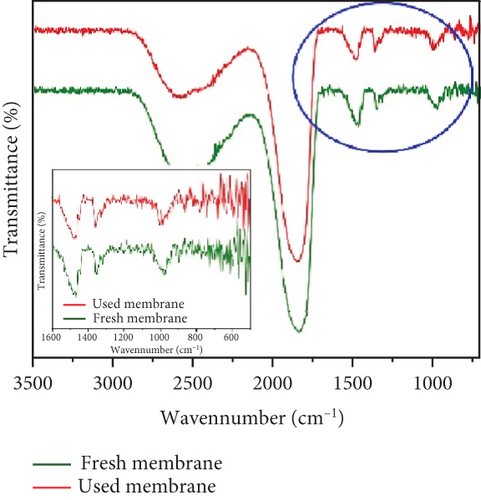
Finally, the reusability of the membrane was assessed by conducting multiple filtration cycles and recording the flux and rejection. Moreover, physical damage to the membrane was evaluated by examining the surface of the membrane before and after photocatalytic UF. SEM images of the membrane were taken before and after the experiment. Chemical damage to the membrane was assessed using Fourier transform infrared spectroscopy (FTIR). FTIR analysis of the membrane was conducted before and after use to explore the existence of new peaks. The integrity of the membrane was checked by determining the pure water flux before and after photocatalytic UF.
3. Results and Discussions
3.1. Characterization of Membrane
The morphologies of the membranes were investigated using SEM images of the membranes. Figures 2a, 2b, and 2c show the surface morphologies of the membranes. Figure 2a presents the surface of the PE membrane, where surface pores of the membrane could be observed besides dense and thick nonporous areas. The pores were generated as a process of phase inversion where the solvent (DMAc) was replaced by water, leading to the gelation of the polymer. Moreover, the pores were also formed due to ethanol–water demixing, where ethanol played a pivotal role as a pore former agent [25]. Figure 2b,c shows the membrane surfaces of SaT-PE and SaT-PET membranes where TiO2 NPs covered the surfaces of both membranes. It is also evident that a continuous layer of NPs densely covered the whole surface of the membranes. The observation is based on previously reported membranes, where the membranes were prepared using an identical procedure that possessed a complete layer of TiO2 that was used as an active layer for removing humic acid from water [28]. Figures 2d, 2e, 2f, 2g, 2h, and 2i show the cross-sectional SEM images of the membranes at two different magnifications. All the membranes showed a typical asymmetric structure formed as liquid–liquid demixing in a water coagulation bath. Despite the typical asymmetric structure, it could also be seen that PE and SaT-PE membranes owned more and larger macrovoids, whereas SaT-PET membranes owned more microvoids. The formation of macrovoids resulted from the rapid penetration of water in the casting solution and replacing the solvent and ethanol. Consequently, less time becomes available for the nucleation of the polymer molecules, and larger pores are formed. After the solidification of the polymer in contact with the water, water penetration to the casting solution slowed, and polymer nucleation time increased. The reduced pace of liquid–liquid demixing induced the generation of microvoids.
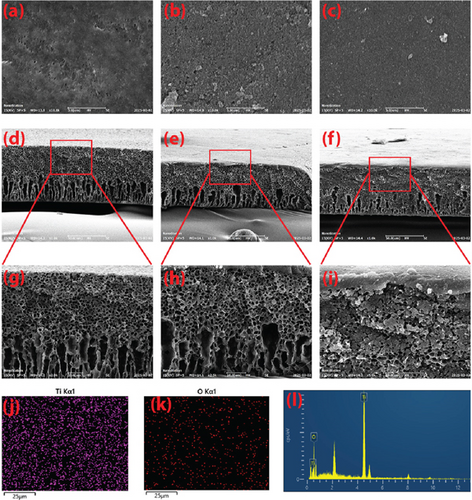
As PE and SaT-PE membrane casting solutions were identical, both membranes showed similar membrane structures. On the contrary, the SaT-PET membrane contained TiO2 NPs in the casting solution and showed more microvoids. TiO2 NPs worked as nanofillers in the membranes, adhered to the solvent–polymer solution and decreased the generation of macrovoids. Instead, the presence of NPs promoted more microvoids in the membrane matrix, in accordance with other studies [32]. Moreover, in the cross-section of SaT-PE and SaT-PET membranes, the surfaces are covered with NPs, where a complete and continuous layer can be observed. The presence of TiO2 was also confirmed via EDX mapping. Figure 2j,k shows EDX mapping for Ti and O on the surface of the SaT-PET membrane, and thoroughly distributed Ti and O are visible over the membrane surface.
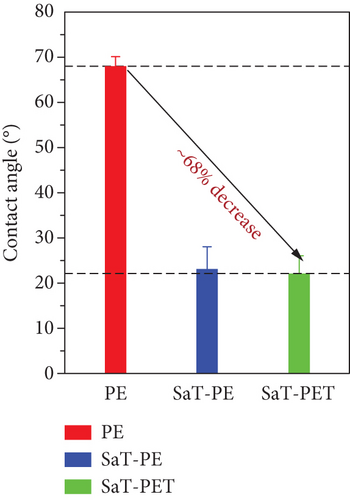
The surface wettability of the membranes was investigated by measuring the CA of the membranes. Surface wettability is a critical parameter to assess the membrane’s performance. Usually, wettability represents the hydrophilicity of the membrane, and the hydrophilic membrane is preferred in water treatment applications as more hydrophilicity reduces the fouling of the membrane and increases the water permeability or flux. A higher CA represents a less hydrophilic surface, and a smaller CA represents a more hydrophilic surface. Figure 3a shows the measured CA of the membranes using 4 μL of water droplet. PE showed the highest CA of 68° among all the membranes, and the remaining two showed a similar CA of 23°. The reduction in CA is evident in the presence of TiO2 NPs on the surface of SaT-PE and SaT-PET membranes. Both membranes contained NP layers, and NPs are highly hydrophilic owing to high surface energy [33], thus reducing the CA of water by 68% compared to the PE membrane. Figure 3b shows the CA of water as a factor of time where the PE membrane did not show any difference in the CA after 60 s. On the contrary, the SaT-PE membrane showed an insignificant reduction in the CA (from 23° to 18°), but the SaT-PET membrane showed a great decrease in CA with time (22°–3°).
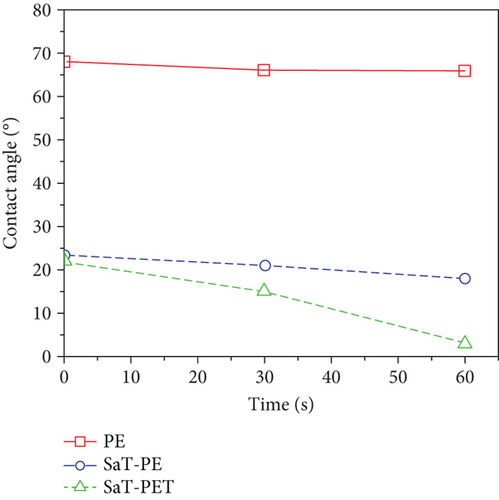
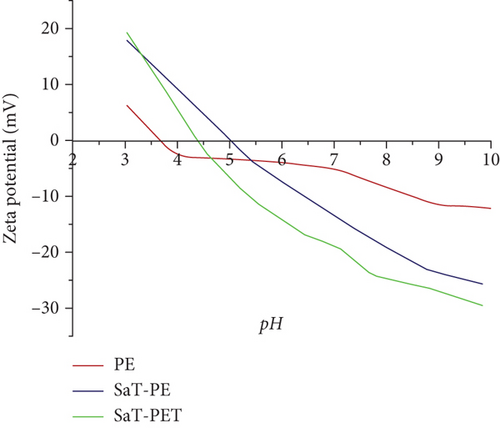
With time, the reduction in CA of the SaT-PET membrane was due to the presence of TiO2 NPs as fillers across the membrane matrix. As TiO2 is highly hydrophilic, TiO2 NPs attracted H2O molecules across the membrane and reduced the water on the membrane by adsorption. The phenomenon is called capillary suction, where water molecules passively penetrate the spaces filled with NPs. This also indicates that the SaT-PET membrane should possess the highest water flux compared to other membranes. Figure 3c shows the streaming zeta potential of the membranes at a wide range of pH (3–10). Surface charge is owned by the chemical groups present in or on the surface of the membrane. PVDF is a fluorinated polymer and imparts low polarity; thus, the PE membrane showed surface zeta potential ranging from +6 to −13 mV with the isoelectric point near 3.6. SaT-PE and SaT-PET membranes contained TiO2 on the surface, and their zeta potential values ranged from +19 to −29 mV. TiO2 NPs become protonated at lower pH by acid dissociation and show a positive surface.
In contrast, at higher pH, more OH− ions are adsorbed on TiO2, and the surface becomes more negative compared to PVDF, which is less prone to the adsorption of ions. The change in surface zeta potential values is important while filtering specific pollutants, and the information could be used to reduce the fouling. For example, in the case of a positively charged pollutant, the acidic solution would tend to charge the surface positively and reduce the adsorption of the pollutant or increase the rejection and vice versa.
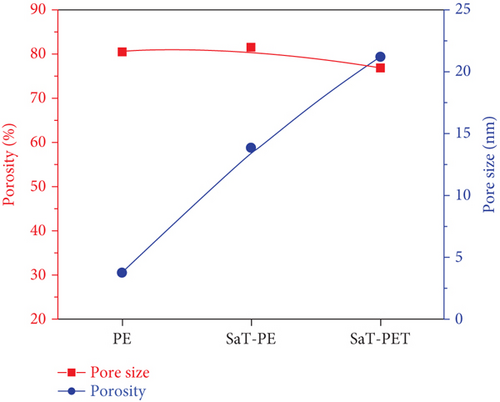
Figure 4 shows the porosity and pore size of the membranes, that is, PE, SaT-PE, and SaT-PET. The least porosity was found for the PE membrane, which was 28%. The immobilization of TiO2 NPs on the surface increased the porosity to 58%, and adding 1.5% NPs in the membrane matrix further enhanced the porosity. The porosity of the membrane was detected using Equation (1), which involves the membrane’s thickness, permeance, and wet and dry weight. Supporting Information 1, 2, 3, and 4 illustrate the impact of concentration versus pore size distribution on the membrane. Adding NPs increased the water adherence to the surface and the thickness, increasing porosity per the equation. On the other hand, all three membranes showed a similar pore size ~20 nm.
Supporting Information 1 shows flux and rejection using PE membranes while the UV light was irradiated throughout the filtration experiment. PE membranes do not have any TiO2 NPs on the surface. The flux of PE-17 and PE-18 was found to have a small difference, that is, 12 and 10 LMH, and an insignificant flux for PE-19 and PE-21 was recorded. However, all the membranes showed negligible rejection (< 5%) for CBZ after 10 min filtration, which is evident in Supporting Information: Figure S1b. Moreover, the permeate quantity was insufficient to determine the CBZ rejection in the case of PE-21. Later, PE membranes with TiO2 on surfaces (SaT-PE) were used for photocatalytic UF. Supporting Information 2 shows the flux results and the rejection of CBZ by different SaT-PE membranes. The increase in PVDF concentration increased the rejection (Supporting Information 2: Figure S2b) of CBZ but decreased the flux. Maximum rejection (60%) was observed in the case of SaT-PE-21 (PVDF 21%), but the flux was extremely low (12 LMH). SaT-PE-17 and SaT-PE-18 showed a flux of 65 LMH and rejection of CBZ at 50% and 45%, respectively. Moreover, a very high rejection was observed at the beginning of the filtration, which was reduced as the filtration time proceeded. Eventually, after 10 min, stable rejection was achieved, that is, 50%, 45%, 57%, and 60% for SaT-PE-17, SaT-PE-18, SaT-PE-19, and SaT-PE-21, respectively.
Supporting Information: Figure S2c,d shows UF results of SaT-PE membranes without UV light. The results show that the fluxes of the membranes were half as compared to fluxes with UV light. The flux is reduced in the following order: SaT-PE-17 > SaT-PE-18 > SaT-PE-19 > SaT-PE-21. However, the rejection of CBZ was negligible. Except for SaT-PE-21, all the membranes showed less than 6% rejection of CBZ. SaT-PE-21 showed rejection of 20% of CBZ, but using SaT-PE-21 is not advisable considering its flux. From the results of Supporting Information 1 and 2, it is clear that the presence of TiO2 NPs on the membrane surface and activation of TiO2 NPs is compulsory to attain reasonable rejection of CBZ. To further improve the rejection of CBZ using the filtration process, 1.5% TiO2 NPs were added to the membrane matrix to tune the easy passage of water molecules across the membrane. Moreover, SaT-PE-18 was selected to investigate the favorable concentration of ethanol suitable with 18% PVDF in terms of significant rejection of CBZ and considerable flux.
Supporting Information 3 illustrates the flux and rejection of different SaT-PET membranes. Supporting Information 3: Figure S3a shows flux increased by increasing the ethanol concentration from 4% to 5.4%. However, when the ethanol concentration was increased to 6%, a significant decrease in the flux was observed. Supporting Information 3: Figure S3b shows the rejection of CBZ by different SaT-PET membranes. Maximum rejection (83%) was observed with SaT-PET-6.0, and minimum rejection (74%) was found for SaT-PET-5.4.
Supporting Information 4 shows the porosity and pore size of the membranes with 1.5% TiO2 and different wt.% of ethanol. It was found that with 4.5% ethanol, 68.98% ± 1.66% and 23.67 ± 0.78 nm porosity and pose size were achieved, respectively. A significant increase in porosity and decrease in pore size was observed by increasing the concentration of ethanol from 4.5% to 5%, that is, 72.38% ± 0.47% and 19.15 ± 0.26 nm porosity and pore size, respectively. This observation is in accordance with the rejection of CBZ by different membranes, where a decrease in pore size increased the rejection of CBZ. Likewise, the increase in porosity increased the gateways for water passage, and high flux was observed. However, an insignificant difference was observed in the porosity and pore size of the membrane with 5% and 5.4% ethanol. A further increase in the concentration of ethanol (6%) sharply increased the porosity (82.33% ± 1.26%) and decreased the pore size (14.67 ± 0.24 nm).
3.2. Photolysis, Photocatalysis, and UF of CBZ
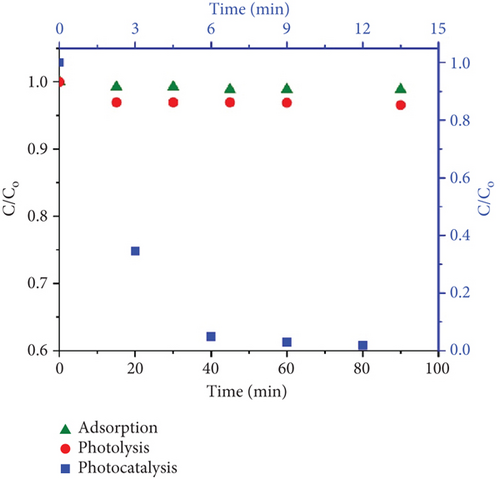
Figure 5a represents the results of photolysis, adsorption, and photocatalysis of CBZ. The photolysis results (red circles) show negligible removal (~2%) of CBZ even after 90 min. Before performing the photocatalysis, the adsorption of CBZ on TiO2 was studied. Then, 1 g/L TiO2 NPs was suspended in 50 mL of 2 mg/L CBZ solution to observe the adsorption. The suspension (TiO2 + CBZ) was magnetically stirred for 90 min, and samples were collected, filtered using a 0.22-μm PES filter, and analyzed for CBZ concentration. It was found that CBZ demonstrated insignificant adsorption (~4%) to TiO2 NPs. Green triangles represent the results of the adsorption of CBZ on P25 TiO2 NPs. Later, the UV light was turned on to study the photocatalysis. It was found that the photocatalysis results (refer to the blue square, top, and right axis) were very promising for the degradation of CBZ, as CBZ was removed entirely in 15 min of photocatalysis, and the degradation rate constant was calculated as 0.33 min−1.
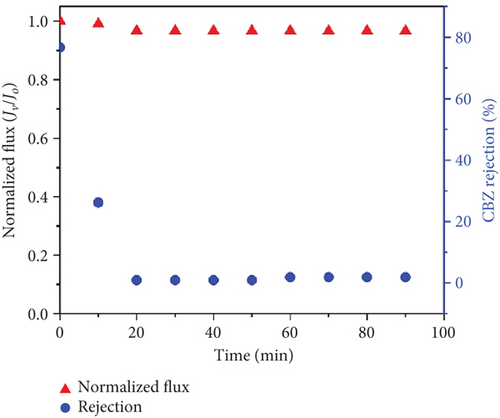
The UF was carried out using a PE-17 membrane (Table 1). Figure 5b shows the results of UF of CBZ. The rejection of CBZ decreased after the UF process was started. After 10 min of UF, the rejection of CBZ was 30%, which became negligible afterward. The negligible rejection of CBZ is associated with the size exclusion phenomenon of the UF process.
3.3. Removal of CBZ by Photocatalytic UF
Figure 6 presents the results of flux and rejection of CBZ with and without UV light for three different kinds of membranes. The membranes were selected based on the initial studies with a wide range of membranes, and the details are presented in Supporting Information 1, 2, and 3. Figure 6a shows the flux of membranes without UV light, and Figure 6b shows the rejection of CBZ without UV light. Among all the membranes, the PE membrane showed the least flux (12 LMH) without any significant variation throughout the filtration cycle. Meanwhile, the SaT-PE membrane showed higher flux than the PE membrane, that is, 22 LMH. The maximum flux was observed for the SaT-PET membrane, 72 LMH. The first membrane (PE) is only a PVDF membrane, and it is well-documented that PVDF is a hydrophobic membrane [25, 34]. The PVDF membrane’s hydrophobicity is by the surface’s CA and zeta potential, where higher CA and −4 mV of surface zeta at pH 6 infer less water attraction. As the surface becomes covered by TiO2 NPs, the flux increases as a hydration layer is formed on the surface because of the hydrogen bonding of NPs with water molecules [35]. This hydration layer helps reduce fouling and enhances the water entry gateways to the membrane matrix. As a result, flux increased, per the CA and zeta of the membrane. Maximum flux was accounted for by the SaT-PET membrane, which was the combined effect of TiO2 NPs’ presence on the surface and in the membrane matrix. The NPs on the surface enhanced the water entry gateways, and the further increase in flux was due to highly hydrophilic water channels in the membrane matrix. The hydrophilic channels resulted from the presence of NPs as nanofillers, which were present in the porous structure of the membrane and impart hydrogen bonding with water molecules to facilitate the passage of water across the width of the membrane. This is also in accordance with CA observation, where CA was reduced as a factor of time, indicating some suction of water droplets and that suction was from inside the membrane matrix. Figure 6b shows the rejection of CBZ for the membranes without UV light exposure. It was found that all the membranes showed negligible rejection of CBZ. The rejection was recorded as > 5% due to the minuscule size of CBZ. It is to be noted that only the size exclusion phenomenon was taking place in the absence of UV, and CBZ owes great resistance to removal under the size exclusion phenomenon. Moreover, Figure 5 shows that CBZ does not show any adsorption on membranes or NPs. Thus, all the membranes failed to reject CBZ, and all the CBZ was passed into the permeate.
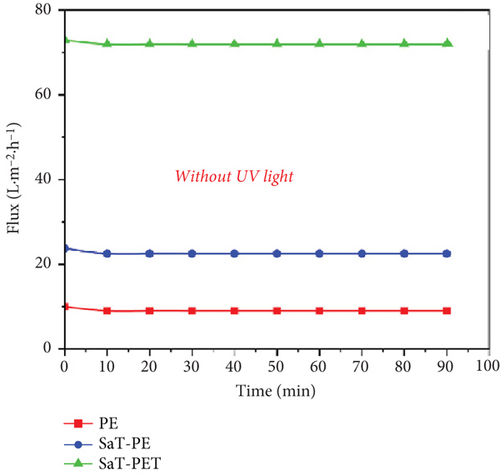
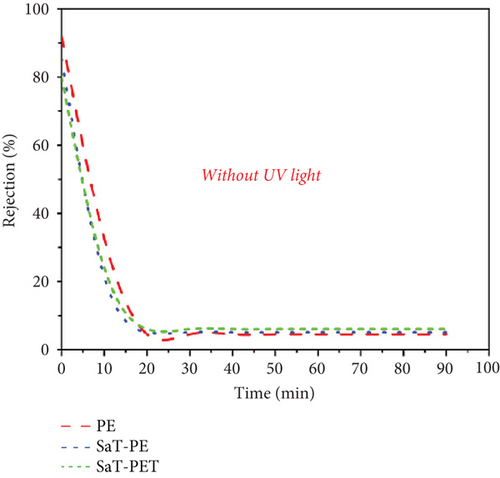
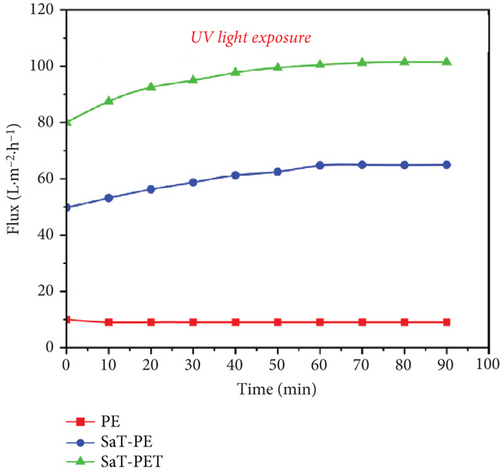
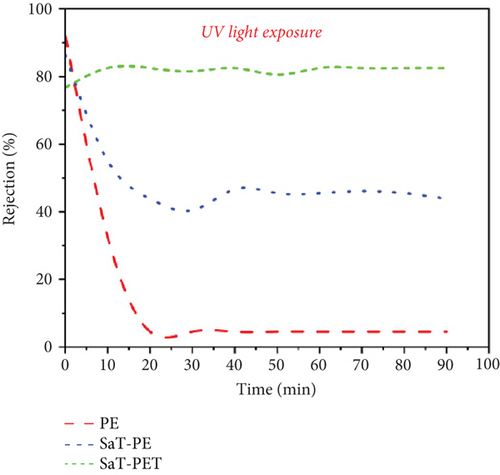
Figure 6c shows the flux of the membranes with UV light exposure. The membranes showed similar flux behavior, that is, the flux increased in the following order: PE < SaT-PE < SaT-PET. However, the PE membrane showed similar flux with and without UV light. Meanwhile, SaT-PE and SaT-PET membranes showed higher fluxes with UV light exposure than without. For the SaT-PE membrane, the first increase in flux was at the start (flux without UV was 22 LMH, and flux with UV was 48 LMH), gradually increasing with time and reaching a stable value of 65 LMH after 90 min. Similarly, in the SaT-PET membrane, the initial flux was 80 LMH, which also increased with time, and at the end of 90 min, the flux reached 100 LMH. A gradual increase in the flux under UV light exposure is attributed to the photocatalytic activity of TiO2 NPs on the surface of the membrane. Under UV light, TiO2 activated and cleaved the water to produce abundant ∗OH, which increased the water uptake capacity of the membrane. Thus, more ∗OH was produced under UV light, and flux increased with time unless TiO2 reached its maximum photocatalytic activity.
Figure 6d shows the rejection of CBZ under UV light. Irrespective of the presence of UV light, CBZ rejection was negligible in the PE membrane. An incredibly significant change in the CBZ rejection was recorded under UV light with SaT-PE and SaT-PET membranes. With the SaT-PE membrane, the rejection of CBZ was initiated at 85% and reduced to 55% after 10 min, finally reaching a stable rejection of 40% thereafter. For the SaT-PET membrane, the rejection was maximum and accounted for ~80% of the whole experiment. The rejection of CBZ under UV light was due to the synergistic effect of photocatalysis and filtration. Further experiments were performed under different conditions to understand the mechanism of CBZ removal under UV light, which is discussed in the later part of the article.
SaT-PET membrane was exclusively used to investigate further the impact of operational parameters on the rejection of CBZ. Figure 7 shows the flux of the membrane and the rejection of CBZ by SaT-PET under different pressures. The flux of the membrane increased with the increase in pressure from 0.05 to 0.1 MPa, irrespective of the presence of UV light. Without UV light, the fluxes were 70 ± 3, 88 ± 5, and 160 ± 5 LMH; with UV light, the fluxes were 105 ± 7, 136 ± 10, and 212 ± 9 LMH at 0.05, 0.07, and 0.1 MPa pressure, respectively (Figure 7a). The increase in flux is directly related to a rise in pressure, that is, the increase in pressure across the membrane pushes more water molecules to enter the membrane matrix via surface pores. It enables them to pass through the membrane. Notably, there is a critical pressure limit after which flux becomes stable, or an increase in flux value becomes insignificant with relevance to applied pressure. However, in the current study, we did not reach that critical pressure value because of the rejection values of CBZ. Figure 7b shows that the rejection of CBZ decreased by increasing the pressure. The rejection of CBZ decreased from 10% to negligible (without UV light) by increasing the pressure from 0.05 to 0.1 MPa. This decrease in rejection was based on transporting more water molecules from the membrane. As CBZ is dissolved in water, the size exclusion phenomenon does not work in this study; thus, more water molecules pass the membrane, carrying more CBZ molecules.
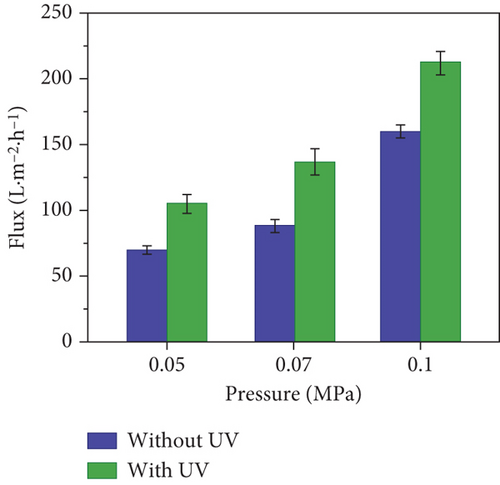
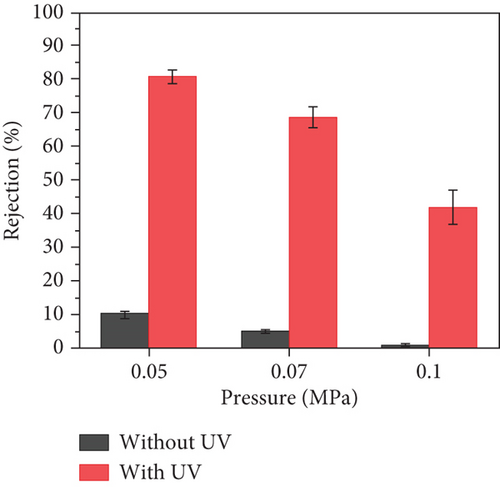
In contrast, the rejection of CBZ under UV light was recorded as significantly astonishing at 0.05 MPa, that is, 81% ± 2%, which decreased to 42% ± 5% when pressure was increased to 0.1 MPa. The rejection of CBZ under UV light did not follow the conventional rejection concept described earlier: by increasing pressure, rejection decreased. The mechanism of CBZ rejection was studied and presented later.
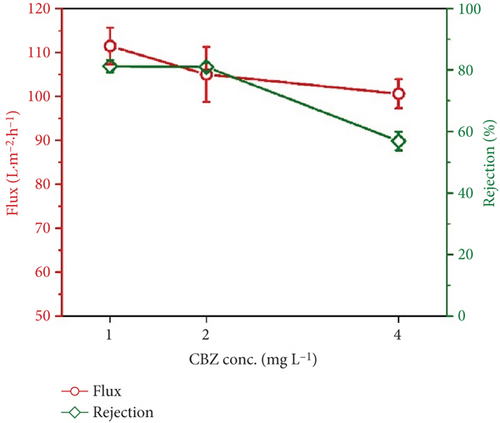
Figure 8 depicts the flux of the membrane and rejection of CBZ under different concentrations of CBZ. The flux and rejection were recorded at 0.05 MPa at 1, 2, and 4 mg/L of CBZ. As the concentration of CBZ was increased from 1 to 4 mg/L, the flux decreased from 111.4 ± 4.2 to 100.6 ± 3.3 LMH. Similarly, the rejection of CBZ also reduced from 81% to 56.9% as the concentration of CBZ increased from 1 to 4 mg/L. For instance, it is considered optimized that a lower concentration of CBZ works well to achieve higher rejection. However, the reason for the decrease in the rejection of CBZ, whether at high pressure or high concentration, has been described in the section on the mechanism of CBZ rejection.
3.4. Membrane Reusability
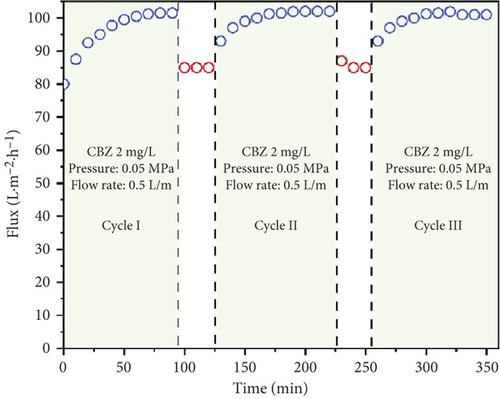
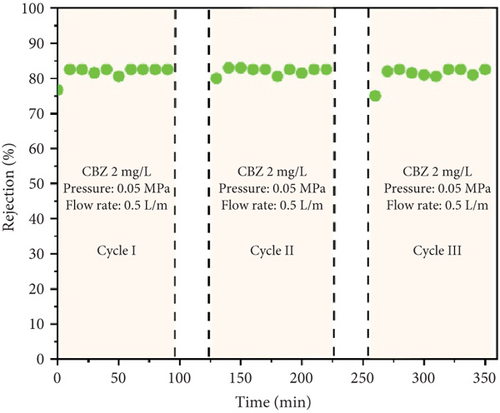
The stability and reusability of the membrane under photocatalytic UF is one of the considerable and important investigations that impart the applicability of the membrane and process. Figure 9a,b shows the flux of the membrane and rejection of CBZ for three consecutive cycles, respectively. The membrane flux increased as the experiment continued and reached a value of 101 LMH after 90 min. The UV light was turned off, the membrane was run with pure water, and its flux was calculated, recording around 85 LMH. The second and the third cycles followed the same behavior as the first cycle and showed increasing flux from their initial value. The increase in flux with time has been described earlier in Section 3.3 (Figure 6). Figure 9b shows the rejection of CBZ in three consecutive cycles, which was around 85%. No decline in CBZ rejection was found even after third cycle. A stable performance of the membrane enlightens its stability. SEM images and FTIR analysis of the membrane were investigated before and after photocatalytic UF to analyze the membrane damage further. Figure 9c shows SEM images and depicts both images are similar and represent no physical damage to the membrane. Figure 9d shows the FTIR spectrum of the membrane before and after photocatalytic UF. FTIR results indicate the presence of a functional group in the bulk of specimens. Peaks in the range of 400 and 700 cm−1 are typical peaks for Ti–O–Ti stretching vibrations. Peaks between 1620 and 1640 cm−1 represent H-O-H stretching due to adsorbed water, and peaks between 3200 and 3600 cm−1 appear due to O-H stretching representing surface hydroxyl groups [36, 37]. Identical peaks of fresh and used membranes indicate no obvious damage to the chemical structure of the membrane at its surface.
3.5. Mechanistic of CBZ Rejection by Photocatalytic UF
From previous results, it has been established that the flux of the membranes increases as the photocatalytic UF process proceeds. However, under different conditions, different rejection behaviors were found. The concentration of CBZ in the feed was analyzed to analyze the phenomena of CBZ rejection by the photocatalytic UF process. Figure 10a shows the concentration of CBZ in feed without UV light. A negligible amount (≤ 3) of CBZ was found to be reduced in the feed tank, irrespective of the initial concentration of CBZ. The rejection of CBZ is shown with different initial concentrations in the inset of Figure 10a. The rejection of CBZ in permeate was also insignificant (≤ 8%, without UV light), irrespective of the initial concentration.
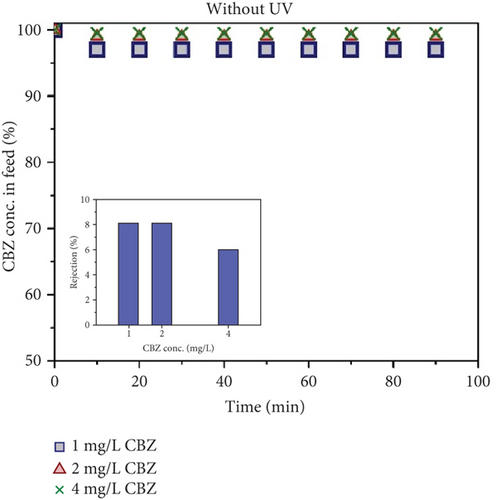
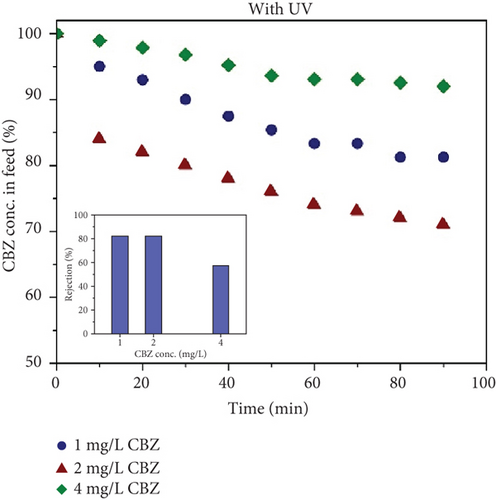
Figure 10b shows the concentration of CBZ in feed during the photocatalytic UF experiment. It was found that the concentration of CBZ reduced up to 19%, 29%, and 8% for 1, 2, and 4 mg/L CBZ concentrations. In the inset of Figure 10b, the rejection of CBZ is shown with different concentrations. For 1 and 2 mg/L, 81% rejection of CBZ was observed. However, for 4 mg/L, the rejection of CBZ decreased to a value of 57%.
From Figure 7, it is clear that exerting more pressure on the membrane reduces the CBZ rejection because of the very big pore size of the membrane relative to CBZ. Moreover, UF is the separation of pollutants based on the size of the pollutant. Considering the size of CBZ, it is impossible to reject CBZ using a conventional UF process (without UV light) (Figure 6). Instead, CBZ is rejected because CBZ is delivered on the membrane surface, where UV-activated NPs on the membrane surface produce ∗OH, transforming the parent CBZ compound and reducing the access of CBZ to the membrane pores. The rejection is highly dependent on the ratio of the potential degradation rate of CBZ and CBZ concentration. In the case of 4 mg/L, rejection of CBZ decreased because the concentration of CBZ seems higher than the degradation rate of CBZ by TiO2 active surface. The available active surfaces of TiO2 were involved in the degradation of deposited CBZ and forthcoming CBZ passed through the membrane. Thus, the rejection of CBZ decreased with the increase in concentration. Therefore, 2 mg/L is supposed to be the maximum concentration of CBZ in feed for effective removal of CBZ.
4. Conclusion
In this study, UF membranes with and without TiO2 NPs were prepared to remove carbamazepine, one of the persistent EOCs. It was concluded that the presence of TiO2 NPs on the membrane surface and their activation are the crux of obtaining a remarkable rejection of CBZ. Integrating TiO₂ NPs onto PVDF membranes proved essential for achieving significant CBZ rejection (80%) under UV irradiation, while membranes lacking TiO2 exhibited negligible removal. The membrane matrix’s optimized constituents and operational parameters could enhance the flux and rejection of CBZ. The SaT-PET membrane demonstrated robust stability over multiple cycles, with no physical or chemical degradation observed postoperation, as confirmed by SEM and FTIR analyses. This durability, coupled with its reusability, positions photocatalytic UF as a sustainable solution for water treatment. More importantly, pressure across the membrane is directly related to rejection of CBZ, that is, high pressure would lead to low rejection and vice versa. Another critical factor for obtaining a high rejection rate of CBZ is its initial concentration, which should be maintained below the oxidation potential of the active surface area of NPs for CBZ. The results also showed that the photocatalysis did not physically and chemically affect the membrane structure. Thus, using the combined technology, photocatalysis, and filtration (while PVDF membrane is used for filtration) is safe for effectively removing CBZ from water. Future studies should explore long-term performance under diverse water matrices and industrial-scale feasibility to advance practical implementation.
Conflicts of Interest
The authors declare no conflicts of interest.
Author Contributions
Conceptualization: Z.U.R.A., H.Y., and M.A.A.; data curation: S.M.S.J. and A.J.E.; formal analysis: H.Y. and A.J.E.; investigation: Z.U.R.A. and S.M.S.J.; methodology: H.Y. and M.A.A.; project administration: M.A.A.; resources: Z.U.R.A.; supervision: H.Y.; validation: Z.U.R.A. and A.J.E.; visualization: H.Y. and S.M.S.J.; writing—original draft: H.Y. and Z.U.R.A.; writing—review and editing: A.J.E., S.M.S.J., and M.A.A. All authors have worked equally and agree to submit to the journal.
Funding
This study was supported by the National Natural Science Foundation of China, 10.13039/501100001809, 21277090; the National Key Science & Technology Project of Water Body Pollution Control and Reclamation, 2014ZX07206001; and the National Research Foundation Singapore, 10.13039/501100001381.
Supporting Information
Additional supporting information can be found online in the Supporting Information section.
Open Research
Data Availability Statement
The data that support the findings of this study are available from the corresponding author upon reasonable request.


