Performance Study of Bladeless Wind Turbine With Dimpled Mast
Abstract
The increasing demand for efficient and sustainable wind energy solutions has led to the development of vortex bladeless wind turbines (VBWTs), which utilize nonrotary masts and electromechanical components to harness wind energy through vortex-induced vibrations. Despite their potential, the aerodynamic performance of VBWTs remains limited by the mast’s geometry, presenting a critical research gap. This study investigates the impact of introducing shallow hexagonal dimples on the mast surface to enhance turbine performance. CAD models were developed with six dimple columns strategically placed at optimal azimuth locations. Using the k-ω SST turbulence model of Reynolds-averaged Navier–Stokes (RANS) equations, the aerodynamic force coefficients were evaluated. Additionally, vibration characteristics such as amplitude and frequency were estimated using a 2D cross-sectional model with Fast Fourier Transform (FFT) analysis. The experimental amplitudes and frequencies of the mast were estimated using a novel amplitude measuring stand. The findings reveal that the dimpled mast significantly improves lift and drag coefficients, vibration amplitudes, and overall power conversion efficiency. Compared to the base model, the dimpled mast achieves a fourfold increase in oscillation amplitude, reaching a maximum amplitude of 25.66 mm. These results demonstrate the effectiveness of surface engineering in optimizing VBWT performance.
1. Introduction
Wind energy has emerged as one of the most promising renewable energy sources in recent decades, owing to its abundance and availability across diverse geographical locations [1]. Traditional wind turbines, characterized by spinning rotors, have been extensively utilized for converting wind energy into electricity and integrating it into electrical networks [2]. However, the inherent limitations of rotary wind turbines, such as noise pollution, high maintenance costs, and environmental concerns like bird strikes, have spurred interest in alternative wind energy technologies [3].
One such innovative concept is the vortex bladeless wind turbine (VBWT), which utilizes flow-induced vibrations or oscillations to harness wind energy without the need for traditional spinning blades [4]. This type of turbine is known as a VBWT. VBWT technology is an alternative way to harness wind energy that utilizes the system’s oscillation to generate vibrations that can be transformed into useful electricity [5].
Compared to the traditional rotating wind turbines, bladeless wind turbines (BWTs) offer significant environmental and economic advantages. By eliminating nonrecyclable composite blades, they reduce waste and promote sustainability. Their design also mitigates risks to birds and bats, addressing key ecological concerns. Additionally, the absence of rotating blades minimizes noise pollution, making them ideal for urban use [6]. Economically, the simplified structure lowers manufacturing and maintenance costs by eliminating complex components like gearboxes. With fewer moving parts, durability increases, extending operational lifespan and reducing replacement costs [1]. Their compact, lightweight design enables decentralized power generation, providing an affordable and sustainable energy solution for remote or resource-constrained areas.
VBWT technology operates on the principle of vortex-induced vibrations (VIVs), wherein cylindrical structures oscillate under the influence of alternating vortex shedding. These vibrations are subsequently converted into electrical energy using built-in aerogenerators [7]. The phenomenon of vortex shedding, often referred to as Kármán vortex street, occurs when vortices form alternately on either side of a cylindrical structure as a fluid flow past it. Synchronization between the shedding frequency and the natural frequency of the structure, known as the lock-in phenomenon, facilitates maximum energy extraction [8–10]. The maximum amount of energy can be extracted in this region [11, 12]. VBWTs offer several advantages, including a low cut-in wind speed, high energy density, and suitability for low-wind-speed regions, making them a compelling alternative for sustainable energy harvesting.
In recent years, numerous studies have explored ways to enhance the performance of BWTs, focusing primarily on optimizing mast geometry, material selection, and attachment designs [13, 14]. For instance, Faris [6] introduced numerical and experimental investigations of a BWT with circular cross-section; he has developed Eigen-frequency simulation modules to determine the structure’s natural frequencies. The output power at the wide range of load resistance was investigated and compared to the experimental results. Adel El-Shahat et al. [15] carried out an experimental case study on tapered BWT with a model developed by a 3D printer suggested that the incapability of the turbine to generate sufficient amount of power. Dai et al. [16] developed a nonlinear-parameter model to harvest energy from VIVs of a piezoelectric cantilever beam with a circular cylinder attached to its end. They have employed experimental methods for validation. As per their report, their results showed the importance of optimized parameters like cylinder’s tip mass, length of the piezoelectric sheet, and electrical load resistance to design enhanced piezoaeroelastic energy harvesters. Salvador et al. [17] conducted actual simulations of a prototype for controlled and uncontrolled wind speed on the use of arc- and disc-shaped pendulum for BWTs. The authors observed a significant increase of voltage on the arc-shaped pendulum. Zhang et al. [18] conducted experiment to study the effect of introducing an interference cylinder between two consecutive aeroelastic energy harvesters in BWT. They obtained improved harvested power and improved bandwidth of oscillation amplitude. Farhan Ramadhany et al. [19] optimized the mechanical design of BWT by adjusting its shape and size parameters, which were determined based on the manipulation of the coefficient of friction using computational fluid dynamics (CFD) simulations. For optimization purposes, they compared three different models and concluded that the first two models were the most suitable for their specific conditions. Dai et al. [16] conducted a comparative study on the application of galloping-based small-scale wind energy harvesters with various tip cross-sections, including square, rectangle, triangle, and D-shape. After wind tunnel tests, the results showed that the square-sectioned tip performed best with a low cut-in wind speed of 2.5 m/s and a high peak power of 8.4 mW. Additionally, they developed an analytical model to validate the experimental data. Francis et al. [20] have developed a new tapered cross-sectioned BWT that was numerically analyzed for various materials and mast dimensions. According to their research, the power generated by this new design is dependent on the length of the mast. They have also found that glass fiber material is the most effective among the materials tested. According to Sun et al. [21], a novel bulb cross-sectional cylinder (15 × 10 bulb cylinder) was proposed as an optimally shaped bluff body for the simultaneous occurrence of two common flow-induced motions: VIV and galloping. This newly designed bluff body was examined both theoretically and experimentally. The study revealed that there was a substantial average power increase of 75% across the entire wind speed range of interest and a maximum power lift rate of 193% at a wind speed of approximately 2.95 m/s when compared to the conventional reference square cross-sectional bluff body. Wang et al. [22] introduced a new piezoelectric wind energy harvester, investigated its method of operation, and reported increased performance with enhanced mass and decreased shell mass, achieving a maximum power output of 1.438 mW within a wide wind speed range.
Researchers like Kang et al. [23] attached a pair of bumps at 600 and 750 azimuth locations on an elastically mounted circular cylinder as an effective way to elevate the energy output for VIV-based energy converters. The effect of these pairs of bumps was quantified numerically, and they recorded noticeable results. González-González et al. [24] aimed at optimizing the shape and surface roughness of BWT and proposed different models. In order to evaluate the suggested models, the researchers conducted experimental tests. The outcomes of these experiments led them to conclude that larger diameters are associated with increased RMS values, suggesting higher energy generation. Additionally, increased surface roughness might reduce the lock-in range, which could impact the performance of slender, circular-shaped wind energy harvesters that rely on VIV.
Despite these advancements, significant gaps remain in the literature, particularly concerning the role of surface modifications such as dimples in enhancing the aerodynamic performance of BWTs, which remains largely unexplored. Dimples, commonly used in aerodynamic applications like golf balls and aircraft wings, have been shown to reduce drag and enhance flow stability by manipulating boundary layer behavior. However, their application in VBWTs, specifically in the form of shallow hexagonal dimple columns at varying azimuthal locations, has not been studied.
This study is aimed at addressing this gap by investigating the impact of dimpled surfaces on the aerodynamic and vibrational performance of BWTs. Using the k-ω SST turbulence model of Reynolds-averaged Navier–Stokes (RANS) equations, the study evaluates force coefficients in a 3D dimpled VBWT model. The Fast Fourier Transform (FFT) method is also employed on a two-dimensional cross-sectional model to analyze vibration magnitudes and frequency ranges. Experimental validation is conducted through amplitude measurements at different wind speeds using an innovative amplitude measurement stand. By integrating computational and experimental approaches, this research seeks to provide a comprehensive understanding of how dimpled surfaces can enhance the efficiency and performance of BWTs, thereby contributing to the broader field of sustainable energy solutions.
2. Materials and Methods
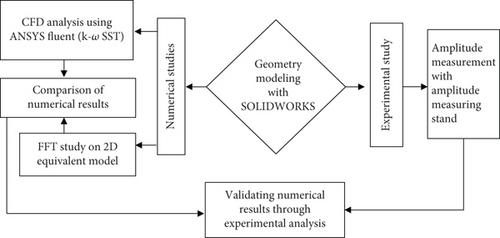
This section describes the proposed mast, a mast with a dimpled surface and geometric modeling. Numerical studies on the 3D and 2D models, followed by experimental investigations on the physical model, are included, as summarized in Figure 1.
2.1. Sizing the Dimpled Mast
In this section, the theoretical background to employ dimples for the application of BWT purposes, a parametric study for dimensioning the reference mast using a mathematical model, and secondary data collections are discussed.
2.1.1. Theoretical Basis of Dimpling Over a Range of Applications
The inclusion of dimples on the mast of the BWT is based on well-established principles in fluid dynamics and VIVs. This section provides a detailed discussion of the physics underlying the choice of a dimpled mast, highlighting its potential benefits in terms of flow dynamics, vortex shedding, and structural stability. Dimples on the mast surface induce localized turbulence, significantly altering the behavior of the boundary layer. When a smooth cylindrical mast is exposed to cross-flow, the boundary layer separates earlier due to the adverse pressure gradient on the leeward side [25]. As Bearman and Harvey demonstrated, dimples create small-scale vortices that energize the boundary layer, enabling it to resist the adverse pressure gradient and adhere to the surface longer. This delay in flow separation reduces the size of the wake region behind the mast, minimizing pressure drag and enhancing aerodynamic performance [26]. The dimples promote an earlier transition from laminar to turbulent flow in the boundary layer. Turbulent boundary layers have higher momentum near the wall, allowing them to overcome adverse pressure gradients and reduce drag more effectively than laminar layers. This behavior aligns with findings by Naruo and Mizota, who studied the influence of dimple depth on aerodynamic performance [27]. In a different area of research, Triet et al. conducted an experimental study on airfoil surfaces with dimples, demonstrating that dimples successfully control flow separation, increase the lift force, and improve aerodynamic efficiency by reducing pressure drag [28]. Velocity contours and streamline plots from CFD analyses demonstrate that dimples induce swirling vortices near the dimpled surfaces, promoting flow adherence and delaying separation [29]. Amzad Hossain et al. performed an experimental comparison of dimpled and smooth surface airfoils, reporting that dimpled airfoils showed approximately a 21.6% increase in lift relative to those without dimples [30]. Butt et al. introduced hexagonal dimple columns on a cylinder with a 90° orientation and conducted both computational and experimental studies, finding significant drag reduction advantages [31]. In other studies, it has been observed that golf balls with circular shallow dimples perform exceptionally well in terms of aerodynamic performance when compared to golf balls with deep circular patterns or hexagonal dimples [32, 33]. As discussed, dimples delay flow separation, reducing the pressure drag acting on the mast. This reduction in drag force decreases the overall aerodynamic load on structures, enhancing durability and operational lifespan.
2.1.2. Parametrizing Dimples on the BWTs
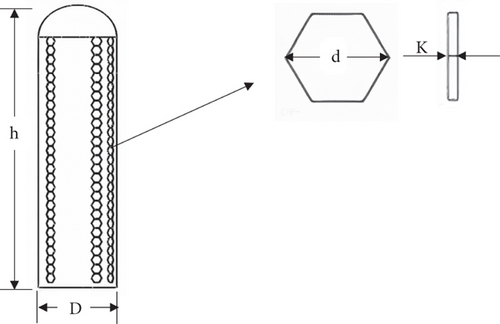
By combining Equation (1) with different dimensionless parameters such as Strouhal number, damping ratio, mass ratio, Reynolds number, reduced velocity, and iterating within feasible ranges, it was possible to design the mast. The dimensions of the reference mast used in the study include its height (h), diameter (D), and the diameter (d) and depth (k) of the dimples, with values of h = 170 mm, t = 4 mm, D = 40 mm, d = 6.25 mm, and k = 0.5 mm.
Keeping in mind the advantages of dimpling discussed in Section 2.1.1, the geometric and positional parameters of the dimples are optimized to maximize their aerodynamic benefits. Hexagonal dimples are chosen for their ability to generate uniform and consistent turbulence across the mast surface, and a depth-to-diameter ratio (k/d) of 1.98 × 10⁻² ensures that the dimples effectively influence the boundary layer without introducing excessive drag [35]. Six columns of dimples are positioned at 75°, 0°, and 180° circumferential locations to target regions of flow separation and account for omnidirectional wind flow. As per the design and sizing, the parametric schematic diagram of the proposed mast is depicted in Figure 2.
The proposed mast’s performance has been thoroughly examined in the coming sections using numerical approaches. For the studies, a 3D model was generated using SOLIDWORKS 2022 and exported to ANSYS Fluent 2023 R1 for CFD studies.
2.2. Numerical Methodology
In this section, two computational methodologies, namely, the RANS and FFT models for investigating the responses of the 3D model and 2D sectional mast, respectively, are discussed for conducting numerical studies.
2.2.1. RANS Models for Estimating Force Coefficients
The flow governing equation in this study is the classic Navier–Stokes equation, as the mast interacts with viscous flow. This interaction requires consideration of viscosity effects and viscous shear stress. To address such flow conditions, the k-ω SST turbulence model is well suited. This model effectively handles open free stream flow, viscous friction near walls, and high-curvature effects, leading to flow separation and reattachment under wind loading. Its capability to manage near-wall interactions makes it particularly suitable for scenarios with these characteristics [36].
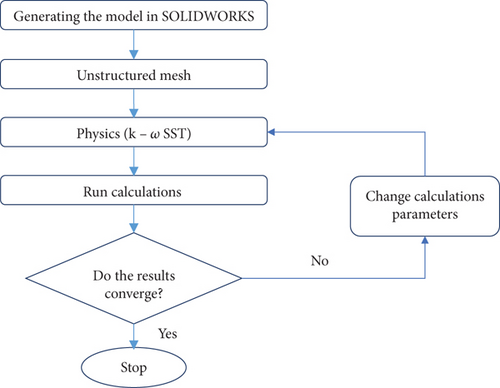
Developed by Menter, the k-ω SST turbulence model was utilized to solve the Navier–Stokes equation for the problems at hand [37]. Overall, the numerical methodology employed to study the 3D model computationally is summarized in Figure 3. The mesh element sizes utilized for the fluid domain, turbine mast face, and turbine mast edges are 3, 1, and 1 mm, respectively. The total mesh count consists of 5,585,511 elements. Figure 4 displays the fluid domain with applied boundary conditions and the generated hexahedral mesh.
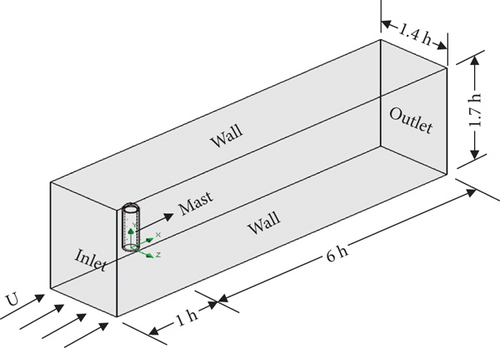
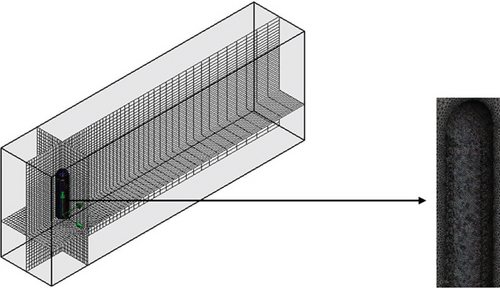
In the final stage of configuring the solver, the number of time steps is set to 200. Each time step has a size of 0.006 s, and 20 iterations were permitted per time step.
2.2.2. FFT Estimation of Amplitudes and Frequencies
An equivalent two-dimensional fluid domain was developed, as illustrated in Figure 5, to estimate the turbine’s frequency and amplitude in the frequency–time space domain using the FFT. Prior to implementing the FFT, the dynamic meshing method was employed, facilitated by a user-defined function (UDF). The meshing for each 2D model was based on all triangles to prevent the occurrence of “negative cell volume” errors. Adhering to this constraint, the mesh size for each domain was fixed at 5 mm, while near the masts, it was set to 1 mm. The mesh count for the 2D turbine mast comprised 45,000 cells, and approximately 4000 nodes were allocated for the VBWT domain. Additionally, inflation settings were applied near the mast to enhance mesh orthogonality and cell quality. Finally, named selections were assigned to define the boundaries as inlet, outlet, fluid domain, mast, and symmetry walls.
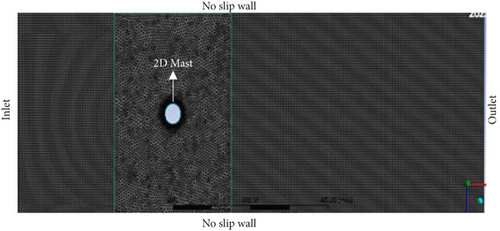
The flow is transient, with boundary conditions set as follows: velocity inlet ranging from 1 to 9 m/s using the named expression (10[m/s] × (1 − exp(−Time/30[s])) as input, pressure outlet, no-slip walls, and dimpled mast. The motion of the cylinder was controlled by a C-language UDF, which was uploaded to the motion attributes section of the dynamic meshing. The dynamic meshing employs spring-based smoothing, height-based layering, and remeshing with a remeshing interval of 1. Following the standard initialization from the inlet, the computation was set to a fixed type time step with 1500-time steps, each with a time step size of 0.001 s and 30 iterations.
2.3. Experimental Setup for Amplitude and Frequency Measurement
In this section, the test conditions utilized to conduct the experiments, experimental setup, and data acquisition techniques are discussed.
2.3.1. Test Conditions Utilized in the Experimental Study
The experiments were carried out at wind speeds of 2, 3, 5, 7, and 9 m/s. This range was chosen to align with the CFD analysis and to test the turbine’s performance under varying wind conditions. A variable-speed blower (HP-1343) was used to generate the airflow. The blower was calibrated using a Testo 450 Sekunden-Anemometer to ensure accurate wind speed measurements at the turbine’s position. Calibration accounted for potential wind speed losses between the blower and the turbine.
The tests were conducted on the scaled-down models of the VBWTs with a height of 170 mm, a diameter of 40 mm, and a thickness of 3 mm. These dimensions were scaled to fit within the experimental setup while maintaining geometric similarity to the full-scale turbines. Later, amplitude and frequency measurements were taken at three positions along the turbine’s height: the top (170 mm), the middle (85 mm), and the bottom (0 mm). The bottom position served as a reference point, where oscillation was negligible.
2.3.2. Experimental Setup
A custom-made amplitude-measuring stand was designed to directly measure oscillation amplitudes. The stand included two 2 × 150 mm slots positioned at 170 and 85 mm heights, allowing transverse movement of pointers attached to the turbine models. These pointers moved sliders with scales (10 cm long) to record the amplitude. As shown in Figure 6, the setup includes a rectangular airflow duct (250 × 300 × 1200 mm) fabricated from 3 mm sheet metal to guide the airflow and minimize dispersion. This sheet metal can either be made of aluminum or other sheet metals. Opposite slots were cut into the duct to accommodate the sliders. Additionally, it comprises a spring-based elastic supports where turbines were mounted on, which were designed to match the calculated stiffness. This ensured that the turbines could oscillate freely in response to wind forces.
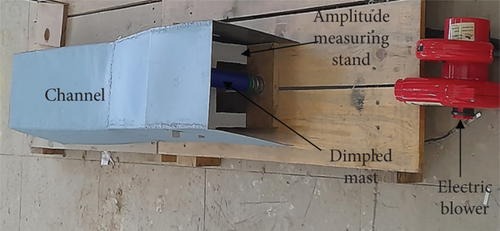
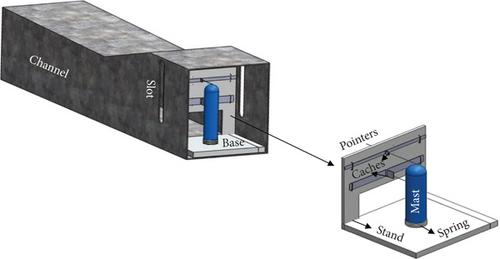
The masts were 3D-printed cylindrical components. The 3D printing fabrication technique was used to seamlessly get the exact dimples of the virtual design and study the effects experimentally. The dimpled mast was fabricated using PLA (polylactic acid), a thermoplastic material for its compatibility with 3D printing technology, since it allows precise and uniform dimple patterns to be created, in addition to its sufficient strength for small-scale testing while being environmentally friendly, aligning with sustainable research practices. PLA was chosen as the material for the mast of the BWT due to its sustainability and ecofriendliness. PLA is biodegradable and made from renewable resources, making it a suitable option for reducing environmental impact. This choice reflects a trend in recent research aimed at improving performance while being environmentally responsible.
For example, the study [40] discusses how to optimize machining processes to save energy and lower carbon emissions. This idea supports the use of PLA, as selecting sustainable materials helps achieve similar objectives in the production of BWTs. Another relevant study [41] shows that ecofriendly methods can reduce energy use during machining. This indicates that incorporating PLA can help lower energy requirements in the manufacturing phase of the BWT. Additionally, research on [42] demonstrates that innovative materials can enhance performance while being sustainable. PLA also provides sufficient strength for the BWT while remaining lightweight, which is crucial for its efficiency. This highlights the need for materials that perform well and are environmentally friendly. The study [43] further illustrates the integration of sustainable practices into manufacturing. The findings suggest that adopting ecofriendly materials like PLA can lead to better manufacturing processes without sacrificing the quality.
Lastly, the research on “Optimizing Wire-Cut EDM Parameters Through Evolutionary Algorithm” emphasizes the importance of innovative techniques to improve cost efficiency and sustainability in manufacturing. This approach complements the use of PLA by allowing for a more efficient production process that reduces waste.
2.3.3. Data Acquisition Techniques
The translatory movements of the sliders, which are dimensioned in millimeters, were measured manually at steady-state oscillations. The average of left hand side (LHS) and right hand side (RHS) oscillations was recorded for each wind speed. A stopwatch was used to record the time taken for 20 oscillation cycles. The frequencies were calculated as the reciprocal of the average time for one oscillation cycle.
2.3.4. Validation of CFD Results
The CFD simulations were compared with experimental results conducted under identical conditions. For instance, the amplitude and frequency values at a wind speed of 5 m/s were used as a benchmark for validation. The agreement between the experimental and computational results confirmed the reliability of the setup.
2.3.5. Potential Sources of Errors
While it was not possible to fully mitigate errors from experimental tests, in this study, some potential sources of errors have been identified, and suitable strategic solutions to eliminate these errors are discussed in brief. The main forecasted sources of errors in the study include manual measurement of amplitudes and frequencies, which may introduce the possibility of human errors. Efforts were made to minimize this by averaging multiple readings. The blower was calibrated, and minor variations in wind speed across the duct could have affected the results. The presence of the amplitude-measuring stand and sliders might have introduced slight resistance to the turbine’s oscillation. The scaled-down models may not perfectly replicate the aerodynamic behavior of full-scale turbines due to differences in Reynolds number and other scaling factors.
3. Results and Discussions
This section presents the results obtained from both numerical and experimental analyses. The flow characteristics around the turbine are visualized through velocity contours, while the lift coefficient and FFT plot of the turbine are also provided. Furthermore, the CFD results are experimentally validated, with corresponding outcomes documented. Finally, the estimation and presentation of the turbine’s power output are discussed.
3.1. RANS Results for the Dimpled Mast BWT
The development of swirling vortices at the rear end of the mast is illustrated in Figure 7, portraying the shedding of vortices. The three-dimensional streamline plots exhibit a pronounced swirling pattern of air particles, indicating the significant impact of dimple columns application on flow dynamics. The incorporation of dimples induces airflow adherence to the surface, advantageous for maintaining lock-in, as evidenced in the images. The strategic placement of dimples on the mast delays boundary layer separation, as it is shown after the separation angle that the flow is still attached to the surface, making noticeable contributions to the continual vibration of the mast. The dimples facilitate the reattachment of air particles to the mast and reduce adverse pressure drag by creating localized turbulence. The graphics in the images clearly show smaller correlation lengths of eddies created in the leeward directions. Short correlation length implies the attachment of the fluid to the structure, creating high-intensity vortex shedding, which will induce strong vibrations to the structure, that is, the mast.
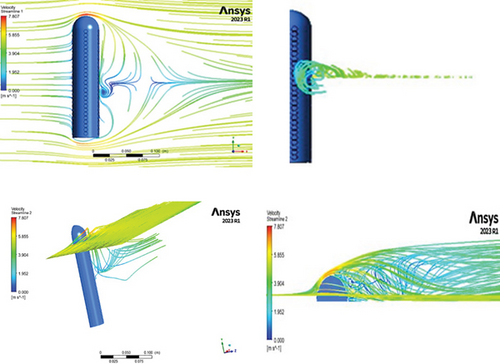
In comparison to the basic mast flow simulations shown in Figure 8, the dimpled mast experiences strong vortex shedding, resulting in augmented oscillations.
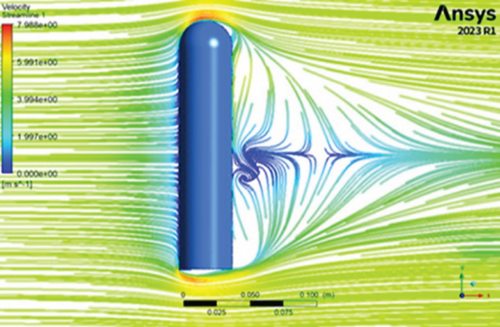
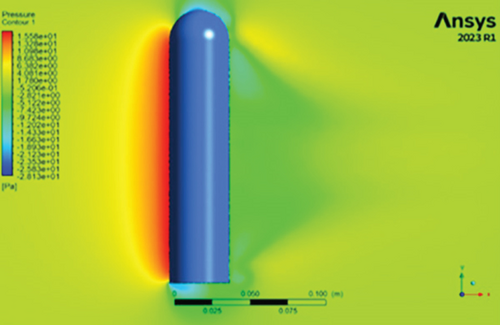
The correlation length of the eddies for the smooth mast was slightly extended, allowing incoming air particles to bypass the mast without effectively transferring their energy. Figure 8a illustrates the velocity contours, and Figure 8b illustrates the pressure contour of a base model, a BWT, highlighting the development of a static pressure zone at the leading edge of the mast. This contour indicates that oscillations in the inline direction were more pronounced compared to those in the transverse direction. However, the oscillations in the transverse direction are preferable since they can have a magnitude almost double that of the inline direction.
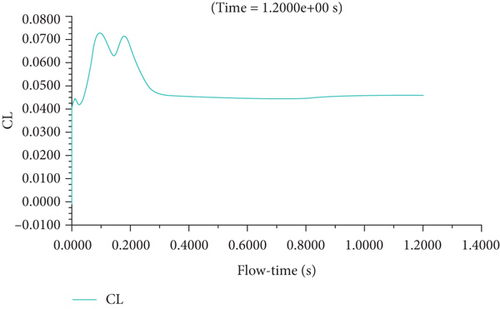
The lift coefficient plot for the dimpled model and reference models at a wind speed of 2 m/s, considering synchronization frequencies, is illustrated in Figure 9. It is notable that the lift coefficient value remains relatively constant across a wide range of velocities.
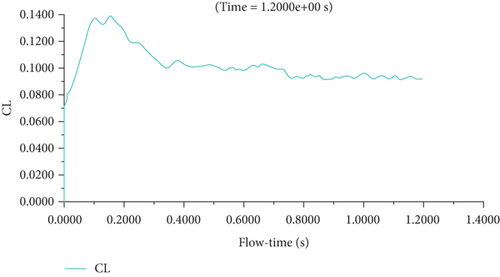
Substituting these values yielded the amplitude ratio value which was determined to be 0.49 at the specified frequency.
3.2. FFT Results for the Amplitude and Frequency Measurements
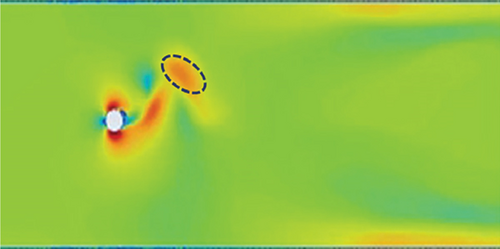
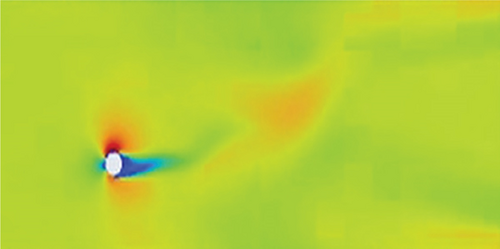
A series of studies were conducted to ascertain the total flow duration for the 2D section of the dimpled mast, with a specific focus on a 15-s timeframe. The velocity contours at intervals of 2, 5, 8, and 11 s are visually represented in Figures 10a, 10b, 10c, and 10d, respectively. The graphical representations provide insight into the initiation and progression of vortex shedding as the flow duration unfolds. Notably, the visualization reveals that vortex shedding commences immediately after 2 s, with an observable increase in the number of vortices shed as the flow duration advances, as evidenced in the graphical representation.
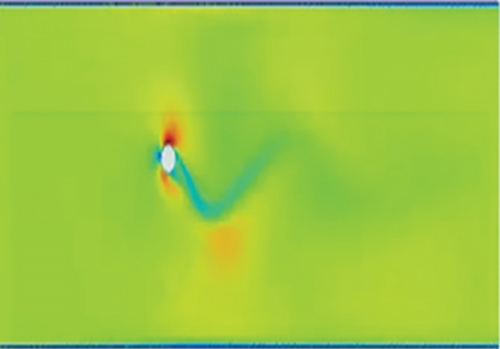
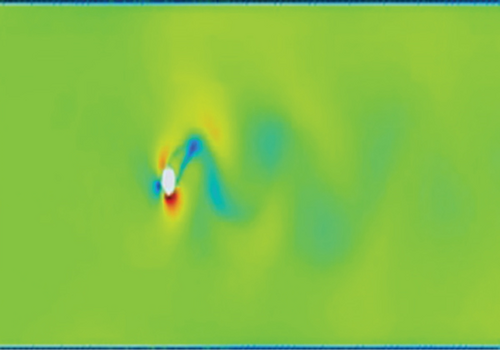
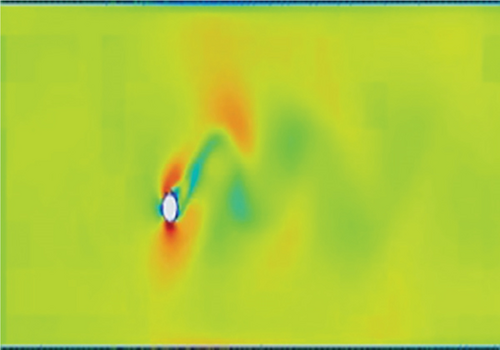
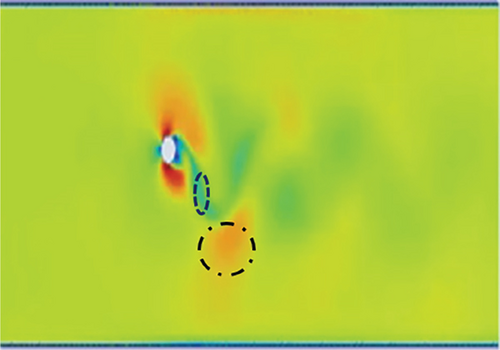
The vortex formation in the dimpled mast turbine is frequent, and vortices pair up with a vortex of the opposite sign. One pair (two counter-rotating vortices) plus one single vortex shed per oscillation cycle. This vortex creates an asymmetric wake with alternating vortex clusters; the mode is (P + S) with staggered wake. The primary vortex pair forms due to shear layer roll-up, and the secondary single vortex detaches from the opposite shear layer (delayed separation). This delayed separation is attributed to the dimples made on the mast. For these delayed separations, this mode of vortex formations has better energy transfer to the structure it is interacting with. However, as shown in the graphics presented in Figure 11, in the smoothed surface mast, the boundary layer separations are early, and the correlation length of counter-rotating eddies is large, leading to bypass of air particles and no chance of reattachment.
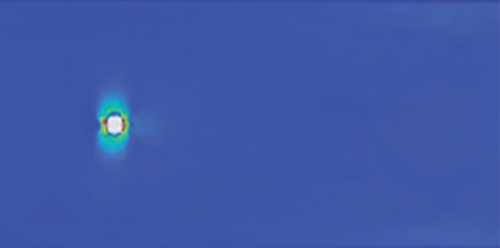
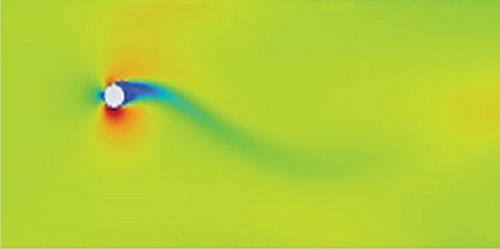
In summary, an intriguing observation pertains to the synchronization phenomenon exhibited by the pattern of vortex shedding as the flow progresses, indicating a noteworthy characteristic of the flow dynamics under investigation. These findings offer valuable insights into the temporal evolution of vortex shedding and its associated patterns, contributing to a deeper understanding of the aerodynamic behavior of the dimpled mast in the context of wind energy harvesting.
Following transient flow simulation on the model, plots were generated by extracting dependent variables such as amplitude ratio, frequency, and phase from independent variables like pressure and vertex average y-velocity of the mast, utilizing probing tools and FFT. Analysis was conducted on a 2D model to ascertain the frequency range with the highest magnitude of lift coefficients. The results of the FFT analysis revealed that the lift coefficients exhibited the highest concentrations of magnitudes between 2 and 20 Hz. The plot for these analyses is depicted in Figure 12. This observation could be attributed to changes in surface roughness, potentially influencing lift forces and thereby altering amplitude magnitude. Moreover, the increased vorticity generated by this model might imply reduced damping, potentially leading to heightened peak amplitudes at resonance frequencies, as demonstrated in the expanded region of the FFT plot. Furthermore, the increased vorticity created by this model might indicate reduced damping, which can lead to elevated peak amplitudes at resonance frequencies, as shown in the expanded region of the FFT plot.
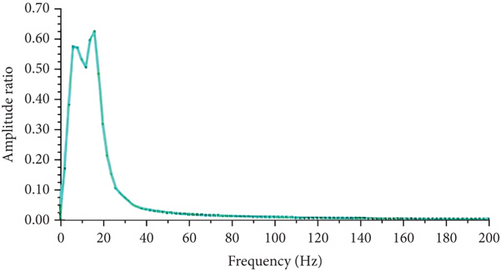
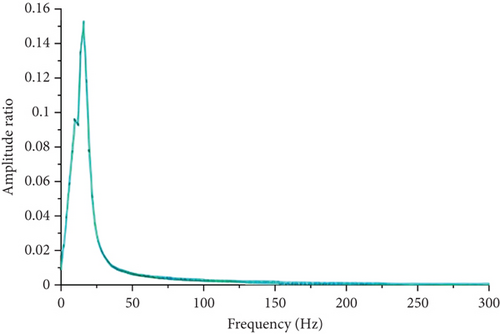
For the dimpled mast, the approximate value of the amplitude ratio at a frequency of 10 Hz is approximately 0.51, slightly higher than the theoretical value of 0.49. However, the difference is within an acceptable margin error of 3.7%. For the base smooth surface, the mast’s oscillation peaked within a narrow synchronization range, with a maximum amplitude ratio of 0.155. Significant oscillation occurred between 5 and 15 Hz, diminished after 50 Hz, and ceased at 200 Hz. At a wind speed of 2 m/s (10 Hz frequency), the amplitude ratio was approximately 0.15, which is almost one-third of the dimpled mast’s amplitude ratio.
3.3. Experimental Oscillation Amplitude and Frequency of Dimpled VBWT
In the computational analysis, this turbine performed admirably. The results of experimental studies also supported that. The dimples had a visible influence on the turbine’s response. The findings for this adjustment are quite encouraging and support the theory that the transverse oscillation is influenced by a localized turbulence effect. This localized turbulence is obviously arising from the dimples. The results at different positions of the scaled down turbine mast are summarized in Figure 13.
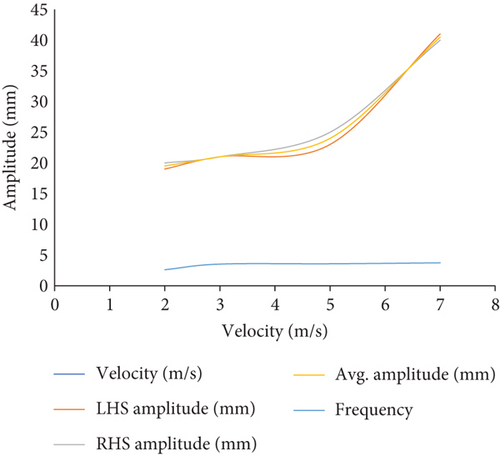
In the provided context, “LHS” denotes “left hand side,” “RHS” signifies “right hand side,” and “Avg.” represents “average oscillation magnitude.”
The frequencies are determined using the conventional period of oscillation and the frequency relationship. The outcomes derived from the preceding figure will subsequently be utilized for calculating the theoretical power output. Notably, the disparities between the computational and experimental investigations are nearly identical, as illustrated in Figure 14.
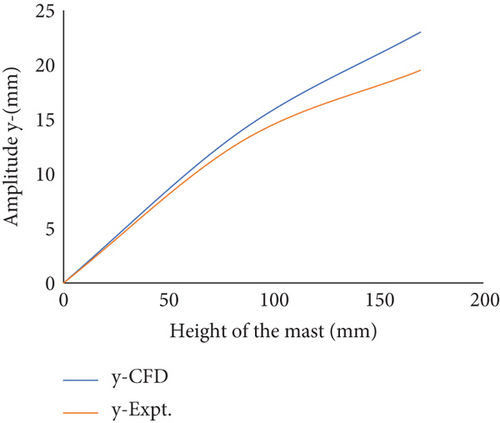
For the reference smooth surface BWT at a 2 m/s wind speed, the maximum recorded amplitude values were 9.5 mm at the tip and 5.5 mm at the middle of the mast, which are relatively small compared to the proposed dimpled mast BWT.
A comparative analysis between the dimpled mast and smooth configurations underscores the relative advantages of the proposed approach. The dimpled mast demonstrated a fourfold increase in oscillation amplitude compared to the smooth mast, with maximum amplitudes of 19.5 and 9.5 mm, respectively, at a wind speed of 2 m/s. This improvement can be attributed to the dimples’ ability to manipulate boundary layer dynamics and enhance VIVs.
3.4. Energy Conversion Using BWT
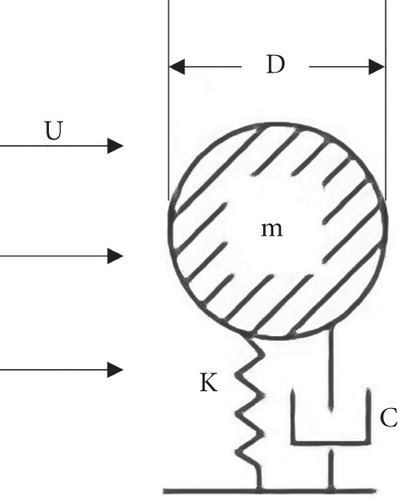
As emphasized in the Introduction section, in a broad context, BWT consists of a bluff body distinguished by a random cross-section. This body is elastically mounted in such a way that only cross-flow motion is allowed and is exposed to a transverse fluid force. This force acts upon a spring-mounted, damped, rigid cylinder, as illustrated in Figure 15.
3.4.1. Estimating Theoretical Power Output of BWT
3.4.2. Analysis on Aerodynamic Efficiency
After substituting parameters into Equation (16) for the dimpled mast wind turbine, the theoretical power generation at a wind speed of 2 m/s and scaled-down dimensions is estimated to be 1 mW. The available wind power at this speed is calculated to be 36 mW. Therefore, the turbine’s efficiency is approximately 4.8%. For a similar smooth-surface mast, the theoretical power generation is estimated to be around 0.21 mW. For this theoretical power output, the aerodynamic efficiency for reference turbine is 0.58%, in comparison to the dimpled mast turbines eight times lower conversion efficiency. The dimpled mast clearly has better performance in terms of power output and conversion efficiency relative to the reference mast, showcasing the importance of adding dimples. This further highlights the importance of surface roughness in the realm of BWTs.
4. Conclusions
- •
Enhanced aerodynamic performance: The dimpled mast demonstrated a significant improvement in lift coefficients 0.09 compared to the smooth mast 0.042. This enhancement is attributed to the dimples’ ability to delay flow separation and promote boundary layer adherence, optimizing VIVs.
- •
Increased oscillation amplitude: Experimental results revealed a fourfold increase in oscillation amplitude for the dimpled mast, achieving a maximum of 19.5 mm at the tip compared to 9.5 mm for the smooth mast at 2 m/s wind speed. This directly translates to improved energy harvesting efficiency.
- •
Energy conversion efficiency: The theoretical power generation for the dimpled mast was estimated to be 1 mW at 2 m/s wind speed, representing a 4.8% improvement over the smooth mast. This underscores the potential of surface engineering to enhance VBWT performance in low wind speed conditions.
- •
Broader synchronization range: The dimpled mast exhibited a wider synchronization frequency range (2–20 Hz) compared to the smooth mast (5–15 Hz), indicating its adaptability to varying wind conditions.
- •
Novelty and practical implications: The study introduces a novel application of shallow hexagonal dimples in VBWTs, leveraging principles of fluid dynamics to enhance performance. Unlike previous studies that focused on complex mast geometries or attachments, this work demonstrates how simple surface modifications can achieve comparable or superior results with lower manufacturing complexity. The findings highlight the practical benefits of dimpled mast designs, including reduced maintenance, lower noise pollution, and suitability for urban and off-grid installations. While the current design shows promise, especially for low-noise and low-maintenance applications, the BWT requires further optimization.
4.1. Future Works
- •
explore the effects of alternative dimple geometries (e.g., circular or triangular) and patterns on aerodynamic performance
- •
investigate the scalability of the dimpled mast design for larger turbines and its performance under high-wind-speed conditions
- •
optimize dimple depth and spacing to maximize energy conversion efficiency
- •
conduct long-term field tests to evaluate the durability and real-world performance of dimpled VBWTs in diverse environmental settings
Conflicts of Interest
The authors declare no conflicts of interest.
Funding
The authors received no financial support for the research, authorship, and publication of this article.
Acknowledgments
The authors would like to express their sincere gratitude to the management of Kombolcha Institute of Technology, Wollo University, for providing laboratory facilities and for their encouragement despite their busy academic schedules. Furthermore, they would like to express their gratitude to Eyuel Kielbasa Etansa, for their support through fabrication.
Open Research
Data Availability Statement
All data generated or analyzed during this study are included in this published article.


