Solution Temperature Compensation Factor for the Measured pH Value of Cement-Based Materials
Abstract
Most of the conventional pH measurements were carried out in acidic to slightly alkaline solutions. In this pH range, the effect of temperature during the measurement is negligible and can be ignored. However, the pH value for highly alkaline solutions is considerably sensitive to their temperature change. A slight difference in temperature can affect the accuracy of the pH test result. Cement-based materials (CBMs) are highly alkaline. The influence of temperature shall be minimised to compare the pH values of different CBMs precisely. In the literature related to pH measurement for CBMs, the solution temperature during the pH measurement was not recorded, whilst the room temperature recorded was in the range of 20°C–30°C. Therefore, solution temperature compensation (STC) shall be introduced into the pH measurement for CBMs to convert the measured pH into the pH value at a reference temperature of 25°C. To this end, firstly, the pH–temperature profile of the solutions was generated to identify the STC factor (fSTC, also known as solution temperature coefficient). Then, the solution temperature-compensated pH (pHSTC) was calculated using fSTC to present the pH value in the reference temperature of 25°C. However, no standardised method exists for the generation of this pH–temperature profile. In this study, a simple method for generating pH–temperature profile and calculating pHSTC for CBMs was introduced.
1. Introduction
Temperature affects the pH value of a solution [1]. As per Le Chatelier’s principle, the dissociation of hydrogen ions and hydroxyl ions increases as temperature increases, thereafter affecting the pH value of a solution [2]. The influence of temperature should be minimised to measure the pH value accurately. Two types of temperature dependency occur in pH measurement: temperature dependency on the instrument used and temperature dependency on solutions [1]. Automatic temperature compensation (ATC) function has been implemented in most existing pH meters in the market by manufacturers, and during development of pH sensors [3, 4] to compensate for the influence of temperature due to sensor’s performance. Regarding the temperature of solutions, Barron, Ashton and Geary [1], Radiometer Analytical [5] and Westlab [6] recommended reporting the temperature of solutions together with the pH value; however, it was rarely practiced.
In most of the conventional pH measurements, the solution temperature was negligible and ignored [7]. A pH–temperature coefficient for the pH of any solutions should be set. This coefficient should be applied to the measured pH value of a solution for the standardisation of a pH report. However, research regarding the pH–temperature coefficient of a solution is limited; research fields include blood [8–10], aqueous humor [11] and seawater [12, 13]. Table 1 shows the pH range for these three types of solutions with their average pH–temperature coefficient. To minimize the error in pH measurement of blood and phosphate buffer saline, Goldoni et al. [14] proposed a linear-correction factor for the temperature range of 30°C–40°C. From the knowledge of the authors, for highly alkaline materials such as cement-based materials (CBMs), none of the researchers either reported the pH value together with the measured temperature or conducted pH measurement at the same solution temperature.
Nowadays, pH measurement is one of the most common chemical measurements conducted in process control [15]. It can be conducted either inline, online, atline or offline [16] as a part of the quality control of a production line. With the laboratory pH test result as a benchmark, the pH results at the production line shall be the same as the benchmark. However, the farther away the measurement takes place from the production line, the higher the possibilities that the temperature for the test solutions deviates. Owing to differences in temperature between a laboratory and a production line, the pH–temperature coefficient of a solution is one of the factors that need to be considered.
Filer and Alison [17] observed a variation in online- and laboratory-measured pH of more than 1.0 pH unit for high-purity water used in a power plant. They resolved this significant measured pH error to no more than 0.1 after addressing the liquid junction potential error and applying the solution temperature compensation (STC). For temperatures ranging 15°C–40°C, a pH–temperature coefficient of −0.032 pH/°C was applied in the online analyser.
In some practices and industries, an accurate measurement of the pH value is essential because an error between the measured pH and actual pH may negatively affect a production line of a factory and cause technical and financial damages. Modla [18] described a sample scenario for a pulp and paper mills, where the pH value measured from the pH sensor in the production line was much lower than the pH value obtained in the laboratory. This significant pH difference for the same sample was due to high variations in temperature of up to 50°C. However, after a pH–temperature coefficient of −0.029 pH/°C was applied, the pH values became similar at the same reference temperature. Therefore, considering STC as a correction factor in pH measurement is essential.
Yokogawa VigilantPlant [19] recommended the pH–temperature coefficient to be set to −0.016 pH/°C for pure makeup water or boiling water reactor samples. For ammonia- or amine-treated samples, the pH–temperature coefficient stated in Gray and Santini [7] and Rosemount Analytical [15] was −0.032 pH/°C, similar to the pH–temperature coefficient of −0.033 pH/°C suggested by Yokogawa VigilantPlant [19].
Depending on the chemistry matrix of a solution when the temperature changes, the measured pH may vary [15]. For a homogeneous solution with a fixed chemistry matrix, the temperature-dependent pH can be characterised and tabulated. For example, Radiometer Analytical [5] formulated an equation for the pH–temperature profile of its 13 types of buffer solutions, with respective coefficients. However, Barron, Ashton and Geary [1] stated that this characterisation is rarely practiced owing to the study being laborious without further elaboration on its procedures. According to Rosemount Analytical [15], the pH–temperature coefficient was normally determined empirically. The reason may be that the pH change with respect to temperature for these process control solutions is more significant than that for non-process control solutions. No standardised method exists for generating the pH–temperature profile of a solution, whilst the methods used in the studies related to blood, aqueous humor and seawater differ depending on the compositions of the solution.
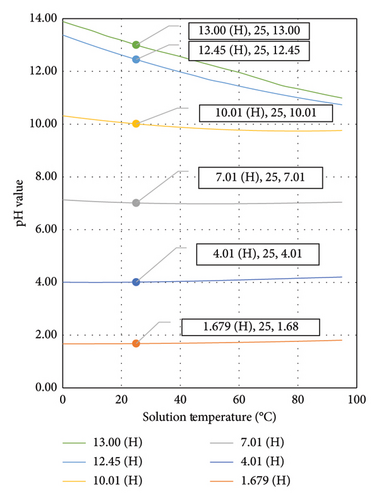
Nowadays, a number of microprocessor-based pH meters are equipped with the preprogrammed pH–temperature profile for the recommended type of buffer solutions to improve the calibration accuracy of pH meters [5]. Therefore, using the buffer solutions recommended by the supplier is important to avoid incorrect calibration. The pH–temperature profile for technical buffer solutions is usually tabulated and printed on the label of the bottle. Figure 1 shows the pH–temperature profile for different pH range buffer solutions from Hanna Instruments. From this figure, the pH change for each solution is not linear across the temperature range of 0°C–95°C. The pH value for highly alkaline solutions varies substantially across different temperatures compared with that for acidic solutions, especially at the temperature range near to room temperature.
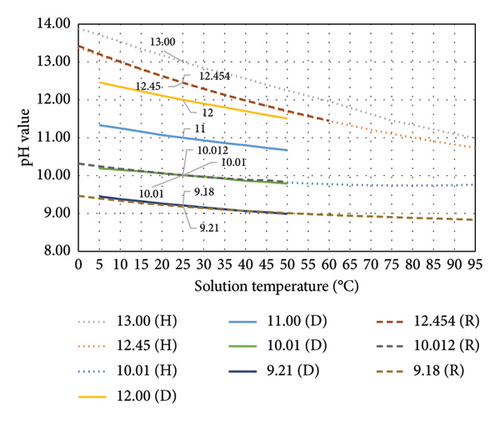
The pH–temperature profiles for three commercial brands of alkaline range buffer solutions, namely, Hanna Instruments (H) [20], Duracal (D) [21] and Radiometer Analytical (R) [5], are compiled in Figure 2. From this figure, a greater pH value change was identified for a solution with higher pH across different temperatures compared with that for a less alkaline solution. The pH value is inversely proportional to temperature. For the solution temperature range of 15°C–35°C, the linearity is higher than that for a wider solution temperature range, as shown in Table 2. This temperature range is reasonable for pH measurement in a laboratory environment at room temperature.
| Buffer solutions | Temperature range (°C) | Slope | R2 | Temperature range (°C) | Slope | R2 |
|---|---|---|---|---|---|---|
| 13.00 (H) | 0–95 | −0.0307 | 0.9976 | 15–35 | −0.0324 | 0.9983 |
| 12.45 (H) | 0–95 | −0.0277 | 0.9885 | 15–35 | −0.0335 | 0.9994 |
| 10.01 (H) | 0–95 | −0.0059 | 0.8620 | 15–35 | −0.0100 | 0.9974 |
| 12.00 (D) | 5–50 | −0.0211 | 0.9983 | 15–35 | −0.0214 | 0.9983 |
| 11.00 (D) | 5–50 | −0.0146 | 0.9955 | 15–35 | −0.0148 | 0.9971 |
| 10.01 (D) | 5–50 | −0.0092 | 0.9979 | 15–35 | −0.0094 | 0.9986 |
| 9.21 (D) | 5–50 | −0.0102 | 0.9912 | 15–35 | −0.0104 | 0.9985 |
| 12.454 (R) | 0–60 | −0.0327 | 0.9931 | 15–35 | −0.0338 | 0.9990 |
| 10.012 (R) | 0–50 | −0.0096 | 0.9772 | 15–35 | −0.0096 | 0.9964 |
| 9.18 (R) | 0–95 | −0.0063 | 0.9488 | 15–35 | −0.0087 | 0.9961 |
Generally, Portland cement consists of 0.3%–1.2% of alkalis (Na2O and K2O) and 60%–67% of CaO [22]. Other than cement, the source of alkalis can be from the unwashed sand dredging from the sea or desert, supplementary cementitious materials (SCMs), admixtures and even mixing water. The hydroxides of these alkali metals and alkaline earth metals are strong bases [23]. Fresh Portland cement paste has a pH of more than 12.5, whilst the pH for high-alkali cement is in the range of 13.5–13.9 [22]. Green concrete that incorporates SCMs normally has lower alkalinity due to the chemical reaction of pozzolan with calcium hydroxide to form C-S-H compound. Within the service life span of concrete, it will be subject to physical, chemical and mechanical damages. The leaching of the alkalis and carbonation of calcium hydroxide will cause its pH to reduce gradually to less than 9 after being fully carbonated [24]. At this alkaline range, the temperature of test solutions will have a significant influence on the measurement, as shown in Figure 2 and Table 2. Most of the studies related to pH for CBMs did not report the temperature of the solution, whilst some reported the room temperature, as listed in Table 3.
Grubb, Limaye, and Kakade [37], Payam, Sumra, and Zainah [38], and Wang et al. [35] presented the pH–temperature profile of an aqueous solution from leached CBMs when testing the pH using a pH electrode. The results of these studies showed that pH dropped as the temperature increased. However, these studies did not further explore the outcome from this finding. The high basicity of the equilibrated aqueous solution is mainly due to the presence of Ca2+, Na+ and K+ ions in the CBMs. A saturated calcium hydroxide has high pH of 12.45 at 25°C, with a pH–temperature coefficient of −0.033 pH/°C [39]; that is, for every 10°C increase in the temperature, the pH value will reduce by 0.33 unit. The pH measurement conducted in the winter and summer may result in different pH values due to the varying temperatures of the environment. Therefore, the temperature of a solution is a concern, but it is not considered in the measurement process for CBMs.
Given the importance of the temperature of a solution in pH measurement, for comparing the pH of two types of solution, the measurement of pH value shall be conducted for pH reading taken at the same temperature. This requirement can be achieved with the help of a high-precision constant temperature water bath during pH measurement [1, 40] or by adopting the STC method, as mentioned earlier. STC converts the pH value at the measured temperature into the reference temperature. Normally, the reference temperature is set at 25°C [15, 19]. The naming of pH buffer solutions is based on their pH value at 25°C; for example, buffer solutions of pH 7.01 and pH 12.45 denote their pH value at 25°C. The influence of temperature on pH measurement is gaining increasing attention, such that Xu and Wu [41] patented their pH conversion method for seven types of solutions, taking into consideration the solution temperature coefficient at a reference temperature of 25°C.
- 1.
To identify a suitable test setup for generating pH–temperature profile.
- 2.
To calculate the pHSTC for different grades of cement mortar.
2. Research Method
The purpose of the first research objective was to prepare a test setup that can generate a reliable pH–temperature profile for a highly alkaline solution. The pH–temperature profile of pH 12.45 buffer solution can be found easily at its bottle or packaging and is ideal to be used as the reference to verify the test setup. Then, the selected test setup would be implemented on CBMs in the second research objective. The equilibrated aqueous solution of the cement mortar obtained using the ex-situ leaching (ESL) method [43] was used to generate the pH–temperature profile within the solution temperature range of 15°C–35°C.
2.1. Materials
Three types of cement mortars with different cement contents were cast into a 70 mm cube, with the cement-to-sand ratios of 1:2, 1:4 and 1:6, and coded as HC (high cement content), MC (medium cement content) and LC (low cement content), respectively. The water-to-cement ratio for all these mortar mixtures was 0.55. These cement mortars were made from ordinary Portland cement (OPC) type I (compliant to MS 522 specification), dry mining sand and tap water in the laboratory. These mortars were fully cured with water and then stored at a dry area after approximately 4 months until the age of testing. The average compressive strength of the HC, MC and LC mortars was 75, 70 and 20 MPa, respectively. For the pH measurement, a whole cubic sample was crushed until all particles were not more than 600 μm [42]. Then, these fine particle samples were sealed in a plastic bag until the time of the pH measurement to prevent carbonation of the samples [38].
2.2. Test Procedures
2.2.1. Verification Test of the Test Setup for Generating pH–Temperature Profile
The pH meter used in this study was Hanna edge pH HI2002 and Hanna digital pH electrode HI11310, with a resolution of 0.01 pH and accuracy of ±0.01 pH. This pH meter comes with ATC features that respond to the performance of the calibrated electrode. Three-point calibration was conducted using buffer solutions of pH 7.01, pH 10.01 and pH 12.45. During calibration, the pH value for these buffer solutions at the calibration temperature was referred [20]. Two different modes of data logging features from the pH meter, which were the log-manual and log-stability (accurate) modes, were explored to conduct this pH test. The pH value and solution temperature were recorded simultaneously by the pH meter. The test setup that generated the pH–temperature profile close to the benchmark was used. The benchmark applied was a buffer solution of pH 12.45 with a known pH–temperature profile. Three sets of filtered fresh buffer solutions for pH 12.45 were prepared. Each sample consisted of a 20 mL test solution that was stored in a 50 mL screw-capped centrifuge tube before the pH measurement to prevent carbonation.
In the log-manual mode, data were logged manually (by pressing the “log” button) by the operator when the temperature displayed on the meter reached the required reading. When the log-stability (accurate) mode was chosen, after the operator pressed the “log” button, the data would be logged when the pH meter detected minimal change in the temperature and potential difference measured. Under this mode, the temperature when the pH data were logged could not be controlled by the operator. Therefore, in the result presented in Payam, Sumra, and Zainah [38] and Wang et al. [35], the pH–temperature profile was generated using a log-manual method or by recording the pH value manually.
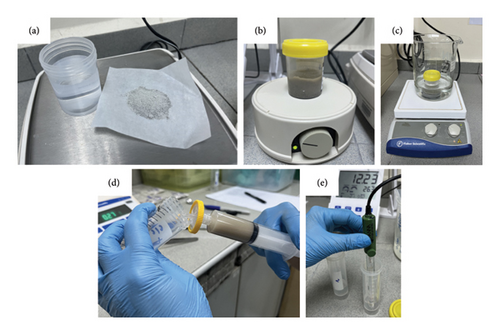
For generating the pH–temperature profile using the log-manual mode, one set of test samples was chilled to about 15°C using an ice-water bath for about 10 min during leaching. The temperature of the ice-water bath was about 6°C, as shown in Figure 3(a). Then, the test sample was placed in a water bath on top of a hotplate during the pH measurement, which gradually heated the test sample to 35°C (Figure 4(a)). The solution was lightly stirred with the pH electrode during the measurement, and data were logged manually as the temperature increased.


For the log-stability mode test, one set of the test samples was chilled to about 15°C using an ice-water bath, and another set of test samples was heated using a hot-water bath to about 35°C during leaching. The temperature of the hot-water bath was about 47°C, as shown in Figure 3(b). During the pH measurement, the pH electrode probe was transferring between these hot and cold test solutions that were slowly equilibrated to room temperature, as shown in Figure 4(b). The solution was lightly stirred by the pH electrode during the measurement to equilibrate the temperature of the pH electrode, the test solution, and the plastic tube. After the pH result in the hot sample was recorded, the pH probe was placed in the cold sample for pH measurement, and vice versa, until the temperatures of both test samples were similar.
2.2.2. pH–Temperature Profile Test on Cement Mortars
Equilibrated aqueous solutions of CBMs for pH measurement with a pH electrode were prepared using the ESL method, similar to Grubb, Limaye and Kakade [37], Payam, Sumra and Zainah [38] and Wang et al. [35]. In the ESL method, cement-based samples are crushed and leached with distilled water for a known duration. Then, the suspension is filtered for pH measurement. In this study, the pH for three types of cement mortars was tested. Before leaching, the samples were crushed and sieved using a #30 sieve, until all particles passed through the wire mesh; that is, all particles (solid) were no more than 600 μm.
With a water-to-solid (w/s) ratio of 2, 20 g of distilled water was added together with 10 g of solid into a screw-capped 60 mL container and then magnetic stirred for 1 min. Afterward, this plastic container was placed in an ice-water bath or in a hot-water bath for 10 min leaching, as shown in Figure 5. Subsequently, the suspension was filtered using a 0.45 μm nylon syringe filter, and the filtrate was discharged into a 50 mL centrifuge tube by using a glass pH electrode for pH measurement [44]. Hanna Instruments [20] recommends using plastic containers to minimise any electromagnetic interferences during pH measurement. Another reason for using a plastic centrifuge tube in this study was its higher thermal insulation than that of glass.
The range of solution temperature shall be between 15°C and 35°C because the pH–temperature profile for this range is in linear relation, as shown in Table 2. For each filtrate, six pH readings were taken at different temperatures, and the solutions were left aside to slowly reach to room temperature after the first reading. Five units of filtrates, namely, two from cold test solutions, two from hot test solutions and one from room temperature test solution, were tested.
The pH–temperature profiles for the five types of solutions were tested. Samples A, B and C are filtrates of HC, MC and LC mortars, respectively, with a w/s ratio of 2. The LC mortar was mixed using w/s ratios of 20 and 50 to study the pH–temperature profile of a lower-pH solution, in which 20.0 g of water was mixed with 1.0 g of solid, and 50.0 g of water was mixed with 1.0 g of solid. The rest of the test procedures were the same. The properties for the test samples in this study are listed in Table 4.
| Sample | Mortar type | W/S ratio used in ESL |
|---|---|---|
| A | HC | 2 |
| B | MC | 2 |
| C | LC | 2 |
| D | LC | 20 |
| E | LC | 50 |
3. Results and Discussion
3.1. Verification of the Test Setup for Generating pH–Temperature Profile
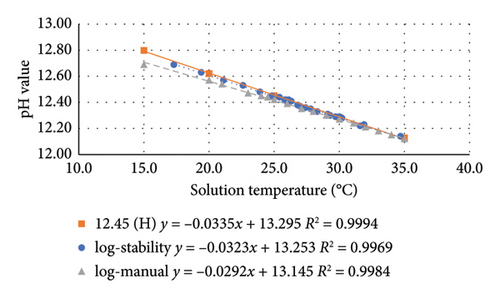
The pH–temperature profile of the benchmark sample (pH 12.45 buffer solution) within a temperature range of approximately 15°C–35°C was generated, as shown in Figure 6. Both modes of data logging (stability and manual) produced results in linear trendlines with a high coefficient of determination (R2). At 25°C, the pH for the log-stability mode was 12.45, whereas the pH for the log-manual mode was 12.42. The result of the log-stability mode was very close to the specification provided by the manufacturer (labeled as 12.45 (H)), as presented in Figure 6. Therefore, the log-stability mode was preferred and selected for the remaining test in this study.
3.2. pH–Temperature Profile and STC Factor for Cement Mortars
The pH–temperature profiles for the five types of test samples are depicted in Figure 7. A linear relationship existed between pH value and solution temperature with a strong correlation for each type of sample. This result reflected that the designed test procedure is reliable. Samples A and B had similar pH value and linear trendline, probably due to the leached solution being at saturation for both types of these materials. All the samples leached using a w/s ratio of 2 had a similar slope of −0.035 pH/°C, which was called the STC factor (fSTC).
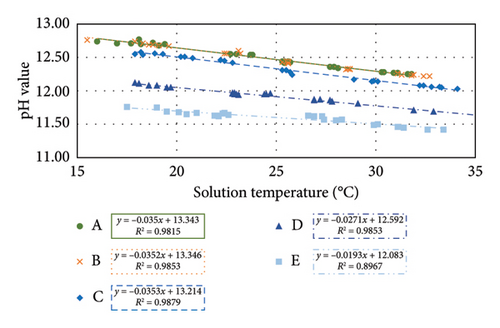
For diluted samples D and E, their pH was reduced compared with that of sample C. Amongst these highly alkaline test solutions, the lower the pH, the lesser the gradient of the linear trendline. This finding correlated with the trend in Figure 2. From this figure, the pH value for sample B at 24°C was the same as the pH value for sample C at 20°C, implying that the pH measurement for CBMs is highly sensitive to temperature. If the solution temperature was disregarded, both samples might be misunderstood as having the same pH value.
The pH–temperature profile of sample B obtained in this study was very close to that of the buffer solution of pH 12.45, as shown in Figure 8. In this figure, the pH-temperature profile for paste and mortar from other research using ESL method were incorporated for comparison. Although the equilibrated solutions were obtained using ESL method, the pH meter and test setups were not the same and lacked detailed description. From this figure, the slope of the linear trendline in Grubb, Limaye and Kakade [37]’s study was −0.1111, that in Payam, Sumra and Zainah [38]’s study was −0.0097 and that in Wang et al. [35]’s study was −0.0083 for OPC paste and −0.0118 for C60-SF paste. The different slopes reported were attributed to the diverse ways of generating the pH–temperature profile. The small temperature range presented in Grubb, Limaye and Kakade [37] was the recorded solution temperature whilst measuring pH of different cementitious materials in the study without chilling or heating the solution. This shows that the solution temperature is not always the same under the same environment. The slope value in the study is less meaningful because it is not from the same sample. However, it has a negative slope that is consistent with the rest of the studies. The pH meter used in Payam, Sumra and Zainah [38] did not have data logging function as the current study. In the study, the pH reading was taken at every interval of 1°C whilst increasing the temperature of the solution, and it was not the stabilised pH reading at that temperature. From the results presented by Wang et al. [35] where the pH reading was taken at the exact interval of 5°C, it was suspected that the pH reading also was not the stabilised pH reading.
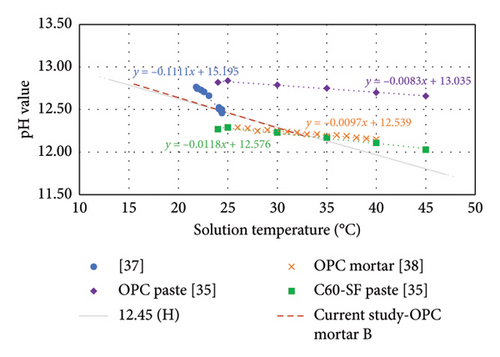
Measuring the pH value whilst heating up a solution on a hot plate may not be suitable because the change in the solution temperature is excessively fast for a glass pH electrode to respond. During a pH measurement, the pH meter will read the potential difference (in mV) and the temperature of the aqueous solution. Then, these values will be utilised to calculate the pH value of the solution after incorporating the calibration data into the Nernst equation [7, 15]. The displayed pH value on the pH meter is the pH value after ATC [20]. Therefore, the test setup should be qualified with a known benchmark solution.
In this study, the data were recorded using “stability-accurate mode,” with the temperature in accuracy of 1-decimal point. A pH meter normally takes a few seconds to identify the stabilised data to be recorded. If the temperature fluctuates, the pH meter will not be able to record the data in this mode because the pH value will change when the solution temperature changes. The temperature values recorded in [35, 38] studies were in integer. Therefore, the pH values were assumed to be recorded through observation and manual recording, which may not be a suitable method to generate the pH–temperature profile of a solution.
The pHSTC value at 25°C can be calculated by substituting 25 into the T (temperature) of the linear equation for each pH–temperature profile, as listed in Table 5.
| Sample | Linear equation of pH–temperature profile | fSTC | pHSTC |
|---|---|---|---|
| A | pHSTC = −0.0350T + 13.343 | −0.0350 | 12.47 |
| B | pHSTC = −0.0352T + 13.346 | −0.0352 | 12.46 |
| C | pHSTC = −0.0353T + 13.214 | −0.0353 | 12.33 |
| D | pHSTC = −0.0271T + 12.592 | −0.0271 | 11.92 |
| E | pHSTC = −0.0193T + 12.083 | −0.0193 | 11.60 |
4. Conclusions
- 1.
Temperature may significantly affect the pH value of a highly alkaline solution. Therefore, for pH measurement of CBMs, solution temperature-compensated pH, pHSTC (pH value at 25°C) shall be reported, instead of measured pH (raw pH read from a pH meter).
- 2.
The pH–temperature profile of a solution should be generated within the temperature range of 15°C–35°C for a linear relation with high R2.
- 3.
Not all types of pH meter can generate the pH–temperature profile of a test solution. The test setup for the pH–temperature profile must be verified with a known buffer solution near to the pH of the test solution.
- 4.
The STC factor (fSTC) for pH of a solution is the slope of the linear equation for its pH–temperature profile, and it is always in negative value for alkaline solutions.
- 5.
The pHSTC of a solution can be calculated from a linear equation (the equation in Table 5) for its pH–temperature profile by substituting the reference temperature of T = 25°C. Alternatively, when fSTC is known, pHSTC can be calculated using pHSTC = [(25 − T) × fSTC] + pH, where T is the temperature whilst measuring pH, and pH is the measured pH value.
Conflicts of Interest
The authors declare no conflicts of interest.
Funding
No funding was received for this research.
Open Research
Data Availability Statement
The data that support the findings of this study are available from the corresponding author upon reasonable request.


