Predicting Tensile Strength in SFRC: Effects of Fiber Composition and Comparative Regression Analysis
Abstract
This study investigates the effects of varying steel fiber compositions on the workability, compressive strength, and tensile strength of steel fiber–reinforced concrete (SFRC). A total of 52 SFRC mixtures were prepared with different water-to-cement (w/c) ratios ranging from 0.30 to 0.60. The fiber volume fraction ranged from 0% to 1.5%, and the aspect ratio varied between 30 and 60. The results indicated that although the addition of steel fibers reduced workability and compressive strength, it significantly enhanced tensile strength, especially in mixtures with 1.5% fiber content and low w/c ratios. In terms of aspect ratio, a value of 50 generally resulted in the highest tensile strength across most mixtures. The study also compared the performance of three statistical regression techniques, namely, multiple linear regression, support vector machines, and fine tree regression, for predicting tensile strength. Among these methods, multiple linear regression showed the best performance by achieving a coefficient of determination (R2) of 0.910, a root mean square error (RMSE) of 0.203, a mean squared error (MSE) of 0.041, and a mean absolute error (MAE) of 0.156. These findings highlight the critical role of fiber composition in SFRC mix design and demonstrate the strong predictive capability of linear regression for estimating concrete tensile strength.
1. Introduction
The tensile strength of steel fiber–reinforced concrete (SFRC) is affected by several key parameters, including the water–cement ratio (w/c), fiber volume, and aspect ratio [1–4]. The incorporation of steel fibers has been shown to significantly enhance tensile and flexural strength, while also improving crack resistance, postcracking behavior, and energy absorption [5–9]. However, high fiber content or extreme aspect ratios can adversely affect workability and even reduce compressive strength due to compaction challenges [10, 11]. These limitations can be mitigated through optimized mix designs and the use of mineral additives such as metakaolin or silica fume [12].
In recent years, concrete research has advanced significantly through the application of numerical methods for mechanical and environmental characterization [3, 13, 14]. Increasingly, researchers have employed statistical regression techniques to predict concrete properties based on varying mix proportions, offering valuable insights for optimizing performance across diverse applications [15–19]. In the case of SFRC, accurately predicting tensile strength requires a deep understanding of the relationships between fiber characteristics, volume fraction, and mechanical behavior. For instance, predictive models tailored to hooked-end steel fibers, such as those for splitting tensile strength, underscore the importance of fiber geometry and distribution in assessing tensile performance [4, 20].
However, accurately predicting this property in SFRC remains challenging due to the complex, nonlinear interactions between various mixture constituents such as cementitious materials, aggregates, fiber geometry, and chemical admixtures. Predicting tensile strength requires detailed knowledge of how fiber type, aspect ratio, and volume fraction interact with other mixture components.
To address this complexity, researchers have increasingly adopted statistical regression techniques to forecast concrete properties. Multiple linear regression (MLR), support vector machines (SVMs), and fine tree regression are among the most commonly used methods. These models differ in their assumptions, interpretability, and flexibility: MLR offers simplicity and transparency; SVM excels in handling nonlinear and high-dimensional data; and fine tree regression can capture variable interactions with minimal preprocessing. Linear regression has been shown to effectively predict concrete properties with acceptable accuracy due to its simplicity and interpretability [20–25]. SVM has also demonstrated strong performance in modeling complex nonlinear relationships, such as predicting shear or compressive strength [26–29]. In addition, tree-based models have been effectively employed to develop mix design methods based solely on concrete mix proportions with high accuracy, as well as to predict compressive strength at elevated temperatures [30–32].
Although previous studies have examined the mechanical behavior of SFRC and proposed various predictive models, most have focused on a single fiber type or used only one modeling technique. There is limited research on the combined effects of different steel fiber types and the comparative performance of multiple regression models using a consistent dataset. This study addresses that gap by analyzing how steel fiber compositions affect workability, compressive strength, and tensile strength. It also evaluates the predictive accuracy of three statistical models: MLR, SVM, and fine tree regression, in estimating the 28-day tensile strength of SFRC. These models were selected for their ability to handle different data patterns and relationships. Based on a broad experimental dataset, the study is aimed at establishing a reliable and practical framework for predicting the tensile strength of SFRC.
2. Materials and Methods
To establish a reliable database on concrete compressive strength, variations in five parameters, namely, w/c ratio, fiber aspect ratio (length/diameter), fiber volume (Vf), compressive strength (fc), and slump, have been taken into account. The experimental data used to forecast the tensile strength (ft) of SFRC in this study were generated in the laboratory.
2.1. SFRC Mixture Composition
The test specimens were prepared using ordinary Portland cement (OPC), tap water, gravel and sand as coarse and fine aggregates, a superplasticizer (SP), and straight steel fibers. All materials, including cement, aggregates, and admixtures, were sourced from certified suppliers and verified through standard ASTM testing procedures. The detailed mix proportions used in this study are presented in Table 1.
| Material | Proportion/value |
|---|---|
| Water–cement ratio (w/c) | Varies (0.3, 0.4, 0.5, 0.6) |
| Cement (kg) | 380 |
| Fine aggregate (kg) | 1032 |
| Coarse aggregate (kg) | 784 |
| Superplasticizer dosage (%) | Varies (0.5–2) |
| Steel fiber volume content (%) | Varies (0.5, 1, 1.5) |
| Fiber aspect ratio (l/d) | Varies (30, 40, 50, 60) |
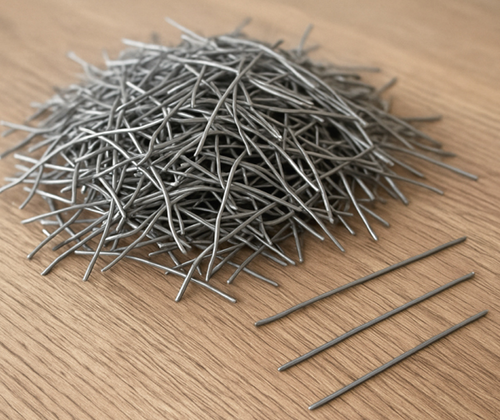
Concrete mixtures were prepared with w/c ratios of 0.30, 0.40, 0.50, and 0.60, maintaining a gravel-to-sand ratio of 57:43. The dosage of SP was fixed, based on the amount required to achieve a target slump of 120 mm in the control mix without fiber, ensuring that any changes in workability could be attributed to the presence of steel fibers. Steel fibers were incorporated at volume fractions of 0.5%, 1.0%, and 1.5%, with aspect ratios ranging from 30 to 60. These fibers were straight, conventional steel wires with a constant diameter of 1 mm and lengths of 30, 40, 50, and 60 mm, manually cut to the desired dimensions (Figure 1). A total of 54 different concrete mixtures were prepared. Except for the plain control mix, each fiber-reinforced concrete mix was labeled based on its w/c ratio, fiber aspect ratio, and fiber volume. For example, the designation “WC0.3A30V0.5” refers to a mixture with a w/c ratio of 0.3, a fiber aspect ratio of 30, and a fiber volume of 0.5%.
2.2. Sample Preparation
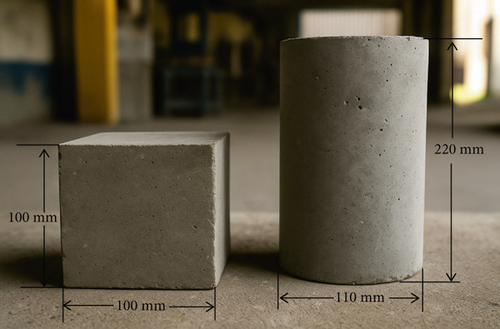
Concrete specimens were prepared in both cube and cylinder forms for mechanical testing. Cubes with 100 mm side length were cast for compressive strength and electrical resistivity tests, while cylinders with dimensions of 110 mm in diameter and 220 mm in length were prepared for the splitting tensile strength test as shown in Figure 2.
The preparation process began by weighing all constituent materials, including cement, water, aggregates, and steel fibers, using calibrated digital scales to ensure accuracy. The mixing process started with combining fine and coarse aggregates in a rotary concrete mixer for 1 min. Cement was then added to the mixture, and mixing continued for another 1 min. Steel fibers were introduced next, followed by an additional 1 min of mixing. After that, half of the total mixing water was gradually added and blended for 3 min. The remaining water, premixed with the SP, was then incorporated, and mixing continued for a final 3 min to achieve a uniform and workable concrete mix.
Once the fresh concrete was ready, it was cast into clean, preoiled steel molds and compacted using a vibrating table to eliminate air voids. All specimens were demolded after 24 h and immediately transferred to a curing chamber maintained at constant temperature and relative humidity. Curing was continued for 28 days under these controlled conditions. To standardize surface moisture conditions before testing, all specimens were removed from the curing chamber and stored in ambient room conditions for 24 h prior to testing.
2.3. Test Method
All testing instruments, including the compressive and splitting tensile strength machines, were regularly calibrated in accordance with manufacturer specifications and relevant industry standards to ensure the accuracy and reliability of test results. For both compressive and splitting tensile strength tests, three specimens were tested per mix to ensure statistical representativeness and reduce variability.
2.3.1. Slump Test
The workability of fresh concrete was evaluated immediately after mixing using the slump test in accordance with ASTM C143. A standard slump cone was filled in three layers, each compacted with 25 strokes using a tamping rod. The slump value was then measured as the vertical difference between the height of the mold and the displaced concrete.
2.3.2. Compressive Strength Test
Compressive strength testing was conducted at 28 days following ASTM C39/C39M-21. Cube specimens (100 mm × 100 mm × 100 mm) were used. The test was performed using a compression testing machine under loading rate control (0.3 MPa/s), with the load applied continuously and without shock at a constant rate until failure. The maximum load was recorded, and compressive strength was calculated accordingly.
2.3.3. Splitting Tensile Strength Test
The splitting tensile strength test was carried out in accordance with ASTM C496/C496M-17 at 28 days. Cylindrical specimens (110 mm in diameter and 220 mm in height) were placed horizontally in the compression testing machine. As with the compressive test, the load was applied under loading rate control of 0.02 MPa/s until failure. The peak load was recorded and used to calculate the splitting tensile strength using the standard formula.
2.4. Method of Prediction
- •
w/c ratio: 0.30–0.60
- •
Steel fiber volume fraction (Vf): 0.5%, 1%, 1.5%
- •
Fiber aspect ratio (length/diameter): 30–60
- •
Slump: 70–118 mm
- •
Compressive strength (fc): 24.1–49.36 MPa
The models were developed using MATLAB’s Regression Learner App. For the MLR model, a standard linear regression preset was applied. The SVM model used a linear kernel, with kernel scale, box constraint (C), and epsilon (ε) parameters automatically determined by MATLAB. The fine tree model was configured with a minimum leaf size of 4, and surrogate splits were disabled.
To avoid overfitting and ensure reliable performance estimation, five-fold cross-validation was employed. The data were randomly partitioned into five subsets; each subset was used once as the validation set while the remaining four subsets were used for training.
Model performance was assessed using four standard metrics: root mean square error (RMSE), mean square error (MSE), mean absolute error (MAE), and coefficient of determination (R2). These metrics provided a quantitative evaluation of how closely each model’s predictions matched the actual experimental results.
The RMSE model provides insight into the average deviation between each actual data point and its corresponding predicted result. RMSE is calculated by taking the square root of the average of the squared differences between the predicted values and the actual values. This metric gives a clear sense of how closely the model’s predictions match the observed data by emphasizing larger errors more heavily, due to the squaring process. Since RMSE is expressed in the same units as the dependent variable, it is directly interpretable and allows for straightforward comparison. On the other hand, the MSE calculates the average of the squared distances between each predicted value and the corresponding true value. Similar to RMSE, MSE penalizes larger errors more significantly, making it sensitive to outliers. While MSE provides a measure of the average error magnitude, its value is in squared units of the dependent variable, which can make it less intuitive to interpret compared to RMSE. The MAE model calculates the average error by considering the absolute difference between the actual data and the predicted results. Unlike RMSE and MSE, MAE does not square the errors, meaning it does not disproportionately penalize larger errors. As a result, MAE is a more robust metric in the presence of outliers and provides a straightforward measure of the average error magnitude. The simplicity of MAE makes it an attractive choice for many applications, as it is easy to understand and interpret. Finally, the value of R2 commonly describes how well the sample regression line fits the observed data. R2 measures the proportion of the variance in the dependent variable that is predictable from the independent variables. An R2 value ranges from 0 to 1, with higher values indicating a better fit of the model to the data. R2 close to 1 suggests that the model explains a large portion of the variance in the observed data, implying a strong relationship between the predictors and the response variable.
Let n represent the sample size, α1 denote the predicted values, and represent the mean of predicted values. Similarly, β1 represents the real values, and denotes the mean of real values for tensile strength of SFRC.
3. Results and Discussion
3.1. Workability
Figure 3 illustrates the slump values for each concrete mixture, highlighting a reduction in workability as steel fibers are incorporated. The control data for ordinary concrete, without fibers, shows that the slump values for each mixture, across different w/c ratios, maintain an approximate value of 120 mm. However, with the introduction of steel fibers, a decline in slump values becomes evident.
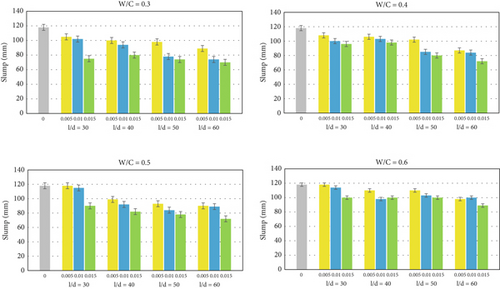
Mixtures featuring a w/c ratio of 0.3 and a consistent length-to-diameter ratio of 30 exhibit a decline in flowability, with reductions of 11.0%, 13.5%, and 36.4% observed for steel fiber volumes of 0.5%, 1%, and 1.5%, respectively. This highlights a clear correlation between the increasing fiber content and the diminishing workability of the mixtures. Simultaneously, a reduction in slump is evident with an increase in the fiber aspect ratio. For mixtures with a constant fiber volume of 0.5% and a w/c ratio of 0.3, the slump decreases by 11.0%, 15.2%, 16.7%, and 24.5% for fiber aspect ratios of 30, 40, 50, and 60, respectively. This highlights the impact of the aspect ratio on the slump, emphasizing a consistent decrease as the fiber aspect ratio rises. This observed trend persists consistently across various w/c ratios (0.4, 0.5, and 0.6), indicating a systematic correlation between the diminishing slump values and increasing in fiber volume and aspect ratio. The figure also demonstrates that the w/c ratio is a crucial factor in determining the workability of concrete mixtures, especially when steel fibers are incorporated. Higher w/c ratios consistently lead to higher slump values, indicating improved workability. This effect is evident across all levels of fiber volume and fiber aspect ratio, suggesting that adjusting the w/c ratio is a significant variable to maintain the desired workability in fiber-reinforced concrete.
The addition of steel fibers to concrete can reduce the slump due to the stiffness of the fibers. This phenomenon also can be attributed to the decreased binder content and the intensified interlock between aggregates and steel fibers [35]. Additionally, the random distribution of steel fibers within the matrix acts as a skeletal structure, impeding the smooth flow of fresh concrete [11, 36]. Consequently, these factors collectively contribute to the reduction in workability observed in the concrete mixtures containing steel fibers.
3.2. Compressive Strength
Figure 4 illustrates the average compression strength of three cube specimens for all mixtures at 28 days. For mixtures with a w/c ratio of 0.3, all mixtures with low percentages of fiber (0.5%) exhibit a slightly increase in compressive strength compared to the control. There was an increase of 4.2%, 6.8%, 1.2%, and 0.6% in compressive strength for mixtures W0.3A30V0.5, W0.3A40V0.5, W0.3A50V0.5, and W0.3A60V0.5, respectively. However, the strength decreased with the increasing volume and fiber aspect ratio. In fact, for all mixtures with a fiber content of 1.5%, it was observed that the strength was below the control.
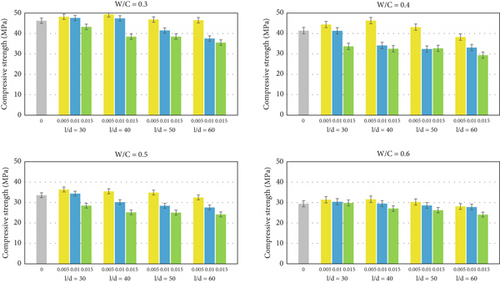
For mixtures with a w/c ratio of 0.4, those containing 0.5% fiber with aspect ratios of 30, 40, and 50 exhibited increases in strength, namely, 7.2%, 11.8%, and 4.1%, respectively, compared to the control at the same w/c ratio. However, for the mixture with a fiber aspect ratio of 60, there was a reduction in strength by approximately 7.7%. Meanwhile, under the same w/c ratio, the mixtures with fiber content of 1% and 1.5% result in a decrease in the compressive strength of concrete, suggesting that the inclusion of fiber in the concrete at that content rate leads to a reduction in compressive strength. The figures also illustrate that while fiber volume and aspect ratio contribute significantly to the mechanical properties of concrete, the w/c ratio remains the primary factor influencing compressive strength. It is evident from the figures that, at the same fiber volume and aspect ratio, the lowest w/c ratio produces the highest strength. Optimizing this ratio is crucial for achieving concrete with the desired strength and durability characteristics for specific engineering applications.
The observed decrease in compressive strength at high fiber volume could potentially be attributed to the formation of fiber clusters and diminished workability, resulting in the entrapment of air within the concrete mixture [37]. A similar trend was observed for mixtures with w/c ratios of 0.5 and 0.6. Strength increased only in mixtures with low percentages (0.5%) and aspect ratios of 30, 40, and 50. This observation indicates that the influence of fiber on compressive strength is only happen at 0.5% of fiber content. At low fiber content, steel fibers have ability to impede crack propagation, traversing developing microcracks at the gravel-mortar interface, thereby enhancing concrete strength without have effect on concrete compaction [38].
3.3. Tensile Strength
Figure 5 presents the 28-day tensile strength results for all mixtures. The experimental data reveal a consistent trend across all w/c ratios: the incorporation of steel fibers significantly enhances tensile strength compared to plain concrete. For each w/c ratio (0.3, 0.4, 0.5, and 0.6), the tensile strength generally increased with fiber content, with the highest values observed at 1.5% fiber volume. Notably, mixtures with an aspect ratio of 50 often exhibited the best performance within each fiber dosage group.
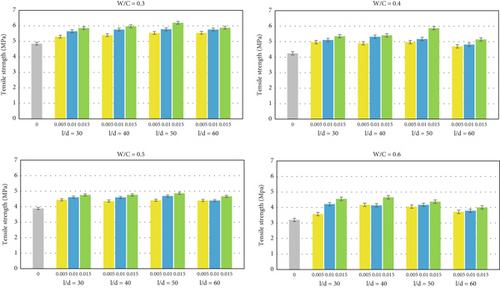
For instance, at w/c = 0.3, mixture W0.3A50V1.5 achieved the highest improvement over the control (27.8%), while at w/c = 0.4, mixture W0.4A50V1.5 showed a 38.12% increase. Similar improvements were observed at w/c = 0.5 and 0.6, with W0.5A50V1.5 and W0.6A40V1.5 showing increases of 25.19% and 45.54%, respectively. These results highlight the synergistic role of fiber volume and aspect ratio in enhancing tensile strength, with optimal gains observed at higher fiber content and specific aspect ratios.
The volume of steel fibers in SFRC directly influences its tensile strength [3]. When the fiber volume increases, the tensile strength of SFRC generally increases. This owed to the ability of the steel fibers to bridge microcracks that form within the concrete matrix, thus enhancing the material’s ductility and resistance to crack propagation [39]. Higher fiber volumes also improve the ductility of the SFRC. Steel fibers provide additional ductility to the concrete by allowing it to undergo more significant deformation by enabling the SFRC to absorb more energy before failure [40, 41].
Similar to fiber content, the fiber aspect ratios can influence the tensile strength of SFRC [20]. A higher steel fiber aspect ratio is generally associated with improved postcracking behavior and enhanced tensile strength of SFRC. The bridging effect of longer fibers can lead to a more effective crack resistance and load transfer in the concrete matrix, thereby contributing to the enhancement of tensile strength. However, it is important to note that the increase in fiber aspect ratio can have practical implications. As depicted in Figure 3, the tensile strength only demonstrates an increase from an aspect ratio of 30–50, with the effect diminishing when the aspect ratio reaches 60. This indicates that mixtures with higher fiber aspect ratios can indeed substantially enhance the tensile strength of concrete. Nevertheless, such enhancements may introduce workability issues and result in decreased compaction of the concrete.
In terms of the w/c ratio’s effects, similar to compressive strength, it remains the primary factor influencing tensile strength, as depicted in Figure 3. For instance, at a fiber volume of 0.5% and a fiber aspect ratio of 30, the highest tensile strength of 5.3 MPa is achieved by the mixture with a w/c ratio of 0.3, followed by mixtures with w/c ratios of 0.4, 0.5, and 0.6, yielding tensile strengths of 4.97, 4.45, and 3.58 MPa, respectively. A higher w/c ratio typically enhances workability but can reduce tensile strength due to increased porosity and a weaker cement matrix [42, 43]. Excessive water can lead to more voids within the concrete, making it more prone to cracking under tensile loads. Therefore, optimizing the w/c ratio is crucial for achieving concrete with the desired tensile strength and durability necessary for various construction applications.
3.4. Performance of Prediction Method
The performance of each prediction model was presented in Table 2. According to the table, the lowest RMSE is produced by MLR at 0.203, followed by SVM at 0.206. The highest RMSE is produced by the fine tree method (0.313). A model with a low RMSE indicates that, on average, the predicted values are close to the actual values, suggesting a good fit to the data. Therefore, the MLR model exhibits better accuracy and performance in capturing the variation in the data compared to the other models.
| No | Model | RMSE | R2 | MSE | MAE |
|---|---|---|---|---|---|
| 1 | Multiple linear regression | 0.203 | 0.910 | 0.041 | 0.156 |
| 2 | Fine tree | 0.313 | 0.780 | 0.098 | 0.245 |
| 3 | Support vector method | 0.206 | 0.910 | 0.042 | 0.158 |
The R2 value for both the MLR and SVM models is 0.910, whereas the fine tree method achieves a lower R2 of only 0.780. The value of R2 commonly describes how well the sample regression line fits the observed data. This is explained that about 91% of the variability in the dependent variable in the MLR and SVM model can be accounted for by the independent variables. This suggests a strong relationship between the predictors and the target variable, indicating that the model provides a good fit to the data.
An MSE of 0.041 produced by the MLR model means that, on average, the squared difference between the predicted values and the actual values of the MLR model in the dataset is 0.041. In comparison, the SVM model produces a slightly higher MSE at 0.042, and the fine tree model at 0.098. Lower MSE values indicate that the model’s predictions are closer to the actual values, suggesting that the MLR model demonstrates better performance in terms of prediction accuracy. The MAE of MLR model is 0.156; it means that, on average, the absolute difference between the predicted values and the actual values in the dataset is 0.156. The MAEs for SVM and fine tree are 0.158 and 0.245, respectively. Lower MAE values indicate that the model’s predictions are closer to the actual values, suggesting better performance in terms of prediction accuracy. Based on that explanation, it can be concluded that the model of MLR shows the better prediction compare to model by SVM and fine tree.
The performance of the MLR model, identified as the best-performing model in this study, was evaluated by comparing its predicted values with the actual observed values, as illustrated in Figure 6. The representation of the actual observed values is symbolized by a dot, while the line represents the predicted values generated by the MLR model. In an ideal scenario where the MLR model accurately predicts the response variable, all the points on the plot would align perfectly along a diagonal line, characterized by a slope of 1. Such alignment would suggest that the predicted values perfectly match the real values. By employing the MLR technique for prediction in this specific dataset, it is apparent that the model is extremely efficient, as reflected by its R2-values (0.91), which approach a value of 1. Considering all factors mentioned, this impressive R2-value further affirms the robustness of the MLR model and its capability to precisely forecast the response variable.
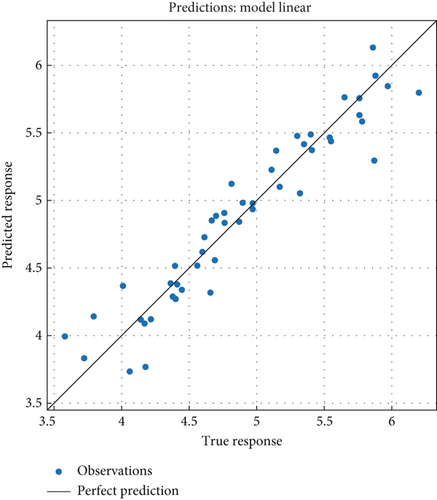
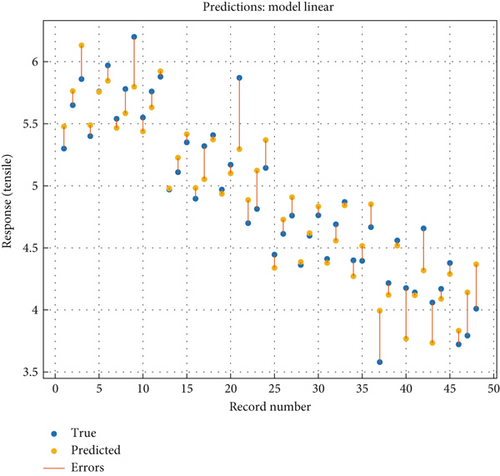
Figure 7 illustrates the true and predicted response plot using the MLR method. Within the provided figure, it is noticeable that 24 data points predicted by the model fall below the observed data points, indicating an underestimation by the model for these instances. Conversely, 22 data points predicted by the model are positioned above the observed data points, suggesting an overestimation by the model in these cases. Additionally, two data points exhibit perfect alignment between the predicted and observed values, indicating accurate predictions by the model for these specific instances. This response plot serves as a visual aid for comprehending the relationship between predictor variables and the predicted response. The error in this plot represents the disparity between the actual observed values and the predicted values generated by the model. Within the context of a response plot for a prediction model, the model’s predictions utilized in this study closely approximate the actual observed values. This suggests that the model effectively captures the relationships between the predictor variables and the response variable, thereby making reliable predictions. In other words, perfect prediction occurs when the error is zero, signifying that the predicted response aligns precisely with the true response.
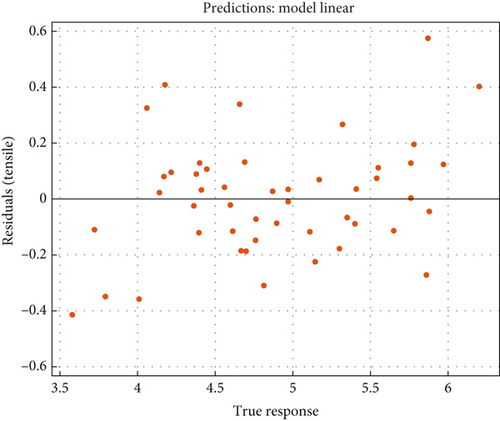
Based on the information provided in Figure 8, it can be observed that there are 22 data points with negative residuals, indicating that these data points are situated below the graph of the predicted equation. Conversely, there are 24 data points with positive residuals, indicating that they lie above the predicted equation graph. Additionally, there are two data points on the graph, indicating that the residual value for these points is zero. Analyzing the distribution of the residual values, it is apparent that the majority of the data points (16 for negative residuals and 18 for positive residuals) fall within the range of 0–0.2 in terms of residual value. A residual is the difference between the observed and fitted values of the study variable. A comprehensive analysis of the residual display pattern plays a crucial role in evaluating the reliability and validity of the model’s representation of the data. The scatter of residual points around the diagonal line indicates the degree of deviation between predicted and observed values. Tight clustering around the diagonal suggests accurate predictions, while scattered points indicate potential areas of model error. Additionally, the examination of the residual display pattern serves as a valuable method to assess the effectiveness of the model. This suggests that the predicted equation used in this study is capable of predicting these data points with relatively small error. This observation is significant as it indicates that the predicted equation performs well for the majority of the data points, with the deviations from the predicted values being relatively minor.
4. Conclusion
This study examined the influence of steel fiber content and geometry on the workability, compressive strength, and tensile strength of SFRC. Results show that increasing fiber volume and aspect ratio reduces workability and may limit compressive strength improvements, which are most evident at lower fiber contents. In contrast, tensile strength increases significantly with higher fiber volumes and aspect ratios, especially in low w/c ratio mixtures. Overall, the findings support the use of moderate fiber volumes (1.0%–1.5%), aspect ratios between 40 and 50, and low w/c ratios to achieve balanced performance and practical mix designs for structural applications.
This study also marks a significant advancement in concrete materials research by presenting a comprehensive comparison of three predictive models: MLR, SVM, and fine tree regression. Among these, the MLR model demonstrated the highest accuracy in predicting the tensile strength of 48 SFRC mixtures. This result highlights the model’s ability to effectively capture the complex relationships between mixture parameters and mechanical performance. As a result, the proven reliability of the MLR model offers valuable practical benefits for engineers, supporting more informed decisions in mix design, material selection, and structural planning.
Conflicts of Interest
The author declares no conflicts of interest.
Funding
No funding was received for this manuscript.
Open Research
Data Availability Statement
The data that support the findings of this study are available on request from the corresponding author. The data are not publicly available due to privacy or ethical restrictions.


