Air Flow, Thermal Profile, and Thermohydraulic Performance Assessment in a Square Duct Heat Exchanger With Combined Vortex Generators: CFD Analysis
Abstract
Numerical simulations of laminar air flow, heat transfer behavior (thermal structure), and thermal performance evaluation in a square duct with combined vortex generators (CVGs) are presented. The CVG configuration consists of a combination of rectangular winglets and V-shaped baffles. The thermal performance of two types of CVGs is compared. Type I includes a set of rectangular winglets placed on the upper and lower walls, with a V-shaped baffle in the middle. Type II features V-shaped baffles placed on the upper and lower walls, with a rectangular winglet in the middle. The purpose of the CVGs is to induce vortex flows, impinging flows, swirling flows, and to disturb the viscous sublayer over the duct surfaces, thereby improving the convective heat transfer coefficient and thermal efficiency. Based on the finite volume method, numerical modeling is used to analyze the effects of the position and height of CVGs on fluid and thermal characteristics for Reynolds numbers ranging from 100 to 2000. Thermal assessments of the CVGs are presented in terms of the Nusselt number ratio, friction factor ratio, and thermal enhancement factor. It is found that Type II outperforms Type I, showing the best Nusselt number ratio of 19.36 when b1/H = b2/H = 0.20 in the positive x-direction. However, Type I exhibits the greatest thermal enhancement factor, 4.39, which is higher than Type II when the blockage ratios are b1 = 0.15H and b2 = 0.05H in the +x FFD.
1. Introduction
In the present day, energy demand is increasing with advancements in technology and innovation. Thermal energy, as one of the most important forms of energy, plays an indispensable role in engineering systems and industries. However, optimizing energy consumption remains one of the most challenging tasks faced by many organizations. Therefore, devices or systems that require lower energy consumption while providing higher efficiency are highly sought after. Heat exchangers (such as fin-tube heat exchangers, shell-and-tube heat exchangers, and plate-fin heat exchangers) are among the most essential energy-consuming devices in many industries, making the improvement of heat exchanger performance key to achieving optimal energy consumption. The two main approaches to this are active and passive methods. The active method relies on power-consuming techniques, such as vibration, to increase the convective heat transfer coefficient within heat exchanger systems. In contrast, the passive method involves adding or placing miniature obstacles into the heating or cooling sections to enhance the local convective heat transfer coefficient (hx) without the need for external power. These small obstacles, commonly known as “vortex generators,” create vortex streams or swirling flows, which disturb the thermal boundary layer and improve fluid mixing. These mechanisms contribute to increased heat transfer potential and enhanced heat exchanger efficiency.
With the aim of optimizing energy usage, reducing operational energy consumption is encouraged. In comparison to the active method, the passive method requires much less energy to achieve higher thermal performance. This work focuses on achieving higher heat exchanger performance through the passive method using vortex generators. Additionally, ease of installation and maintenance is a key objective.
Rib/baffle, winglet, and twisted tape, among others, are popular types of vortex generators widely employed in industry. This study focuses on rib/baffle and winglet, which serve as the prototype vortex generators developed further in the present research. Vortex generators have been continuously developed. For example, Boonloi and Jedsadaratanachai [1] reported on the aerodynamic and thermal behavior through a heating channel with a novel vortex generator (X-V modified ribs). They found that increasing rib blockage strongly affected the enhanced vortex strength. The best thermal performance in their study was 3.48. Zheng et al. [2] improved the thermal performance of a rectangular channel by using hierarchical rib schemes. They reported that the hierarchical scheme increased the overall performance factor by more than 10%, with a maximum improvement of 21.15% for the V-shaped rib. Shanmugam and Park [3] studied flow configurations and thermohydraulic characteristics of supercritical hydrogen through a regenerative cooling section with arc-shaped rib vortex generators. They observed that the enhanced performance of the channel with arc ribs was 1.950 and 1.384 times higher than that of V-ribs (23%) and cylindrical ribs (32.5%), respectively. Zhang et al. [4] investigated turbulent fluid flow and thermal characteristics in a rotating channel heat exchanger with V rib-dimple combined structures through numerical and experimental methods. Their results showed that the strong longitudinal vortex pairs inside the dimples of the V rib-dimple structure partially offset the effects of rotation. Iqbal et al. [5] numerically investigated the thermal performance of a novel solar air heater design with V-pattern ribs combined with jet cooling. Their findings revealed that the enhanced heat transfer and increased friction factor were 3.36 and 5.31, respectively, compared to a conventional solar air heater under similar boundary conditions. The highest thermohydraulic performance achieved was 1.92. Additionally, Boonloi and Jedsadaratanachai [6] proposed staggered V-ribs, achieving the best thermal performance of up to 4.5. Xie et al. [7] studied streamwise development within a turbulent flow regime and thermal structure over tested channel surfaces with V-profile ribs and V-rib-dimple combined vortex generators (CVGs). They found that the introduced dimple turbulators extended the range of increased thermal ability by more than 45%, resulting in a 23.2% improvement in thermohydraulic performance for the V-rib-dimple conditions in the fully developed regime. Elmouazen et al. [8] used pentagonal V-profile rib turbulators to augment thermal performance in cooling channels of hydrogen rocket engines. Their numerical results showed that the Nusselt number and ribbed channel performance increased by up to 66.6% and 52%, respectively. The case with 5° pentagonal V-profile rib turbulators had greater thermohydraulic performance, although with a slightly higher pressure loss penalty. Kumar and Layek [9] presented convective heat transfer and friction loss configurations through the heating section of a solar air heater with a new design of twisted V-profile staggered ribs. They showed that the staggered twisted V-profile ribs enhanced thermal performance with minimal friction loss penalty. Over their investigated range, the maximum Nusselt number and friction factor ratios were 3.43 and 2.57, respectively, compared to the reference condition. Elmouazen et al. [10] studied enhanced heat transfer using V-profile rib turbulators within the hydrogen rocket engine chamber wall. Their simulation results revealed that V-profile rib turbulators enhanced heat transfer and improved thermal efficiency by 23% compared to the reference case (smooth cooling channel). They also concluded that the overall heat transfer coefficient for the tested section with 30° V-profile rib turbulators was superior to that of the 60° and 45° V-profile rib turbulators. Elmouazen et al. [11] studied augmented heat transfer and fluid flow structure in hydrogen regenerative-cooling channels with novel X-shape ribs. They concluded that the thermal ability reached its highest value with 30° X-shape ribs but decreased gradually as the flow attack angle increased.
Another type of vortex generator is the winglet. Kumar and Dalal [12] performed a thermodynamic-numerical investigation in a fin-and-tube heat exchanger using shear-thinning fluid combined with rectangular winglet turbulators. Zhao et al. [13] employed both straight and curved rectangular winglet vortex generators to improve performance in a plate-fin tube heat exchanger. Their results revealed that the curved rectangular winglet vortex generator with a higher arc angle provided greater overall performance. Heriyani et al. [14] used perforated concave rectangular winglet pairs, allowing air to transfer a greater amount of heat through heated tubes inside a channel. The best thermal performance observed was around 1.29. Naik et al. [15] examined the flow topology and thermal structure in a channel with curved rectangular winglets. They observed that the induced secondary flow was beneficial in increasing thermohydraulic performance. Modi and Rathod [16] experimentally studied augmented heat transfer and friction loss in fin-and-circular tube heat exchangers with modified rectangular winglets. Their experimental results showed that the heat exchanger efficiency factor for rectangular winglets with a round hole was about 1.04%–10.52% higher than that of rectangular winglets without a hole. Saini et al. [17] enhanced heat exchanger performance by using curved trapezoidal winglets with circular punched holes. Over a Reynolds number range of 400–2000, the Nusselt number for the curved trapezoidal winglets with six punched holes was augmented by 75.25%, with the respective pressure loss increasing by 107.88%. Maithani et al. [18] numerically performed an exergy assessment and sustainability investigation within the heating section of a solar heat collector with wavy delta winglet vortex generators. They found that the winglets disrupted the viscous layer, thus increasing the heat transfer potential from the heat-absorbing side to the fluid medium within the tested rectangular channel. Wang et al. [19] studied the thermohydraulic performance in a tube with different punched winglets. The optimum thermal performance achieved was 1.14. Wu et al. [20] used multi-V-winglets, which yielded an averaged Nusselt number increase of 130.57%–156.42% compared to the smooth section, with the maximum heat exchanger performance reaching 2.83.
As clearly demonstrated above, V-shaped baffles/ribs and rectangular winglets are among the most widely used vortex generators for enhancing convective heat transfer in heat exchangers due to their high effectiveness. This study proposes a novel vortex generator that combines the advantages of both the V-shaped baffle and the rectangular winglet, hereinafter referred to as CVGs. The fluid dynamics, heat transfer characteristics, and thermal performance of two types of novel CVGs are numerically analyzed and assessed. CVGs are expected to increase vortex strength and enhance mixing quality, thereby improving convective heat transfer and heat exchanger performance. Additionally, the effects of CVG heights, CVG arrangements, and air flow directions on pressure loss, heat transfer potential, and flow direction are studied.
2. Square Duct Heat Exchanger With CVGs
A square duct inserted with CVGs is shown in Figure 1. Two types of CVGs are presented, which can be differentiated by the placement locations of the vortex generators (i.e., rectangular winglets and V-baffles) within the square duct. Type I consists of two rectangular winglets placed on the upper and lower walls, with a V-shaped baffle in the middle. On the other hand, Type II consists of two V-shaped baffles located on the upper and lower duct walls, with a rectangular winglet in the middle. These CVGs are efficient at inducing vortex streams, impinging flows, and swirling streams, thus disturbing the viscous sublayer over the duct surfaces and improving the heat transfer coefficient.
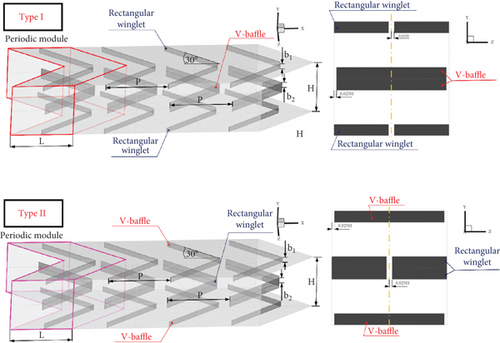
The height of the square tested duct (equal to the duct width), H, is 0.05 m. The hydraulic diameter of the heated duct, Dh, is also H. The periodic module length of the heated duct, L, is set to H. The flow attack angle for all vortex generators is 30° [21]. The parameter b1 represents the height of the vortex generators placed on the upper and lower walls, while b2 represents the height of the vortex generators located in the middle of the heated duct (H/2). The blockage ratios, or vortex generator height to channel height (i.e., b1/H and b2/H), vary from 0.05 to 0.20. P denotes the pitch distance, and the pitch spacing ratio, or the pitch distance to duct height ratio (P/H), is equal to 1 for all study conditions. For the laminar flow regime, Reynolds numbers ranging from 100 to 2000 are considered [22–25]. The fluid flow direction (FFD) of the tested square channel is varied between +x FFD and −x FFD.
3. Air Flow and Heat Transfer Equations
From Ref. [26], air flow and temperature variation through the tested duct are assumed to be steady and fully developed in three dimensions (3Ds). Due to its low velocity, this laminar air flow is incompressible. The viscous dissipation and body force terms are considered negligible. Given that the thickness of the CVGs is small, forced convection is considered the primary mode of heat transfer within the heating duct. The governing equations are listed as follows.
4. Boundary Conditions and Equation Solvers
The inlet laminar air flow has an initial fluid temperature of 300 K, with a Prandtl number, Pr = 0.707, for all investigated cases. Since the change in fluid temperature during the heating process is within ±10 K, the thermal properties of air are assumed to remain constant. The boundary conditions for the governing equations are provided in Table 1.
| Zone | Boundary conditions | |
|---|---|---|
| Momentum equation | Energy equation | |
| Inlet | Periodic boundary | Periodic boundary |
| Outlet | Periodic boundary | Periodic boundary |
| Duct wall | No-slip condition | Constant temperature of 310 K |
| CVG | No-slip condition | Insulator |
In this study, the simulation of air flow and thermal characteristics through the heating duct with CVGs is performed using a commercial finite volume method code. The momentum and continuity equations are discretized using the power law numerical scheme, while the energy equation is discretized using the QUICK numerical scheme. The convergence criteria are that the normalized residuals for all variables must be lower than 10−5, except for the energy equation, where the residual must be lower than 10−9.
5. Computational Validation
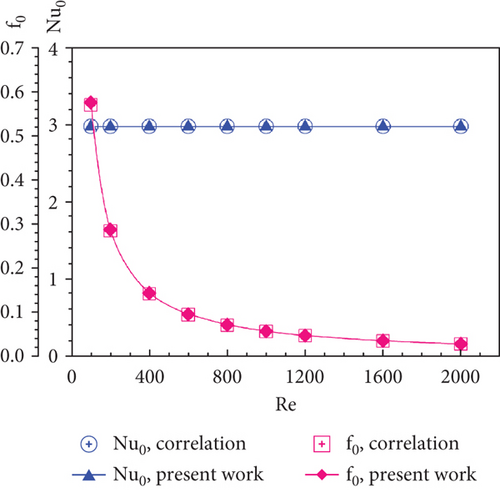
The validation of the numerical modeling includes smooth/plain duct validation and a grid/mesh independence check (optimum grid/mesh check). The validated results ensure the accuracy of the numerical method.
5.1. Smooth Duct Validation
5.2. Grid Independence
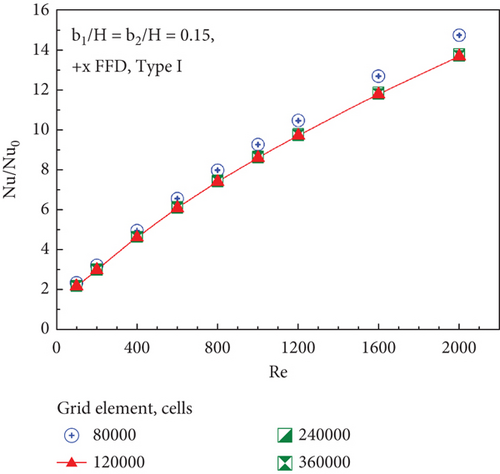
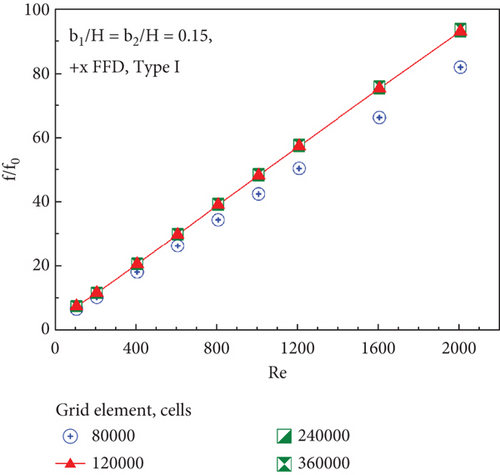
The grid independence check is performed by correlating the average Nusselt number and friction factor obtained from four grid elements: 80,000, 120,000, 240,000, and 360,000 elements (b1/H = b2/H = 0.15, +x FFD, Type I). It is found that increasing the number of grid elements beyond 120,000 has no significant impact on the average Nusselt number and friction factor ratios (see Figure 3). Furthermore, these ratios follow identical trends across all grid elements and increase as the Reynolds number increases. Considering both computational time (investigated period) and computer resources, 120,000 elements are chosen for all investigated cases.
6. Numerical Results
The present numerical results are organized into two subtopics: (1) air flow and thermal patterns and (2) performance assessment. In the first subtopic, streamlines in transverse planes, longitudinal vortex flow, local Nusselt number contours, and temperature contours are presented and discussed. The thermal performance assessments, evaluated by the Nusselt number ratio (Nu/Nu0), friction factor ratio (f/f0), and TEF, are presented in the second subtopic.
6.1. Air Flow and Thermal Patterns
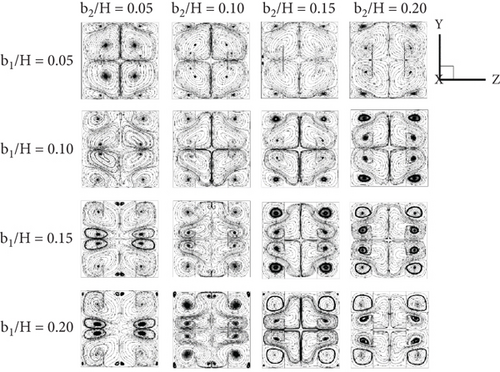
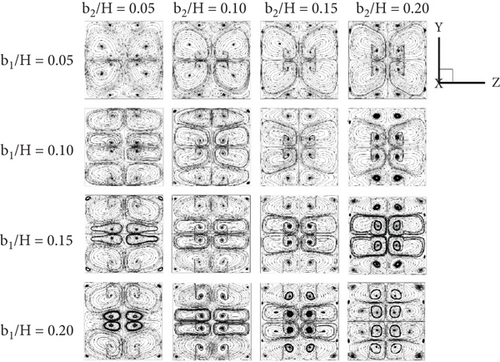
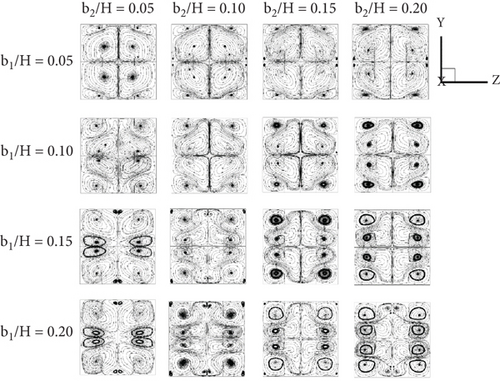
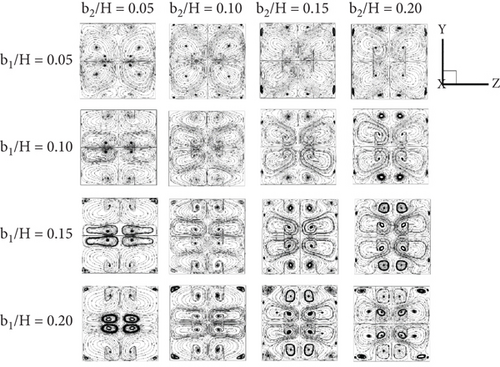
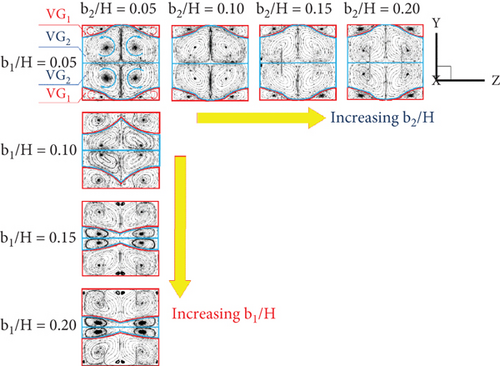
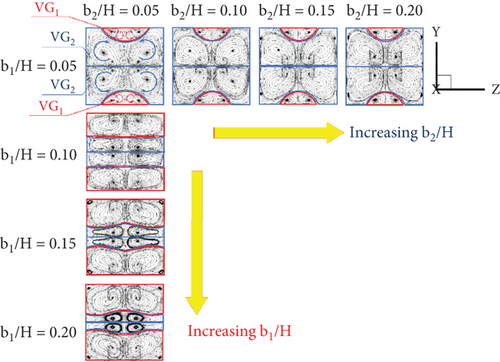
Figures 4a, 4b, 4c, and 4d show the streamlines in cross-sectional planes (y-z planes) of the tested duct fitted with CVGs for (a) Type I with the +x FFD, (b) Type I with the −x FFD, (c) Type II with the +x FFD, and (d) Type II with the −x FFD. In this simulation, the effects of both the b1/H and b2/H ratios (ranging from 0.05 to 0.2) on air flow are studied at Re = 800. The results reveal that the CVGs generally create four to eight vortex cores/centers in each plane across all cases. Since the installation of CVGs in heat exchanger systems acts as an obstruction to the flow within the tube, it results in a pressure drop between the upstream and downstream regions of the CVG. This pressure difference induces the formation of vortices as the air flows past the CVG. The number of vortex cores depends on the CVG height (b1/H and b2/H), the x/H position, and the FFD. The higher the number of vortex cores, the more effective the fluid mixing, leading to a more uniform air temperature distribution across the planes. Another important factor is vortex strength, as an increase in vortex strength directly enhances the heat transfer coefficient.
Two groups of vortex flows are observed: the vortex flows generated by the upper–lower vortex generators are referred to as “VG1,” while those produced by the middle vortex generators are called “VG2” (see Figure 5). As shown in Figure 5a,b, the b1/H ratio exhibits an inverse relationship with the VG2 regions. As b1/H increases, the VG1 regions extend across most of the duct, while the VG2 region becomes significantly smaller. However, when the b1/H ratio is fixed at 0.05, an increase in b2/H does not significantly affect either the VG1 or VG2 regions, although a slight variation in the VG2 patterns is observed. This indicates that the b1/H ratio has a greater influence on vortex flow variation than b2/H. These trends are consistent for both Type I and Type II CVGs with both +x and −x FFD.
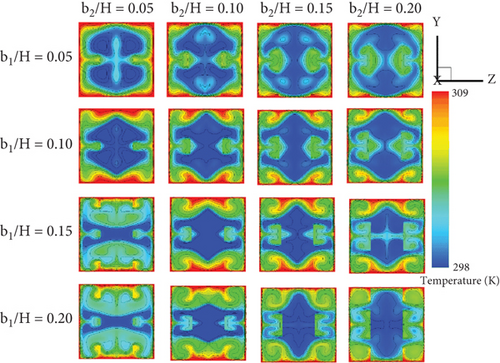
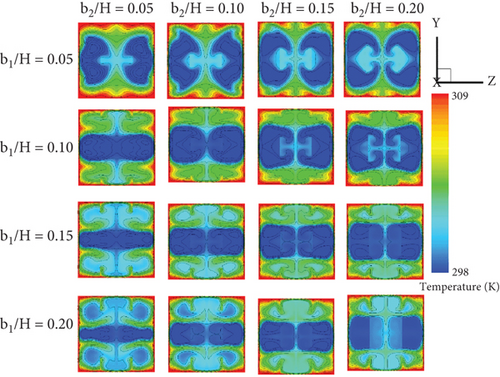
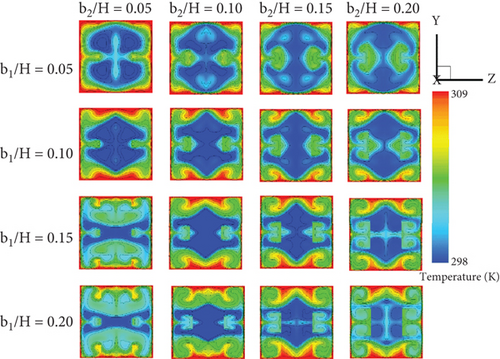
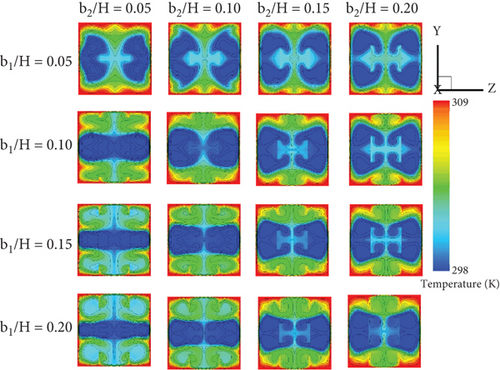
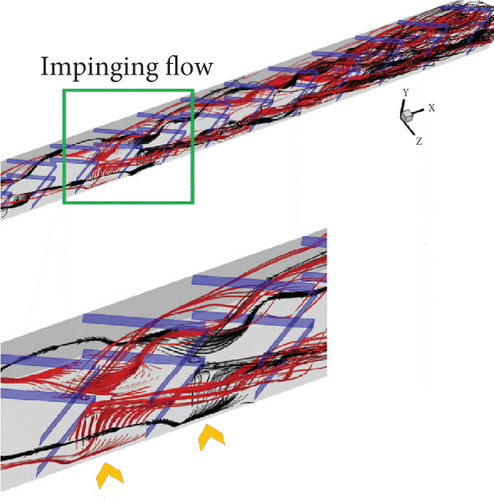
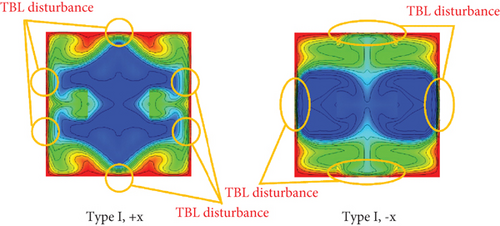
Figures 6a, 6b, 6c, and 6d show the temperature contours/distributions of air in the cross-sectional planes of the tested duct with CVGs, corresponding to the streamlines presented in Figures 4a, 4b, 4c, and 4d, respectively. As previously mentioned, the induced vortex flows disturb the thermal boundary layer on the heat transfer surfaces (duct walls) of the square duct, resulting in improved fluid mixing in all studied conditions. Additionally, some parts of the vortex flows impinge on the duct walls, creating “impinging flow” (see Figure 7), which directly disrupts the thermal boundary layer. This disturbance is a significant factor in the increase of the convective heat transfer coefficient. Other parts of the vortex flow in the middle of the duct contribute to improving the fluid mixing quality. The generation of these two types of vortex flows plays a crucial role in enhancing heat transfer and overall thermal performance of the duct with CVGs. The heat transfer patterns for Type I with the +x FFD are similar to those for Type II with the +x FFD, and the temperature distributions for both types with the −x FFD also follow similar patterns. The disturbance of the thermal boundary layer in both flow directions for the square duct fitted with CVGs is clearly demonstrated in Figure 8.

Figures 9a, 9b, 9c, and 9d show the local Nusselt number distributions on the duct walls of the tested duct equipped with CVGs, corresponding to the temperature contours presented in Figures 6a, 6b, 6c, and 6d, respectively. In general, the installation of CVGs results in a higher Nusselt number compared to the smooth duct across all studied conditions. Blue contours represent lower Nusselt numbers, while red contours correspond to higher Nusselt numbers. The red contours indicate favorable regions where impinging flows generated by the CVGs directly disturb the boundary layer, enhancing the convective heat transfer coefficient in these regions. Furthermore, the red contours expand as both the b1/H and b2/H ratios increase due to the stronger vortices induced. Changing the flow direction from +x to −x FFD has a minimal impact on the Nusselt number distributions.
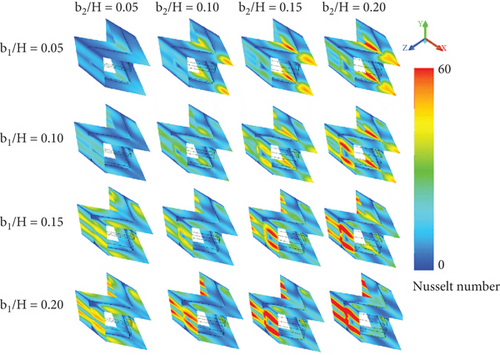
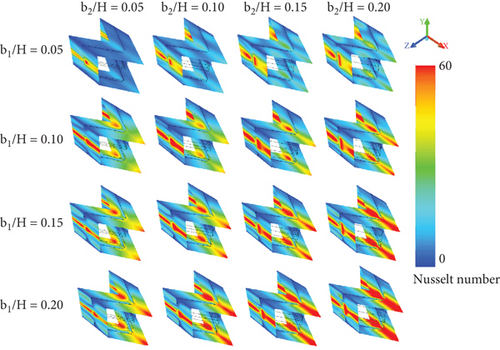
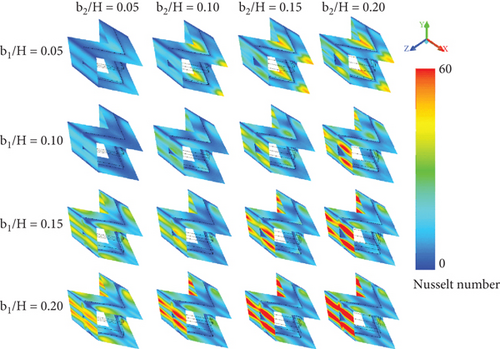
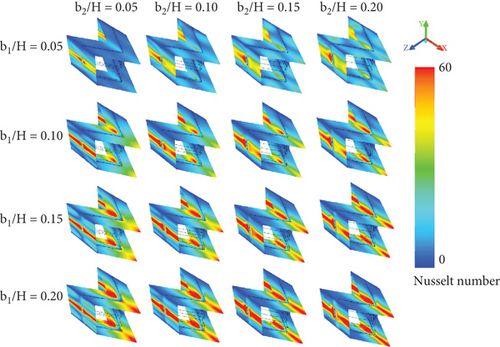
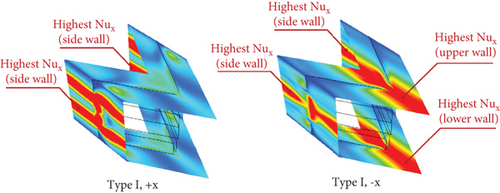
Moreover, the flow direction significantly affects the location of the highest Nusselt number. Figure 10 shows that when the flow moves in the +x FFD, the maximum local Nusselt number occurs on the left and right side walls of the duct. In contrast, when the flow moves in the −x FFD, the peak is observed on all sides of the square duct, particularly at the upper and lower walls.
6.2. Performance Assessment
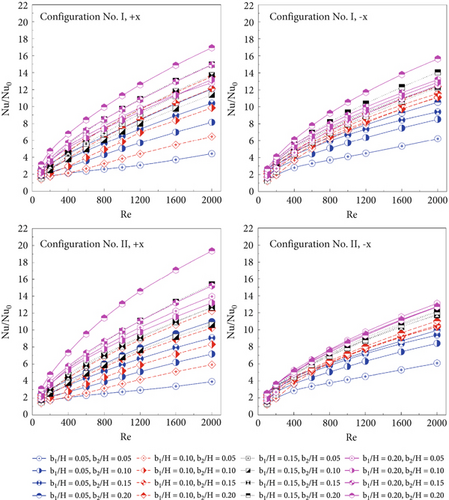
Figures 11a, 11b, and 11c compare the thermal performance of the square duct fitted with two types of CVGs in terms of (a) Nu/Nu0 versus Re, (b) f/f0 versus Re, and (c) TEF versus Re for both air flow directions. It is evident that the duct with CVGs exhibits higher Nusselt numbers than the smooth duct (i.e., Nu/Nu0 > 1), indicating that the vortex flows generated enhance the heat transfer potential in the square duct heat exchanger. As mentioned earlier, when the CVG height increases, the vortices become stronger. The simulation results show that as the Reynolds number increases, Nu/Nu0 also increases with the CVG height for all studied cases. Compared to b2/H, b1/H has a more significant effect on the increased Nusselt number for all CVG types and flow directions. These results support the earlier conclusion that b1/H has a greater influence on the variation of the vortex flows (see Figure 4). Figure 11a shows that with Type I CVGs, Nu/Nu0 ranges from 1.50 to 16.92 and from 1.32 to 15.64 for the +x and −x FFD, respectively. For Type II CVGs, the Nusselt number ranges from 1.47 to 19.36 and from 1.31 to 13.10 times better than the plain duct for the +x and −x FFD, respectively.
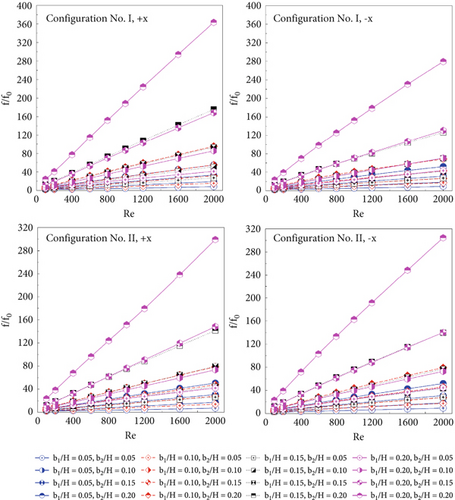
On the other hand, the installed CVGs not only yield higher Nusselt numbers but also result in higher friction losses in the square duct. As shown in Figure 11b, the friction factor with CVGs is higher than that of the smooth duct under all examined conditions (i.e., f/f0 > 1). This is expected, as the increased b1/H and b2/H ratios, due to their higher blockage values, lead to an increase in f/f0. For the condition where b1/H = b2/H = 0.20 in Type I, the +x FFD results in higher friction loss compared to the −x FFD. In contrast, for Type II, the +x FFD condition results in lower friction loss than the −x FFD. The f/f0 values range from 2.09 to 363.19 for Type I (+x FFD), 2.11 to 279.39 for Type I (−x FFD), 2.04 to 299.31 for Type II (+x FFD), and 2.09 to 304.61 for Type II (−x FFD).
Moreover, the simulation results show that when the flow moves in the +x FFD, it tends to produce higher heat transfer rates than the −x FFD by 34.40%. This finding is supported by the following data: In the case of the Type II CVG with b1/H = b2/H = 0.20 at Re = 2000, the Nu/Nu0 is 19.36 when the flow moves in the +x FFD, but it decreases to 12.70 when the flow changes to the −x FFD. Similarly, for the Type I CVG with b1/H = b2/H = 0.20 at Re = 2000, the variation in heat transfer rates between the two flow directions is about 7.57%, with the +x FFD yielding higher heat transfer rates than the −x FFD. However, the difference in friction loss between the two flow directions is quite significant, with the +x FFD causing approximately 23.07% greater friction loss than the −x FFD.
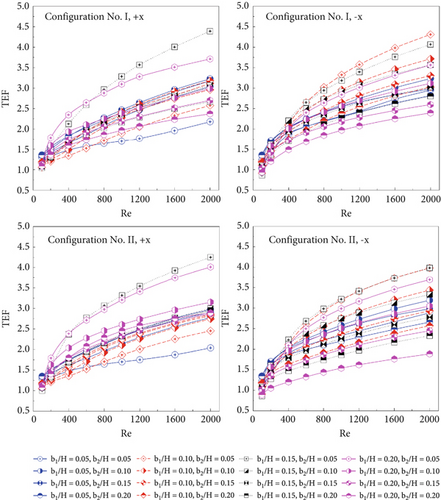
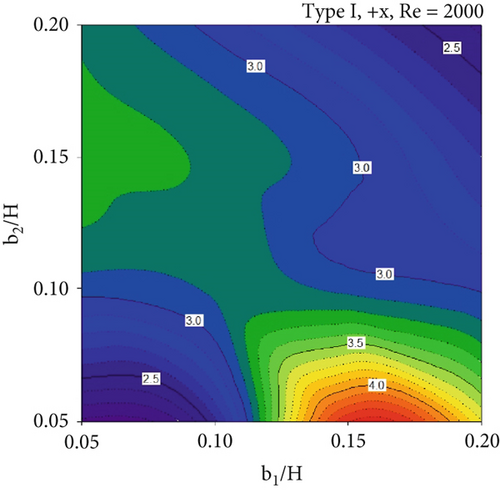
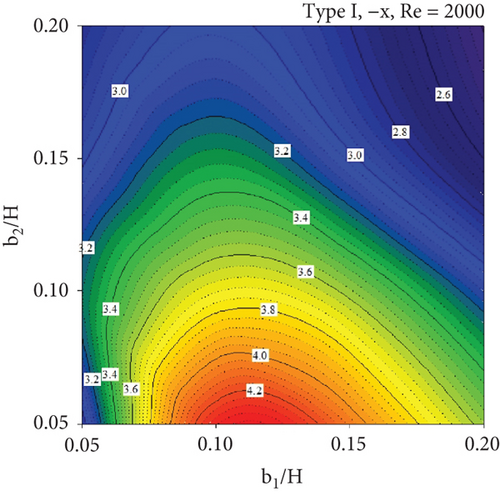
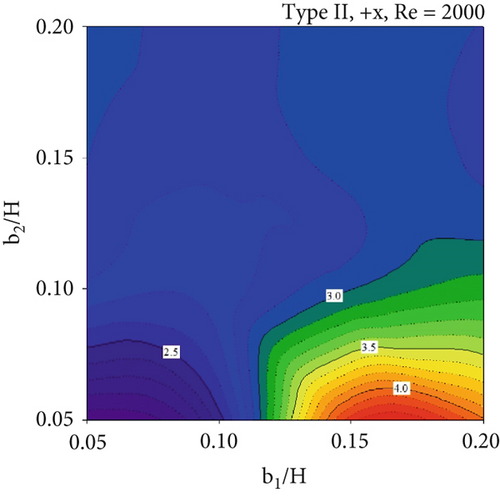
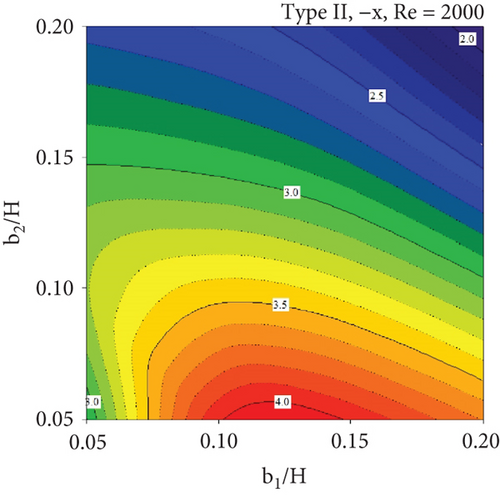
In almost all cases, the TEF is greater than unity (TEF > 1) at equal pumping power, demonstrating the advantages of the installed CVGs in the square duct heat exchanger. The maximum TEF is observed at b1/H = 0.15 and b2/H = 0.05, except for the Type I CVG with the −x FFD, where the highest TEF is found at b1/H = 0.10 and b2/H = 0.05. The optimum TEF values are 4.39, 4.31, 4.25, and 3.99 for Type I (+x FFD), Type I (−x FFD), Type II (+x FFD), and Type II (−x FFD), respectively. Furthermore, Figure 12 displays the TEF contours as the air flow direction reverses (Re = 2000). Regardless of the CVG type, higher TEF values are observed in most of the cross-sectional duct area when the flow moves in the −x FFD compared to the +x FFD. On the other hand, for the same flow direction, the TEF contours show similar trends.
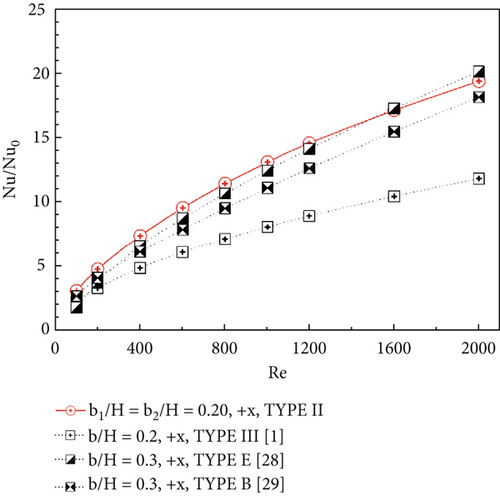
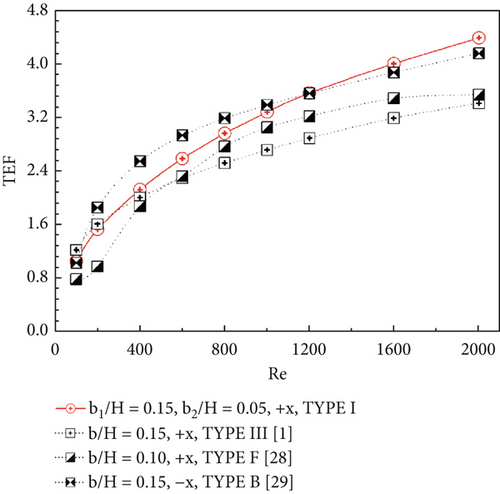
The maximum Nu/Nu0 and TEF values from the present investigation, along with those from previous works, are presented in Figure 13a,b, respectively. It is observed that the present work (with b1/H = b2/H = 0.20) yields the highest Nu/Nu0, which is comparable to the results from Refs. [1, 28, 29]. At Re = 1200, the present work (with b1/H = 0.15 and b2/H = 0.05) achieves the greatest TEF compared to previous studies [1, 28, 29].
7. Conclusions
- •
Multiple vortex flows can be simultaneously induced by the CVGs within the square duct. By selecting appropriate b1/H and b2/H ratios, strong vortices are generated, effectively enhancing fluid mixing and increasing the disturbance of the thermal boundary layer.
- •
Significant increases in the convective heat transfer coefficient are observed. The maximum Nu/Nu0 of 19.36 occurs with Type II CVGs at the +x FFD. The highest TEF of 4.39 is achieved with Type I CVGs (b1/H = 0.15 and b2/H = 0.05) at the +x FFD.
- •
A plan has been made for future research to study vortex generators developed for this research in turbulent flow conditions with Reynolds numbers ranging from 3000 to 16,000. This will cover the operating range of various heat exchanger systems and also involve the development of applications for different types of heat exchangers.
- •
Considering the advantages of CVGs for practical heat exchanger systems in industry, it was found that the fabrication difficulty of CVGs using conventional materials is comparable to that of other types of vortex generators, such as V-ribs or baffles. However, CVGs demonstrate superior durability during installation and operation compared to V-ribs installed on tube surfaces, as they are less likely to shift or detach from the test section during experimental testing. Nevertheless, attention must still be given to the durability of CVGs during installation and operation, especially when they are used with working fluids that have significantly different properties from air.
Nomenclature
Symbols
-
- b
-
- CVG width, m
-
- Dh
-
- hydraulic diameter, m ( = H for square duct)
-
- f
-
- friction factor, friction loss
-
- h
-
- convective heat transfer coefficient, W m−2 K−1
-
- H
-
- duct height, m
-
- k
-
- thermal conductivity, W m−1 K−1
-
- L
-
- numerical model length/periodic length
-
- Nu
-
- Nusselt number
-
- p
-
- static pressure, Pa
-
- P
-
- pitch spacing, m
-
- Re
-
- Reynolds number
-
- T
-
- fluid temperature, K
-
-
- fluid mean velocity in square duct, m s−1
-
- ρ
-
- density, kg m−3
Subscripts
-
- Zero
-
- plain duct
-
- pp
-
- pumping force
Abbreviations
-
- CVGs
-
- combined vortex generators
-
- FFD
-
- fluid flow direction
-
- TBL
-
- thermal boundary layer
-
- TEF
-
- thermal enhancement factor ()
Conflicts of Interest
The authors declare no conflicts of interest.
Author Contributions
Amnart Boonloi: writing – review and editing, writing – original draft, visualization, validation, supervision, software, resources, project administration, methodology, investigation, funding acquisition, formal analysis, data curation, conceptualization. Withada Jedsadaratanachai: writing – review and editing, writing – original draft, visualization, validation, supervision, software, resources, project administration, methodology, investigation, funding acquisition, formal analysis, data curation, conceptualization.
Funding
The authors received no financial support for the research, authorship, and/or publication of this article.
Acknowledgments
The authors would like to thank Prof. Dr. Pongjet Promvonge for the suggestions.
Open Research
Data Availability Statement
Data is available on request due to privacy/ethical restrictions.


