Design, Simulation, and Economic Analysis of a Solar Photovoltaic-Powered Pumping System for Drip Irrigation of a 1-ha Bean Farm in a Tropical Climate
Abstract
A successful agricultural system, be it large-scale or small-scale, requires adequate irrigation of plants, regardless of seasonal changes in rainfall. Unreliable electricity supply in tropical regions has necessitated the use of alternate power sources for efficient irrigation. Consequently, this study focuses on evaluating the performance, energy efficiency, and economic feasibility of a solar-powered photovoltaic (PV) pumping system for drip irrigation in Kaleo, Upper West Region of Ghana. Through theory and PVsyst simulations, it was determined that the optimal tilt angle for the collectors is 16°, facing south. The solar pumping system comprised a 2.43 kWp solar array, one 1.3 kW brushless DC motor, and a 1.8 kW maximum power point tracker DC converter. The pump operating energy was recorded at 3025 kWh, which fulfilled approximately 92.6% of the water demand for the 1-ha bean farm, making the system 82% efficient. The performance ratio (PR) provided a view of the PV system’s efficiency and energy conversion performance over different months. The average PR of 67.8% suggests approximately 32% losses in the proposed system. The performance of the PV array was experimentally confirmed using weeklong data collected from a 1.1 kW solar water pumping system that supplies water to a poultry farm. The experimental findings closely matched the output data from the PVsyst simulation. It was discovered that there was an 8% discrepancy between the experimental and simulated results. Financial analysis revealed a positive net present value of $13,097.77, a short payback period of 1.3 years, and favorable profitability, demonstrating the economic viability of the solar project. The positive financial results underscore the economic feasibility of introducing solar-powered irrigation systems and represent a promising avenue for sustainable agricultural practices in the region. While the solar PV system is a major component, the highest costs stem from the drip emitters, storage tanks, and, notably, well drilling. These factors make the system expensive for the majority of smallholder farmers in Kaleo, highlighting the need for policymakers to consider financial support, subsidies, or alternative low-cost solutions, such as local production of system components, to improve affordability and accessibility.
1. Introduction
To ensure the prosperity of rural regions, especially those in less developed nations, it is crucial to provide them with cost-effective and dependable energy sources [1]. In Ghana, approximately 33% of the population does not have access to electricity, with rural communities bearing the brunt of this disparity [2]. This lack of energy access significantly impacts the agricultural sector, which plays a vital role in job creation and economic growth within these rural areas. Traditional irrigation methods reliant on fossil fuels not only incur high operational costs but also contribute to climate change through increased greenhouse gas emissions [3]. Consequently, there is a pressing need for rural communities to explore and adopt more sustainable energy solutions, such as solar photovoltaic (PV) technology. The United Nations’ (UN) Sustainable Development Goals (SDGs) aim to tackle worldwide issues, including poverty alleviation and securing food supplies, while advocating for sustainable development that supports environmentally friendly farming practices [1]. Specifically, SDG 2 is dedicated to achieving food security, combating hunger, improving nutrition, and promoting sustainable farming techniques. To realize this objective, it is imperative to boost agricultural output, especially in rural regions where poverty and food insecurity are most acute [1].
There has been a significant rise in the adoption of solar PV systems for water pumping in rural parts of developing nations, thanks to their reliability and sustainability as energy sources [4]. Nonetheless, the effective design and dimensioning of a PV-driven pumping system tailored to a particular use case requires careful consideration of several elements, including water requirements, solar energy availability, and the various components involved. Additionally, performing a life cycle cost (LCC) analysis can offer valuable information about the system’s long-term financial sustainability and aid in pinpointing possible avenues for improvement. As per Otekunrin [5], it was projected that around 2.2 million individuals in Ghana are suffering from malnutrition, with child stunting rates at 19.2%. To tackle this issue and align with SDG 2, exploring the capability of solar PV systems to consistently supply irrigation with renewable and sustainable energy all year round is crucial. This would empower farmers to grow crops throughout both wet and dry periods, thereby contributing to food security and nutritional improvements.
Drip irrigation, alternatively referred to as microirrigation or trickle irrigation, represents a pioneering advancement in water conservation technologies that emerged several decades ago [6]. This technique stands out for its efficiency in water usage, potentially boosting crop productivity, minimizing water wastage, and enhancing overall crop quality. By delivering water precisely to the plant’s root area [7], it minimizes losses due to evaporation and overflow. Its applicability extends beyond agricultural staple crops to include horticulture, greenhouse cultivation, landscaping, and a range of manufacturing processes [8]. In recent times, the popularity of drip irrigation has surged dramatically [6], largely due to its potential to address critical water management challenges. As highlighted by Li et al. [9], employing drip irrigation effectively can lead to substantial advantages, including enhanced income from increased crop outputs, decreased water expenses, and lower energy costs. Given the current urgency to utilize water resources judiciously [10] and to practice smart irrigation techniques [11], many growers find that adopting drip systems elevates their earnings by boosting crop quantity and quality. These systems also contribute to savings in water, energy, manpower, chemical inputs, and curtailment of water overflow costs.
A solar photovoltaic water pumping system (SPVWPS) typically comprises several key elements. These include a solar PV panel assembly that captures sunlight, a charge regulator that oversees the battery charging process, a pump controller that governs the pump’s operations, batteries for storing surplus energy, an inverter that converts direct current to alternating current, a water pump designed for moving water, and a supporting framework, which may be stationary or employ a tracking mechanism depending on the setup. Utilizing PVs for irrigation purposes offers a cost-effective solution compared to conventional energy sources required for water pumping. As the prices of fossil fuels escalate and the cost of solar cell peak watts decreases due to economies of scale in production, PVs are poised to become increasingly economically viable [12]. SPVWPSs have gained traction for irrigation and other farming applications in areas with restricted access to standard electricity. Extensive research has been undertaken to assess the performance, optimize designs, determine appropriate sizes, enhance efficiencies, and analyze the economic and environmental implications of SPVWPSs. Santra [13] evaluated the performance of small solar PV pumps for irrigation purposes. The study found that an AC or DC type 1 hp solar pump can successfully operate mini sprinklers, microsprinklers, and drippers with good uniformity when it comes to irrigating shallow water resources with pressure irrigation systems. The optimal design of a PV drip irrigation system was analyzed by Miran et al. [14]. The Photovoltaic Geographical Information System (PVGIS) and the Solar-Drip Simulation Tool (SoSiT) simulation tools were used to analyze how much electricity could be generated from this type of system based on factors such as tilt angle and orientation. The study concluded that a PV-powered drip irrigation system was more cost-efficient than using subsidized electricity or diesel. It was also found that the designed PV system could fulfill crop requirements by only utilizing 28% of the potential water supply, suggesting there may be opportunities to grow additional crops.
Diarra et al. [15] designed a drip irrigation system powered by PV energy for vegetable crops in Bellel, Guinea. Meteorological parameters such as temperature, solar irradiation, precipitation, and relative humidity were determined at the site. A total water requirement of 150 m3 was calculated per day for irrigating 7 ha. Geometric dimensions like 67 booms per sector and 63 drippers/boom were also established along with details about the pumping system. The PV array consisted of five modules in series and three in parallel. It was concluded from the study that the results obtained could be used as a basis for designing and implementing a drip irrigation system powered by PV energy. Gevorkov and Kirpichnikova [16] in their work explored a model designed to simulate the operation and control of a centrifugal pump system powered by PV energy. The model was designed to allow examination of the properties of a given PV water pumping system. The model served to enable the estimation of the system parameters of the proposed pumping system across a broad range of consumption demands. Krishnakant and Kulkarni [17] designed and simulated the SPVWPS using PVsyst Version 6.87 software. For the case study and simulation, the village of Bhagipur, located near the Etah district in Uttar Pradesh, India, was chosen as the location. The study examined the impact of various performance parameters, including global irradiation (GHI), diffuse irradiation, and temperature, on the system. Additionally, the study presented an analysis of system losses over the course of a year.
So far, there are few comprehensive analyses that have been carried out on the technoeconomic analysis of SPVWPSs in tropical climates for smallholder farmers in rural areas. This research therefore centers on designing, modeling, and assessing the economics of a solar PV energy-driven water pump system for a 1-ha bean farm located in Kaleo, in the Upper West Region of Ghana. The objective is to assess both the practicality and cost-effectiveness of using solar power for irrigation purposes, as well as to pinpoint any obstacles that might hinder its adoption. This study stands out by incorporating an experimental verification of PVsyst’s solar PV calculations, a crucial step that most previous studies have largely overlooked. While PVsyst is widely used for solar PV system design and simulation, its calculated outputs are often accepted without direct validation under real-world conditions. By conducting an experiment to verify these calculations, this work bridges the gap between theoretical simulations and practical performance, ensuring greater reliability and applicability of the results. Additionally, the financial analysis is grounded in the use of local market prices, which significantly reduces the overall system design cost. This pragmatic approach enhances the affordability and accessibility of the technology, making it more viable for smallholder farmers in tropical regions. The outcomes of this investigation could guide decision-makers and farmers on the advantages of adopting solar PV technology for continuous cultivation throughout the year, thereby encouraging the use of ecofriendly farming methods in the area.
2. Methodology and Case Study at Kaleo
2.1. Study Site
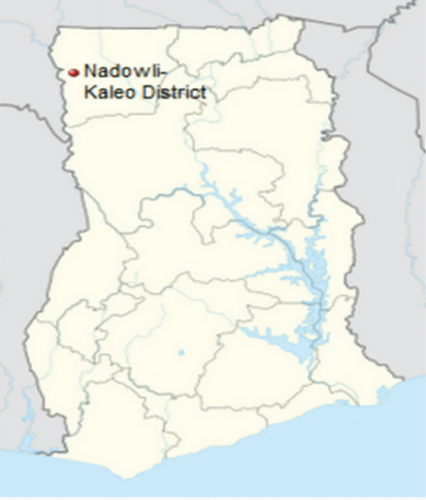
Kaleo, located in the Nadowli-Kaleo district, is a community in the Upper West Region of Ghana, situated in the northwestern part of Ghana (Figure 1). Kaleo is located at 10.17° N and 2.54° W at an average altitude of 314 m above sea level. The community is located approximately 18.5 km northwest of the regional capital, Wa. Kaleo has high solar energy due to the abundant sunshine throughout the year. The region receives an average daily solar irradiation of about 5.5 kWh/m2, which is higher than the global average of about 4.8 kWh/m2 [18]. This high solar energy potential makes the region suitable for the deployment of solar energy systems, such as PV panels, for electricity generation. The farmland for the study covered an area of 1 ha (10,000 m2) and had a downward slope of 1%. The crop cultivated on the land is green beans, which are grown for commercial purposes.
2.2. Design Calculation for Solar-Powered Photovoltaic System (SPVS) for Drip Irrigation
2.2.1. Input Data for the PVsyst Software
PVsyst was used to select the pump and other system components. However, before using the software to select the pump, it was necessary to determine the optimum tilt angle and location-dependent sizing temperatures. The global horizontal irradiance and ambient temperature ground data obtained from the Volta River Authority (VRA) were checked for missing values. The hourly measurements were then extracted. The negative horizontal radiation values were replaced with zero. Through the use of box plots, extreme outliers in the data were also replaced with the appropriate averages of the measured parameters. Table 1 presents the monthly average GHI and ambient temperature in Kaleo, obtained from the imported VRA data using the pivot table functionality in Excel. The data was then provided as input for the weather data in the PVsyst software.
| Month | (MJ/m2) | T (°C) |
|---|---|---|
| January | 20.00 | 28 |
| February | 21.95 | 31 |
| March | 20.99 | 32 |
| April | 21.09 | 32 |
| May | 20.42 | 30 |
| June | 18.54 | 27 |
| July | 16.60 | 26 |
| August | 14.38 | 25 |
| September | 16.88 | 25 |
| October | 19.94 | 28 |
| November | 20.79 | 30 |
| December | 17.96 | 29 |
2.2.2. PV Array Orientation Optimization and Site-Dependent Temperature Setting
To get the best suited orientation for the PV system at the study site, ground measurement data in Table 1 were entered into the PVsyst software. From the orientation section of the software, the optimum tilt angle of 16° was then obtained from a graph of the transposition factor (TF) against the PV tilt angle.
The “lower temperature for absolute voltage limit” is an important site-dependent value because it is related to the safety of the system; it determines the maximum array voltage in any conditions. Ideally, it should be the minimum daylight temperature ever recorded at the site. Ground-level data on global horizontal irradiance and ambient temperatures, recorded every 5 min over the course of a year (January to December 2023), was sourced from the VRA Kaleo Solar Power Plant (KSPP) for the study. From the data obtained from VRA, this value was set to 17°C.
In order to design the SPVS for drip irrigation, the following parameters were calculated: crop water requirement, total head requirement, solar pump power selection, and PV array requirement. The following sections describe how these parameters were estimated.
2.2.3. Crop Water Requirement
| Growth stage | Kc for beans |
|---|---|
| Initial | 0.35 |
| Development | 0.7 |
| Middle | 1.1 |
| Late | 0.9 |
Various software and spreadsheet tools can also be used to compute the water requirements. Due to a lack of data for Kaleo, the monthly water requirements for beans were obtained using the crop water requirement Excel toolbox on solar-powered irrigation systems (SPIS, Version 04.2) developed by the GIZ Project Sustainable Energy for Food – Powering Agriculture. [21]. The tool functions as a primary method for calculating water needs for both crops and livestock and takes location requirement inputs such as the latitude, longitude, and mean daily temperature for each month and monthly rainfall.
2.2.4. Daily Insolation Levels
The PV array’s power production was determined by the amount of insolation and sunshine available at a given place each day [22]. Seasonal and climatic fluctuations cause insolation to vary from one region to another, as well as month to month. If water requirements remain consistent throughout the year, the solar design estimate is based on the month with the lowest insolation. If water use fluctuates throughout the year, the system design is dependent on the water-to-insolation ratio. The month with the highest ratio can be used to calculate the optimal PV array size. This study employed the latter design technique.
2.2.5. Determination of Peak Water Requirement
Using the SPIS Excel toolbox described in Section 2.2.3, the monthly peak water requirements for beans were calculated. The ratio of water requirement for each month was then determined (Table 3). From the table, for the month of March was the largest; hence, water requirement of 69.8 m3/day for the 1-ha land was used for further calculations. In the determination of the water requirement, the planting cycle for beans as recommended by the SPIS toolbox was followed, mainly 1 month and 2 months for land restoration after the first and second growing seasons, respectively.
| Month | Wr (m3/day) | Average monthly solar radiation, (W/m2) | |
|---|---|---|---|
| January | 32.5 | 232.23 | 0.140 |
| February | 58.8 | 255.23 | 0.230 |
| March | 69.8 | 244.07 | 0.286 |
| April | — | 245.23 | — |
| May | 15.3 | 237.44 | 0.064 |
| June | 33.4 | 215.58 | 0.155 |
| July | 9.9 | 193.02 | 0.051 |
| August | — | 167.21 | — |
| September | — | 196.28 | — |
| October | 35.5 | 231.86 | 0.153 |
| November | 64.3 | 241.74 | 0.266 |
| December | — | 208.84 | — |
2.2.6. Selection of Pump
- •
Lift from the surface (considering the height of the storage tank) = 10.2 m
- •
Static water level =10 m
- •
Drawdown =5 m after 2 h of testing
Therefore, a TDH value of 28 m was used for this study.
A suitable pump was then selected from the pump definitions section under the system needs main section of the software. A 1.2 kW Lorentz DC submersible centrifugal pump was recommended by the software to meet the daily hydraulic needs of the design. The efficiency of the pump was determined as 48.1%.
2.2.7. Hydraulic Power Determination
Since the volume of water required per day, Q = 69.8 m3/day (Section 2.2.3), and using 5 h as the peak sunshine hours per day in Kaleo based on the solar radiation data, the volume of water required per hour was estimated as 14 m3/h. We used the PVsyst Software to calculate the size of the storage tank (Vtank) and hydraulic power required (Pout) with values of 70 m3 (70,000 L) and 2.58 kW, respectively, assuming 1 day autonomy and an electicity efficiency of 85%.
2.2.8. Solar DC-DC Converter, Inverter Power, and Pump Power
The DC-to-AC ratio is the ratio of how much DC capacity (the quantity and wattage of solar panels) is installed to the inverter’s AC power rating. The best financial outcomes usually exist between a DC-to-AC ratio of 1.3 and 1.6. However, to maximize system yield, the DC-to-AC ratio should be closer to 1.2.
Since a DC pump was selected in the previous section, PDC−DC was estimated at 3.36 kW.
A 3.36 kW DC-DC converter is not available in the database of the PVsyst software, so a 1.8 kW converter was chosen.
2.2.9. Number of PV Panels
Selecting a 250 Wp monocrystalline module, 10 PV panels was determined and is in agreement with the number suggested by PVsyst.
2.3. Drip Irrigation Design
2.3.1. Layout of Drip Irrigation System
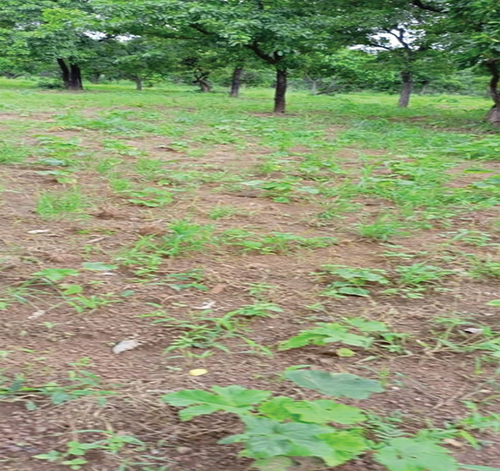
The shape, size, and slope of the field were considered while designing a drip irrigation system, which includes the layout of the main and secondary lines. The secondary lines should run along the field’s slope, if possible, but they can also be set across the slope or follow the contour lines. Once the plan is completed, the diameter and length of the main and branch lines for each subunit are determined using the pipe’s hydraulic design.
2.3.2. Computation of Discharge and Size of Lateral, Submain, and Main Lines
The diameters of the main, submain, and laterals are determined using equations, charts, tables, or software tools. In this study, we used the charts proposed by Megh and Manoj [20] for sizing the lateral and the submain line. In many simple situations, the main pipe size is not designed by following rigorous engineering principles; as such, we used the guidelines for choosing the main line diameter proposed by Ravikumar [19] for sizing the main line (Table 4). The minimum diameters of the lateral, submain, and main lines were determined as 14, 40, and 90 mm, respectively.
| Discharge range (L/s) | Recommended diameter (mm) |
|---|---|
| 0.07–0.13 | 20 |
| 0.13–0.25 | 25 |
| 0.25–0.50 | 32 |
| 0.50–1.0 | 40 |
| 1.00–1.80 | 50 |
| 1.80–3.60 | 63 |
| 3.60–5.75 | 75 |
| 5.75–8.50 | 90 |
| 8.50–15.00 | 110 |
| 15.00–20.00 | 140 |
| 20.00–30.00 | 160 |
2.3.3. Experimental Set-Up for Verification of PVsyst Values
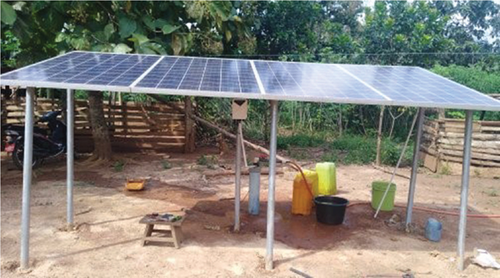
Hourly measurements of the 1.1 kW solar PV array power outputs (Figure 3) from 9 AM to 5 PM from 1 to 30 April 2024 were taken. The setup has four 265 W PV modules connected in series with an MPPT solar DC controller, a 1.1 kW DC submersible pump, and a 1 m3 storage tank situated about 60 m from the PV and the borehole. The array is oriented 30° facing south. The characteristics of the system are summarized in Table 5. Details of the SPVPS at the experimental site.
| Description | Value |
|---|---|
| 4 PV modules | 1.1 kW |
| Static water level | 30 m |
| Pump level | 3 m from borehole bottom |
| Borehole depth | 60 m |
| Tank volume | 1 m3 |
| Tank height | 1.4 m |
| Pipe length from borehole to tank | 60 m |
| Volume of water required per day | 2 m3 |
2.4. Economic Analysis
2.4.1. LCC
2.4.2. Net Present Value (NPV)
When the NPV>0, the project is considered viable.
2.4.3. Payback Period
3. Results and Discussion
3.1. Proposed Standalone Solar PV System at the Farm
From the simulation results, the total water pumped is estimated as 23,670 m3/year, whereas the total need is estimated as 25,550 m3/year, resulting in missing water of approximately 7.4% (Table 6). Hence, the designed system could meet 92.6% of the irrigation water needs for the selected site. Similar results have been observed by Habib et al. [26], where the designed systems could meet between 93% and 97% of the water needs of the communities studied. The results also show that complete water demands are fulfilled from November to April (Table 6). However, additional water is needed in the months of May to October, with the highest demand of 662.47 m3 needed in August. The northern part of Ghana is characterized by a unimodal rainy season between May and September. So, it is likely that additional water will be provided by the rain.
| GlobEff | EArrMPP | E_pumpOp | EtkFull | H_pump | WPumped | W_Used | W_Miss | |
|---|---|---|---|---|---|---|---|---|
| kWh/m2 | kWh | kWh | kWh | meterW | m3/day | m3/day | m3/day | |
| January | 190.8 | 363.1 | 276.4 | 25.29 | 22.87 | 70.48 | 70.00 | 0.00 |
| February | 180.2 | 336.4 | 249.0 | 22.59 | 22.79 | 69.98 | 70.00 | 0.00 |
| March | 180.2 | 337.3 | 274.7 | 14.34 | 22.68 | 69.54 | 69.59 | 0.41 |
| April | 165.7 | 314.1 | 262.4 | 11.11 | 22.65 | 68.68 | 69.11 | 0.89 |
| May | 157.4 | 303.7 | 266.9 | 4.26 | 22.55 | 67.40 | 66.92 | 3.08 |
| June | 134.9 | 264.9 | 233.3 | 4.32 | 22.32 | 60.06 | 60.99 | 9.01 |
| July | 126.5 | 250.9 | 223.2 | 1.16 | 22.15 | 54.81 | 55.51 | 14.49 |
| August | 114.4 | 228.6 | 205.4 | 0.00 | 22.02 | 50.04 | 48.63 | 21.37 |
| September | 135.4 | 264.3 | 227.0 | 0.28 | 22.35 | 58.43 | 59.89 | 10.11 |
| October | 178.7 | 341.4 | 273.9 | 13.22 | 22.95 | 70.23 | 68.68 | 1.32 |
| November | 191.5 | 361.4 | 263.4 | 34.12 | 23.11 | 70.05 | 70.00 | 0.00 |
| December | 172.8 | 330.1 | 269.8 | 11.46 | 22.87 | 68.90 | 68.90 | 1.10 |
| Year | 1928.8 | 3696.1 | 3025.3 | 142.16 | 22.60 | 64.85 | 64.81 | 5.19 |
3.2. Normalized Production
The nominal production chart for the system is presented in Figure 4. The chart effectively visualizes the distribution of energy utilization and the occurrence of unused energy. It provides insights into the performance and efficiency of the solar pumping system, enabling further optimization and fine-tuning of the system to enhance energy utilization and minimize unused energy.
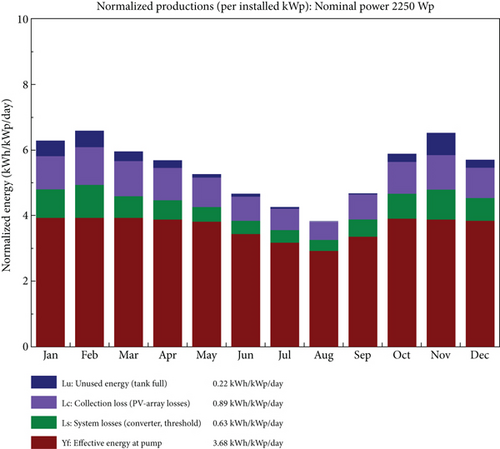
The effective energy at the pump, representing the amount of energy effectively utilized for water pumping, exhibits a nearly consistent trend throughout the year. This trend highlights the seasonal variation in energy utilization for water pumping, with higher demands during the drier months. Averagely, the effective energy at the pump is estimated to be 3.68 kWh/kWp/day.
The chart also depicts the portion of unused energy. This metric represents the energy lost when the pump is stopped when the tank is full. The values for unused energy show a slight variation over the months. Most energy is lost during the drier months (October to April) as compared to the rainy months (May to September). The relatively low values of unused energy indicate that the PV system is not oversized; otherwise, there would have been a sufficient amount of unused energy that could have called for the chance to increase the tank capacity, as reported by Salman et al. [27].
3.3. Performance Ratio (PR)
The PR diagram is a graphical representation that depicts the efficiency and performance of a PV system (Figure 5). The PR relates the actual yield of the PV system to the reference yield. The PR takes into account various factors that can affect the system’s efficiency, such as module degradation, shading, soiling, and other losses.
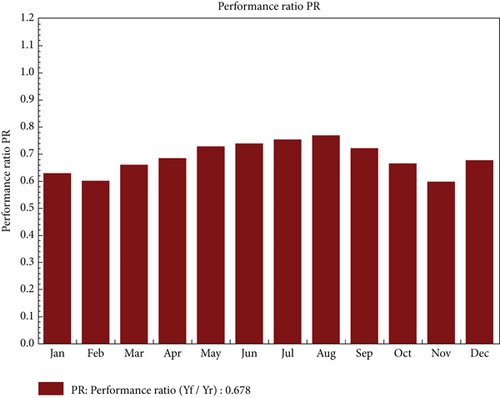
The highest PR of 80% was recorded in the month of August due to the low module temperature, and the lowest PR of 58% was obtained in the month of November due to the high temperature of the PV module. The annual average PR for the design is 67.8%. The value is indicative of approximately 32% losses in the proposed system. The high PR indicates that the system will operate efficiently [26].
3.4. Daily Array Output Energy
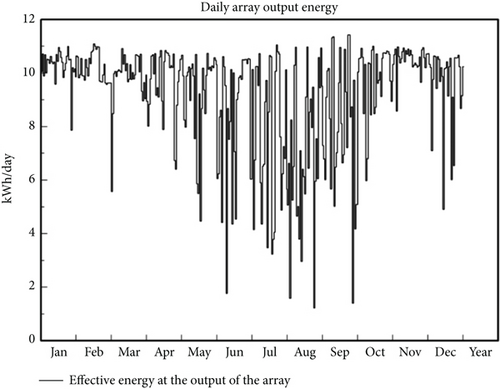
Figure 6 presents the daily array output energy. In general, it is seen from the chart that with higher solar irradiation, the array output energy increased. The maximum output energy of approximately 11.5 kWh/day was recorded in late September, whereas the lowest was recorded in late August.
3.5. Daily Water Production Versus Irradiation
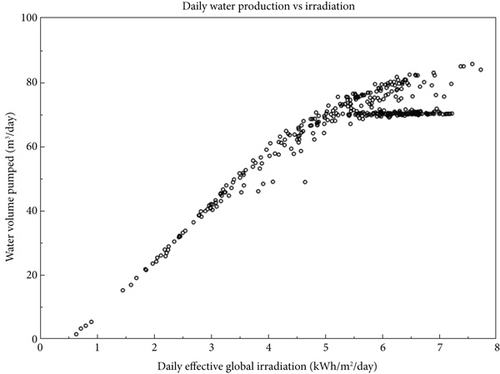
The relationship between the daily water production and the solar irradiation levels received by the PV panels over the year is presented in Figure 7. As the solar irradiation levels increase, more solar energy is captured by the PV panels, resulting in higher power generation as observed by Habib et al. [26]. This increased power drives the pump to deliver a greater flow rate of water, thus leading to higher daily water production. Conversely, when solar irradiation levels are low, the solar energy captured by the PV panels decreases. This results in reduced power generation, leading to a lower flow rate and subsequently lower daily water production.
3.6. Flow Rate as a Function of Irradiance
The flow rate function of irradiance over the year illustrates how the flow rate varies as the solar irradiance changes throughout the day (Figure 8). The figure shows how available irradiance influences the water flow rate due to the operation of the pump.
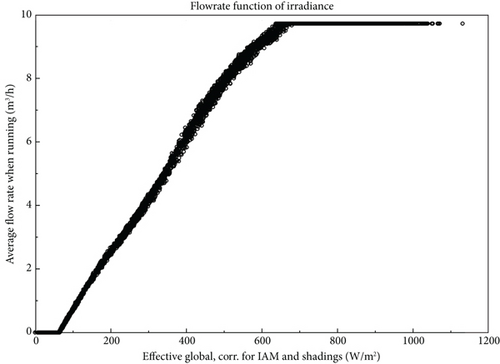
Typically, as the solar irradiance increases, the flow rate of the pumping system also increases. This is because higher solar irradiance provides more energy to the PV panels, resulting in increased power output. This additional power allows the pump to operate at a higher capacity, resulting in a higher flow rate. This is clearly observed in and is confirmed in the daily water production in. The simulation results also show that the solar PV water pumping system operates at an irradiance of 80 W/m2. Below this level, there is not enough radiation to start the pump; hence, there is no flow rate.
3.7. Flow Rate Function of Pump Power
Figure 9 illustrates the relationship between available power for pumping and water flow rate over the year. The water pump controller adjusts the flow rate and size of the pump based on its available energy. The solar PV water pumping system operates at a power level of around 100 W, below which the pump does not operate. The flow rate is zero below 100 W and grows with available power, peaking at noon when PV system production is at its highest.
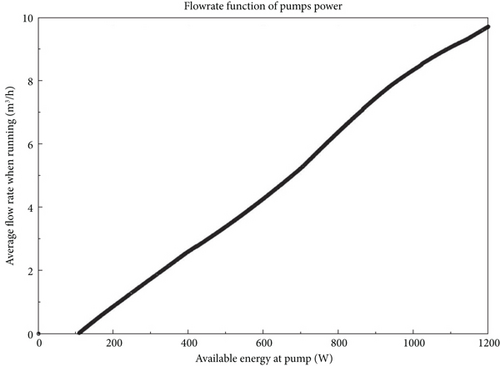
At 200 W, the water flow rate is ~1 m3/h. At 600 W of PV system power, the water flow rate is ~4 m3/h, while at 1 kW, the flow rate is ~8.2 m3/h. It is thus seen that increased available power leads to higher water flow rates, which is in conformity with the study by Habib et al. [26].
3.8. Daily Input/Output Effective Energy for the System
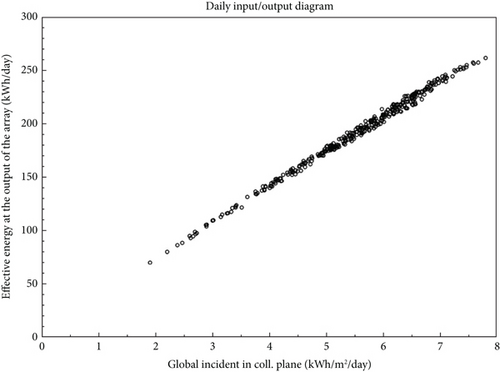
The effective energy at the solar array output over the year is proportional to the global incidence in the collector plane (Figure 10), which conforms to the observation by Habib et al. [26]. The figure displays a concentration of over 4 kWh/m2/day global incidence in the collector plane, indicating that the PV array generates 140 kWh/day or more for most of the year.
3.9. System Losses
The system designed could not generate 100% of the energy from the sun due to some losses. Figure 11 presents the overall Sankey system loss diagram for the design. The loss diagram provides a rapid and insightful look at the quality of a PV system design by identifying the primary sources of losses. This allows the assessment of the seasonal effect and impact of the various losses.
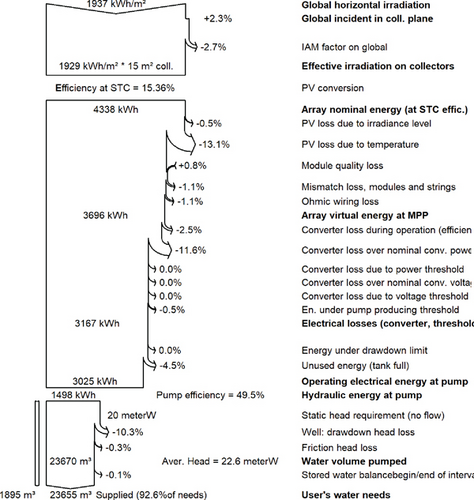
The total solar radiation received on a horizontal surface amounts to 1937 kWh/m2. However, the actual solar energy captured by the solar panel is lower at 1929 kWh/m2 because of the 2.7% decrease in losses due to the incidence angle modifier (IAM) factor, despite an initial increase of 2.3% in the collector plane.
IAM losses refer to the decrease in the amount of solar energy converted into electricity due to the angle at which sunlight hits the solar panels. Solar PV panels are most efficient when the sunlight strikes them directly perpendicular to their surface, according to Tania [28]. As the angle of incidence increases, the efficiency of the panel decreases because less sunlight reaches the cells within the panel. Therefore, more research can be done at the site to evaluate the optimum angle that reduces the IAM losses. In general, the loss result can be analyzed further to improve system efficiency.
3.10. Experimental PV Output Power Versus PVsyst Output Power
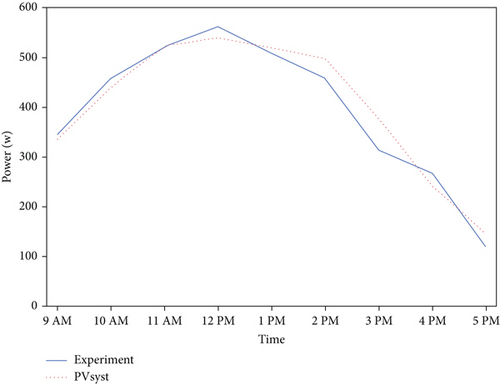
Figure 12 shows the graph of the average of the 1-month solar array power output measured at the site versus the average array output obtained from the PVsyst model. It is seen from the figure that, in general, there is a good correlation between the experimental measurements and the output produced by the PVsyst software. The average error was found to be 8%. Hence, it can be concluded that the results from the PVsyst simulations can be accepted to a degree of 8%.
3.11. LCC Analysis of the SPVWPS
Based on the financial results, the installation cost for the SPVWPS was determined to be $7553.32. In terms of expenses, the operating costs are estimated to be $150 per year. The annual revenue generation was $5527. Regarding the return on investment, the NPV of the project was assessed to be $13,097.77 with an IRR of 71.17%, indicating a positive return. The payback period for the investment was projected to be 1.3 years, which indicates a relatively short time frame for recovering the initial investment through cost savings and revenue generation. These financial results demonstrate the viability and attractiveness of the solar project, indicating potential long-term cost savings, environmental benefits, and a favorable return on investment.
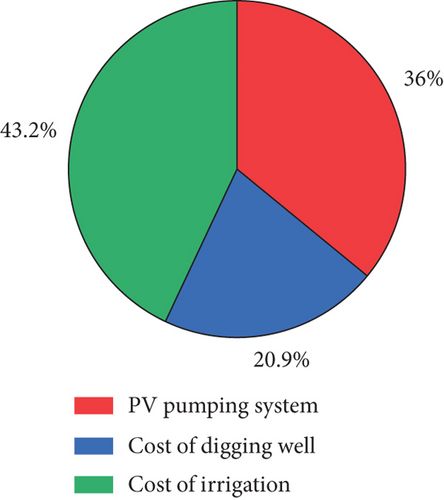
The three major cost elements in the capital cost of an SPVWPS are the PV pumping system cost, the cost of drilling the borehole, and the cost of irrigation (Figure 13a). The PV pumping system accounted for 36% of the total cost ($2715). The cost of drilling the borehole constituted 21% of the overall expenditure. Irrigation costs formed the largest portion, amounting to 43% of the total investment. These cost distributions highlight the financial emphasis on irrigation infrastructure while reflecting the significant expenses associated with energy generation and water extraction.
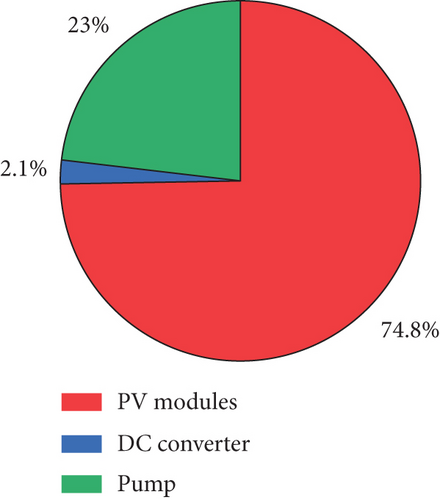
The components that make up the PV pumping system cost are reported in Figure 13b (the PV modules, the MPPT DC converter, and the water pump). The PV modules accounted for the largest proportion of the total cost, making them the most significant investment. The water pump represents a substantial cost component, while the MPPT DC converter constitutes a relatively minor portion of the overall expenditure.
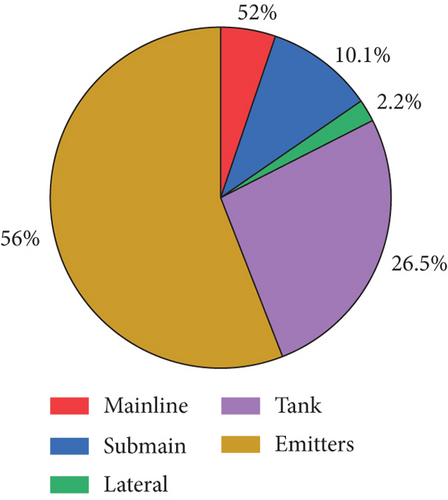
The cost of the irrigation system is distributed across several key components: the mainline, submain, lateral, drip emitters, and storage tank (Figure 13c). The mainline accounted for 5% of the total irrigation cost, while the submain represents 10%. The lateral system contributed 2% to the total expenditure. Drip emitters made up the largest share, representing 56% of the irrigation cost. The storage tank constituted 27% of the total irrigation expenditure.
The drip emitters are essential for efficient water distribution in the system, but they represent the largest portion of the financial outlay of the irrigation system. Given their significant contribution to the overall cost, efforts to reduce the price of drip emitters could have a substantial impact on the total cost of the irrigation system. This could include exploring alternative, more affordable emitter technologies, optimizing their placement to reduce the number required, or using locally sourced materials to lower production costs. By refining these factors, it is possible to reduce the cost burden associated with the drip emitters while maintaining the system’s efficiency and effectiveness.
3.12. Sensitivity Analysis
A comprehensive sensitivity analysis was conducted to examine how variations in crucial parameters affect the system. This analysis focused specifically on the discount rate and capital subsidy to assess the system’s robustness and inform strategic decisions. By evaluating these key financial parameters, stakeholders can better understand the system’s economic stability and make more informed choices regarding implementation and resource allocation.
The discount rate represents the interest rate for borrowing from local and international banks. It determines the present value of future cash flows, reflecting the time value of money, risk, and opportunity cost. It is crucial for investment decisions, risk assessment, and asset valuation.
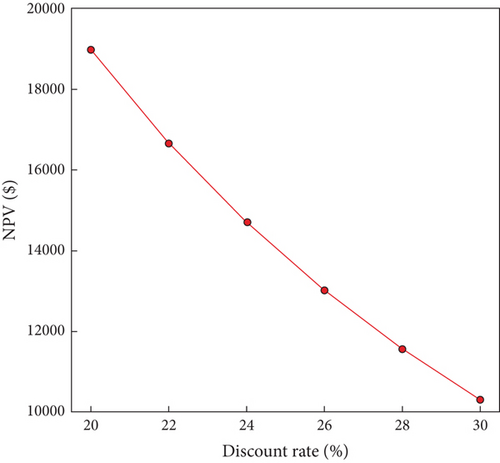
Figure 14 illustrates the effect of the discount rate on the system’s NPV. A lower discount rate increases NPV and vice versa, showing an inverse relationship. For instance, reducing the discount rate from 26% (base case discount rate in this study—BoG [29]) to 24% raises the NPV by 12%. At 20%, NPV rises by 46%, while a 30% rate reduces NPV by 21%. This is because the future cash flows reduce in value if discounted at a higher rate. Therefore, a lower discount rate is always desirable. A lower discount rate from banks can attract investments, ensuring better returns for stakeholders.
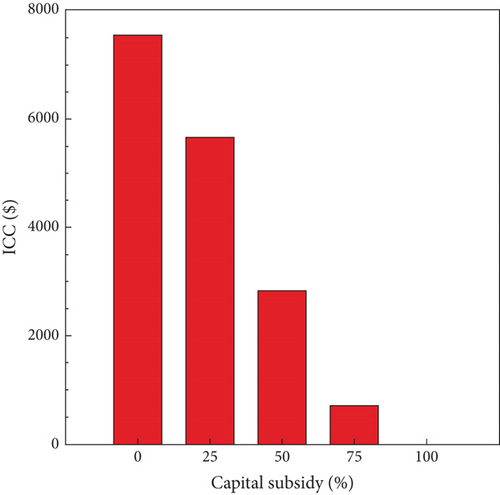
The total initial capital is the required cost to start the project, but high upfront expenses in renewable energy projects often deter stakeholders. Support from local or international donor agencies can help overcome this barrier and encourage deployment. Figure 15 shows a bar graph visual representation of capital subsidy on the initial capital, where a 50% subsidy reduces the initial capital by 63%, whereas a 75% subsidy reduces it by 91%. This shows that donor support can encourage more farmers to shift to solar drip irrigation, enhancing renewable energy adoption.
4. Conclusions
This research has explored the design, simulation, and economic analysis of a solar PV pumping system for drip irrigation of 1-ha bean farmland in Kaleo. Through a comprehensive analysis, the study has identified several critical insights that significantly contribute to the understanding of such systems. Through simulation and analysis, the optimum tilt angle of the solar collectors was determined to be 16° with a solar azimuth of 0° (collectors facing due south). The proposed standalone PV system demonstrated its efficiency in capturing solar energy. The pump operating energy recorded a total of 3025 kWh, demonstrating the energy consumption during pumping operations. The system showcased its capacity to meet water demand, pumping 23,670 m3 of water annually, which fulfilled approximately 92.6% of the water needs for the bean farm.
The PR provided a view of the PV system’s efficiency and energy conversion performance over different months. The average PR of 67.8% suggests approximately 32% losses in the proposed system. The daily array output energy highlighted the direct relationship between solar irradiation and the system’s energy output. As solar irradiation levels improved, the PV array produced higher energy yields. The positive correlation between daily water production and solar irradiation levels reaffirmed the system’s dependence on solar energy for pumping water. As solar irradiation increased, so did the power generation, resulting in higher water flow rates and daily water production. Conversely, during periods of low solar irradiation, water production decreased due to reduced power generation.
The financial analysis emphasized the economic viability of the system. With an initial installation cost of $7553.32, the system demonstrated a positive NPV of $13,097.77, indicating a promising return on investment. The short payback period of 1.3 years signifies a rapid recovery of the initial investment through cost savings and revenue generation.
The identified optimum array orientation, efficient solar energy utilization, and performance insights provide valuable guidance for implementing similar sustainable agricultural systems. Understanding the system’s seasonal variations and solar resource availability, farmers and policymakers can work together to enhance agricultural productivity, achieve cost savings, and foster environmental sustainability in the region. The positive financial results further validate the feasibility and desirability of adopting SPIS, encouraging wider adoption of clean and renewable energy technologies in Ghana’s agricultural sector.
Nevertheless, the financial analysis suggests that the upfront cost may pose a major obstacle to widespread adoption, especially among smallholder farmers in Kaleo. Although the solar PV system is a significant part of the overall cost, the most expensive elements in the drip irrigation section are the drip emitters, storage tanks, and particularly borehole drilling. These high costs make the system unaffordable for many local farmers, emphasizing the need for policymakers to explore financial aid, subsidies, or more affordable alternatives, such as locally produced components, to enhance accessibility and reduce costs.
- •
To help farmers gain access to the many benefits of a solar-powered pumping system, the government should provide financing and other services to assist in system implementation. In this case, year-round farming will be encouraged, and the local farmers’ livelihood will be improved as the price of agricultural commodities falls dramatically.
- •
To promote sustainable agriculture and enhance farmers’ access to energy, the government and other development partners must collaborate to provide farmers with subsidies, financial help, and technical support for purchasing and installing solar irrigation systems.
- •
Policymakers must create and implement appropriate management plans and policies to replace existing diesel-powered pumps with solar pumps while avoiding excessive groundwater abstraction.
- •
More research and development are required to improve the efficiency, dependability, and durability of solar irrigation systems, as well as to create low-cost, easy-to-maintain systems ideal for smallholder farmers.
- •
Targeted outreach and education campaigns can help build the capacity of farmers and others about solar irrigation.
- •
To stimulate the adoption of solar irrigation systems, the government should improve awareness and knowledge among farmers, as well as support and invest in the development and promotion of solar irrigation systems throughout the country.
- •
Public–private partnerships and collaborations to boost research and development, knowledge sharing, and technology transfer in the field of solar irrigation should be encouraged.
Conflicts of Interest
The authors declare no conflicts of interest.
Funding
No funding was received for this study.
Open Research
Data Availability Statement
The data that support the findings of this study are available from the corresponding author upon reasonable request.


