Derivation and Validation of Prediction Models for Prolonged Length of Stay and 30-Day Readmission in Elderly Patients With Type 2 Diabetes Mellitus: A Multicenter Study
Abstract
Background: Elderly patients with Type 2 diabetes mellitus (T2DM) often experience prolonged length of stay (LOS) and 30-day readmission. This study was aimed at identifying factors influencing these outcomes and develop predictive models for them.
Methods: The least absolute shrinkage and selection operator (LASSO) combined with logistic regression was utilized to construct the prediction models, which were subsequently visualized through nomograms. The performance of these models was comprehensively evaluated in terms of discrimination, calibration, and clinical utility. Specifically, the discrimination capacity was assessed using the area under the receiver operating characteristic curve (AUROC), while calibration was evaluated via calibration curves and the Brier score. Clinical utility was examined through decision curve analysis (DCA) and clinical impact curve (CIC). Additionally, to verify the robustness and generalizability of the developed prediction models, subgroup analyses were conducted across various strata of the study population.
Results:A total of 24 variables for 8800 patients were included for predicting prolonged LOS, and 38 variables were used for 30-day readmission prediction. In the training set, 28.42% of patients had prolonged LOS and 13.68% were readmitted within 30 days. The prolonged LOS model had an AUROC of 0.720 (95% CI: 0.703–0.737), while the 30-day readmission model achieved 0.766 (95% CI: 0.745–0.787). The Brier scores were 0.174 (95% CI: 0.168–0.180) and 0.102 (95% CI: 0.096–0.108), respectively. Both models showed good clinical utility in DCA and CIC analyses. Subgroup validation across different age groups showed consistent performance, with all AUROCs above 0.60. Albumin was identified as the most significant predictor in both models.
Conclusion: The predictive models developed in this study demonstrated robust performance in forecasting common outcomes in elderly patients with T2DM. Moreover, albumin level was strongly associated with both prolonged LOS and 30-day readmission, making it a key factor in patient management.
1. Introduction
The global prevalence of diabetes has risen significantly in recent years, resulting in increased healthcare costs and placing a substantial burden on healthcare systems worldwide [1, 2]. According to the International Diabetes Federation (IDF), approximately 10.5% of the global population aged 20–79 (536.6 million people) had diabetes in 2021, and this number is expected to rise to 12.2% (783.2 million people) by 2045 [3]. In China, the prevalence of Type 2 diabetes mellitus (T2DM) increased from 10.9% in 2012 to 12.4% in 2018 [4]. The economic impact of diabetes is equally concerning, with global healthcare expenditures projected to reach $1054 billion by 2045 [3]. In 2014, China recorded the highest direct medical costs for diabetes globally, totaling $170 billion [5]. By 2020, these costs had risen to $190.2 billion, with per capita economic burdens reaching $231. If current trends continue, these figures are expected to increase to $337.8 billion and $414, respectively, by 2030, with annual growth rates of 5.98% and 6.02% [6].
Prolonged length of stay (LOS) and 30-day readmission are critical indicators of patient health outcomes and healthcare efficiency [7, 8]. Prolonged LOS is associated with adverse health effects, including depression [9] and an increased risk of hospital-acquired infections [10–12], often leading to a cycle of delayed discharges [13]. Similarly, 30-day readmission rates are widely used as a measure of hospital performance and quality of care, reflecting potential gaps in patient management [14, 15]. Research shows that diabetes patients have significantly higher 30-day readmission rates compared to the general hospitalized population [16, 17]. Both prolonged LOS and 30-day readmission contribute to rising healthcare costs, particularly among elderly patients. These issues highlight the growing economic and clinical burden of T2DM in elderly populations, necessitating urgent attention and intervention.
Despite the significance of these outcomes, there is limited research focusing on prolonged LOS and 30-day readmission among elderly T2DM patients. This study is aimed at addressing this gap by identifying risk factors associated with prolonged LOS and 30-day readmissions in this population. Additionally, we aim to develop predictive models to facilitate early identification of high-risk patients, enabling the implementation of targeted interventions to improve outcomes and reduce healthcare costs.
2. Methods
2.1. Data Source and Study Participants
This study was approved by the ethics committee of the Chongqing Medical University (Approval No. 2024097), the ethics committee of the Affiliated Banan Hospital of Chongqing Medical University (Approval No. BNLLKY2023037), and the ethics committee of the First Affiliated Hospital of Zhejiang University School of Medicine (Approval No. IIT20230312B-R1). Due to the retrospective nature of the study, informed consent was waived, and the research was conducted in accordance with national regulations and institutional guidelines.
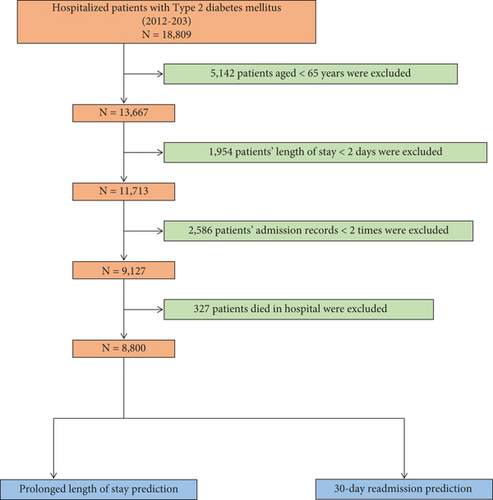
To ensure scientific rigor, internal consistency, clinical relevance, and data quality, we established the following inclusion and exclusion criteria. Inclusion criteria were (1) hospitalization(s) for T2DM and (2) data collected between 2012 and 2023. Exclusion criteria were (1) age < 65 years (n = 5142), (2) LOS < 2 days (n = 1954), (3) fewer than two admission records (n = 2586), and (4) in-hospital death (n = 327). After applying these criteria, 8800 patients were included in the study. The patient selection process is summarized in Figure 1.
Data were obtained from six tertiary hospitals affiliated with the Medical Data Science Academy of Chongqing Medical University, covering the period from January 2011 to December 2022. Patients from these hospitals were randomly divided into a training set (n = 4729) and an internal validation set (n = 2027) in a 7:3 ratio. Additionally, patients from the Affiliated Banan Hospital of Chongqing Medical University (January 2018–December 2023, n = 1244) and the First Affiliated Hospital of Zhejiang University School of Medicine (January 2020–December 2022, n = 800) were used as External Validation Set I and External Validation Set II, respectively.
2.2. Predictors and Outcomes
Clinical data were extracted from the electronic medical record (EMR) system within 48 h of admission: (1) basic information: age, sex, insurance type, past surgical history (PSH), smoking history, drinking history, age-adjusted Charlson comorbidity index (ACCI) score, and LOS; (2) diagnosis: hypertension, coronary heart disease (CHD), cerebral infarction (CI), and hyperlipidemia; (3) laboratory measurements: aspartate aminotransferase (AST), alanine aminotransferase (ALT), triglycerides (TGs), creatinine (CREA), uric acid (UA), low-density lipoprotein cholesterol (LDL-C), high-density lipoprotein cholesterol (HDL-C), albumin (ALB), estimated glomerular filtration rate (eGFR), neutrophil-to-lymphocyte ratio (NLR), platelet-to-lymphocyte ratio (PLR), lymphocyte-to-monocyte ratio (LMR), and neutrophil percentage-to-albumin ratio (NPAR); (4) vital signs: systolic blood pressure (SBP) and diastolic blood pressure (DBP); (5) medication administration: nutritional support drug use, antihypertensive drug use, antidiabetic drug use, statin drug use, antiplatelet and anticoagulant drug use, Chinese patent medicine use, analgesic drug use, antiosteoporotic drug use, antibiotic drug use, hemostatic agent drug use, and psychotropic drug use.
This study focused on two main outcomes: prolonged LOS and 30-day readmission. Prolonged LOS was defined as a binary variable, with the cutoff set at the 75th percentile of the LOS distribution among participants, which was 14 days [18–20]. Patients with a LOS of 14 days or more were coded as 1, while those with less than 14 days were coded as 0. A 30-day readmission was defined as any readmission occurring within 30 days of discharge, regardless of the reason. The time to readmission was calculated by subtracting the LOS of the initial admission from the interval between the two admissions. Only the first readmission and its corresponding initial admission were included in the final analysis.
2.3. Definition
The type of insurance selected by individuals reflects the economic burden on them and their families. In this study, insurance types were categorized as urban employee medical insurance (UEMI), urban resident medical insurance (URMI), full self-payment, and other insurance. The ACCI score was used to quantify comorbidities based on the number and severity of illnesses, serving as a prognostic evaluation tool [21]. The eGFR was calculated using the Modification of Diet in Renal Disease (MDRD) study equations [22], in line with current recommendations. Novel markers such as the NLR, PLR, LMR, and NPAR were used to assess systemic inflammation and have been linked to adverse outcomes [23–25].
2.4. Model Development
Variables identified as statistically significant in univariate logistic regression analysis were included in the least absolute shrinkage and selection operator (LASSO) regression analysis, followed by a multivariate logistic regression model. A nomogram was then constructed using the “rms” package in R. Each regression coefficient from the multivariate logistic regression model was proportionally converted into a score ranging from 0 to 100, with the highest absolute β coefficient assigned a score of 100. The total score was calculated by summing the scores of each variable, and this total score was then converted into a predicted probability.
2.5. Model Performance
To avoid overfitting and determine the optimal number of variables for the model, we iteratively identified K variables associated with prolonged LOS and 30-day readmission. We plotted the mean area under the receiver operating characteristic curve (AUROC) for different values of K to ensure a robust model. For model evaluation, we calculated the AUROC for the training set, internal validation set, and external validation sets. We also assessed sensitivity, specificity, positive predictive value (PPV), negative predictive value (NPV), and Youden’s index. Calibration plots and Brier scores were used to illustrate the relationship between predicted risk values and actual observed outcomes. Decision curve analysis (DCA) and clinical impact curve (CIC) were performed to evaluate the clinical effectiveness of the model and quantify the net benefit to patients. Subgroup analysis was conducted by categorizing patients into three age groups: under 75 years, 75–84 years, and over 84 years, to assess the model’s performance within each subgroup.
2.6. Statistical Analyses
We followed the transparent reporting of a multivariable prediction model for individual prognosis or diagnosis (TRIPOD) guidelines for reporting (Table S1) [26]. Missing data were handled using multivariate multiple imputation with chained equations to maximize statistical power and minimize bias. Discrete variables were expressed as rates and percentages, with the chi-square test used for group comparisons. Quantitative variables, which did not follow a normal distribution, were represented by the median and interquartile range [M(Q25 − Q75)], and the Mann–Whitney U test was used for group comparisons. All statistical analyses were two-sided, with statistical significance set at p < 0.05. Analyses were performed using SPSS Version 22.0 and R (Version 4.3.2, Vienna, Austria).
3. Results
3.1. Patient Characteristics
A total of 8800 patients were included in the study, divided into four groups: 4729 in the training set, 2027 in the internal validation set, 1244 in External Validation Set I, and 800 in External Validation Set II. These groups were selected for predicting prolonged LOS and 30-day readmission after excluding individuals who did not meet the inclusion criteria. In the training and internal validation sets, 1902 patients (28.15%) experienced prolonged LOS, and 923 patients (13.66%) were readmitted within 30 days of discharge. Detailed patient characteristics, stratified by outcomes, are presented in Tables 1 and 2. The Mann–Whitney U test showed no significant differences in missing variables between the training and internal validation sets before and after multiple imputations (Table S2).
| Variables | Total (N = 6756) | Prolonged LOS (N = 1902) | Normal LOS (N = 4854) | p value |
|---|---|---|---|---|
| Basic information | ||||
| Age (year) | 74.00 (69.00, 79.00) | 74.00 (69.00, 80.00) | 73.00 (69.00, 79.00) | 0.069 |
| Sex (n, %) | < 0.001 | |||
| Female | 3744 (55.42) | 960 (50.47) | 2784 (57.35) | |
| Male | 3012 (44.58) | 942 (49.53) | 2070 (42.65) | |
| PSH (n, %) | 0.051 | |||
| Yes | 4488 (66.43) | 1298 (68.24) | 3190 (65.72) | |
| No | 2268 (33.57) | 604 (31.76) | 1664 (34.28) | |
| Smoking history (n, %) | < 0.001 | |||
| Yes | 1960 (29.01) | 614 (32.28) | 1346 (27.73) | |
| No | 4796 (70.99) | 1288 (67.72) | 3508 (72.27) | |
| Drinking history (n, %) | 0.029 | |||
| Yes | 1585 (23.46) | 481 (25.29) | 1104 (22.74) | |
| No | 5171 (76.54) | 1421 (74.71) | 3750 (77.26) | |
| Diagnosis | ||||
| Hypertension (n, %) | < 0.001 | |||
| Yes | 4350 (64.39) | 1287 (67.67) | 3063 (63.10) | |
| No | 2406 (35.61) | 615 (32.33) | 1791 (36.90) | |
| CHD (n, %) | 0.010 | |||
| Yes | 2223 (32.90) | 671 (35.28) | 1552 (31.97) | |
| No | 4533 (67.10) | 1231 (64.72) | 3302 (68.03) | |
| CI (n, %) | < 0.001 | |||
| Yes | 1221 (18.07) | 514 (27.02) | 707 (14.57) | |
| No | 5535 (81.93) | 1388 (72.98) | 4147 (85.43) | |
| Hyperlipidemia (n, %) | 0.247 | |||
| Yes | 1026 (15.19) | 273 (14.35) | 753 (15.51) | |
| No | 5730 (84.81) | 1629 (85.65) | 4101 (84.49) | |
| Laboratory measurements | ||||
| AST (IU/L) | 20.00 (16.00, 26.00) | 20.35 (16.00, 28.50) | 19.95 (16.00, 25.00) | < 0.001 |
| ALT (IU/L) | 18.00 (13.00, 26.00) | 18.00 (13.00, 29.00) | 17.60 (13.00, 25.00) | < 0.001 |
| TGs (mmol/L) | 1.42 (1.04, 2.04) | 1.39 (1.00, 1.96) | 1.44 (1.06, 2.08) | < 0.001 |
| NLR | 2.98 (2.08, 4.74) | 3.56 (2.33, 6.11) | 2.81 (2.01, 4.26) | < 0.001 |
| LMR | 3.88 (2.59, 5.48) | 3.33 (2.10, 4.87) | 4.11 (2.82, 5.68) | < 0.001 |
| PLR | 124.38 (91.01, 172.37) | 132.21 (95.49, 191.60) | 122.00 (90.00, 164.85) | < 0.001 |
| NPAR | 16.79 (14.63, 19.44) | 18.83 (15.63, 22.40) | 16.31 (14.35, 18.45) | < 0.001 |
| CREA (μmol/L) | 72.00 (57.90, 92.10) | 75.40 (59.10, 99.50) | 71.10 (57.50, 89.40) | < 0.001 |
| UA (μmol/L) | 326.25 (260.58, 399.00) | 316.10 (254.05, 397.58) | 328.60 (262.89, 399.25) | 0.011 |
| LDL-C (mmol/L) | 2.49 (1.90, 3.14) | 2.35 (1.78, 3.00) | 2.53 (1.95, 3.20) | < 0.001 |
| HDL-C (mmol/L) | 1.12 (0.93, 1.35) | 1.08 (0.88, 1.32) | 1.14 (0.95, 1.36) | < 0.001 |
| ALB (g/L) | 40.60 (37.50, 43.60) | 38.01 (34.30, 41.74) | 41.24 (38.60, 44.10) | < 0.001 |
| GFR (mL/min) | 83.55 (63.03, 101.95) | 81.06 (57.68, 100.47) | 84.33 (64.94, 102.65) | < 0.001 |
| Vital signs | ||||
| SBP (mmHg) | 139.00 (126.00, 154.00) | 139.00 (125.00, 154.00) | 140.00 (126.00, 153.00) | 0.605 |
| DBP (mmHg) | 78.00 (70.00, 85.00) | 78.00 (70.00, 85.00) | 78.00 (70.00, 85.00) | 0.274 |
- Abbreviations: ALB, albumin; ALT, alanine aminotransferase; AST, aspartate aminotransferase; CHD, coronary heart disease; CI, cerebral infarction; CREA, creatinine; DBP, diastolic blood pressure; eGFR, estimated glomerular filtration rate; HDL-C, high-density lipoprotein cholesterol; LDL-C, low-density lipoprotein cholesterol; LMR, lymphocyte-to-monocyte ratio; NLR, neutrophil-to-lymphocyte ratio; NPAR, neutrophil percentage-to-albumin ratio; PLR, platelet-to-lymphocyte ratio; PSH, past surgical history; SBP, systolic blood pressure; TGs, triglycerides; UA, uric acid.
| Variables | Total (N = 6756) | 30-day readmission (N = 923) | Non-30-day readmission (N = 5833) | p value |
|---|---|---|---|---|
| Basic information | ||||
| Age (year) | 74.00 (69.00, 79.00) | 73.00 (68.00, 78.00) | 74.00 (69.00, 79.00) | 0.003 |
| Sex (n, %) | < 0.001 | |||
| Female | 3744 (55.42) | 389 (42.15) | 3355 (57.52) | |
| Male | 3012 (44.58) | 534 (57.85) | 2478 (42.48) | |
| Insurance type (n, %) | 0.005 | |||
| Full self-pay | 590 (8.73) | 66 (7.15) | 524 (8.98) | |
| UEMI | 4599 (68.07) | 649 (70.31) | 3950 (67.72) | |
| URMI | 1250 (18.51) | 182 (19.72) | 1068 (18.31) | |
| Other insurance | 317 (4.69) | 26 (2.82) | 291 (4.99) | |
| ACCI score (n, %) | 0.003 | |||
| < 8 | 1792 (26.52) | 282 (30.55) | 1510 (25.89) | |
| ≥ 8 | 4964 (73.48) | 641 (69.45) | 4323 (74.11) | |
| PSH (n, %) | 0.240 | |||
| Yes | 4488 (66.43) | 597 (64.68) | 3891 (66.71) | |
| No | 2268 (33.57) | 326 (35.32) | 1942 (33.29) | |
| Smoking history (n, %) | < 0.001 | |||
| Yes | 1960 (29.01) | 361 (39.11) | 1599 (27.41) | |
| No | 4796 (70.99) | 562 (60.89) | 4234 (72.59) | |
| Drinking history (n, %) | < 0.001 | |||
| Yes | 1585 (23.46) | 267 (28.93) | 1318 (22.60) | |
| No | 5171 (76.54) | 656 (71.07) | 4515 (77.40) | |
| LOS (day) | 10.00 (7.00, 14.00) | 12.00 (7.00, 21.00) | 9.00 (7.00, 14.00) | < 0.001 |
| Diagnosis | ||||
| Hypertension (n, %) | 0.067 | |||
| Yes | 4350 (64.39) | 569 (61.65) | 3781 (64.82) | |
| No | 2406 (35.61) | 354 (38.35) | 2052 (35.18) | |
| CHD (n, %) | < 0.001 | |||
| Yes | 2223 (32.90) | 254 (27.52) | 1969 (33.76) | |
| No | 4533 (67.10) | 669 (72.48) | 3864 (66.24) | |
| CI (n, %) | 0.001 | |||
| Yes | 1221 (18.07) | 131 (14.19) | 1090 (18.69) | |
| No | 5535 (81.93) | 792 (85.81) | 4743 (81.31) | |
| Hyperlipidemia (n, %) | < 0.001 | |||
| Yes | 1026 (15.19) | 83 (8.99) | 943 (16.17) | |
| No | 5730 (84.81) | 840 (91.01) | 4890 (83.83) | |
| Laboratory measurements | ||||
| AST (IU/L) | 20.00 (16.00, 26.00) | 20.34 (15.50, 28.00) | 20.00 (16.00, 25.40) | 0.091 |
| ALT (IU/L) | 18.00 (13.00, 26.00) | 18.00 (12.89, 29.00) | 18.00 (13.00, 26.00) | 0.105 |
| TGs (mmol/L) | 1.42 (1.04, 2.04) | 1.38 (1.00, 1.94) | 1.43 (1.04, 2.06) | 0.009 |
| NLR | 2.98 (2.08, 4.74) | 3.39 (2.31, 6.07) | 2.91 (2.06, 4.56) | < 0.001 |
| LMR | 3.88 (2.59, 5.48) | 3.39 (2.13, 4.77) | 3.97 (2.68, 5.57) | < 0.001 |
| PLR | 124.38 (91.01, 172.37) | 135.79 (96.55, 199.74) | 122.67 (90.29, 168.69) | < 0.001 |
| NPAR | 16.79 (14.63, 19.44) | 18.07 (15.32, 22.12) | 16.62 (14.55, 19.16) | < 0.001 |
| CREA (μmol/L) | 72.00 (57.90, 92.10) | 72.50 (59.15, 94.10) | 72.00 (57.70, 91.70) | 0.084 |
| UA (μmol/L) | 326.25 (260.58, 399.00) | 321.80 (257.35, 402.00) | 326.90 (261.00, 398.80) | 0.463 |
| LDL-C (mmol/L) | 2.49 (1.90, 3.14) | 2.37 (1.87, 2.99) | 2.51 (1.91, 3.17) | < 0.001 |
| HDL-C (mmol/L) | 1.12 (0.93, 1.35) | 1.06 (0.88, 1.29) | 1.13 (0.94, 1.36) | < 0.001 |
| ALB (g/L) | 40.60 (37.50, 43.60) | 39.00 (34.45, 42.30) | 40.80 (37.80, 43.70) | < 0.001 |
| GFR (mL/min) | 83.55 (63.03, 101.95) | 85.87 (64.78, 102.97) | 83.16 (62.91, 101.68) | 0.27 |
| Vital signs | ||||
| SBP (mmHg) | 139.00 (126.00, 154.00) | 136.00 (124.00, 150.00) | 140.00 (127.00, 154.00) | 0.001 |
| DBP (mmHg) | 78.00 (70.00, 85.00) | 77.00 (70.00, 85.00) | 78.00 (70.00, 85.00) | 0.229 |
| Medication administration | ||||
| Nutritional support drug use (n, %) | < 0.001 | |||
| Yes | 1708 (25.28) | 510 (55.25) | 1198 (20.54) | |
| No | 5048 (74.72) | 413 (44.75) | 4635 (79.46) | |
| Antihypertensive drug use (n, %) | 0.097 | |||
| Yes | 4369 (64.67) | 574 (62.19) | 3795 (65.06) | |
| No | 2387 (35.33) | 349 (37.81) | 2038 (34.94) | |
| Antidiabetic drug use (n, %) | 0.004 | |||
| Yes | 5079 (75.18) | 658 (71.29) | 4421 (75.79) | |
| No | 1677 (24.82) | 265 (28.71) | 1412 (24.21) | |
| Statin drug use (n, %) | < 0.001 | |||
| Yes | 3405 (50.40) | 323 (34.99) | 3082 (52.84) | |
| No | 3351 (49.60) | 600 (65.01) | 2751 (47.16) | |
| Antiplatelet and anticoagulant drug use (n, %) | < 0.001 | |||
| Yes | 4076 (60.33) | 436 (47.24) | 3640 (62.40) | |
| No | 2680 (39.67) | 487 (52.76) | 2193 (37.60) | |
| Chinese patent medicine use (n, %) | < 0.001 | |||
| Yes | 5655 (83.70) | 706 (76.49) | 4949 (84.84) | |
| No | 1101 (16.30) | 217 (23.51) | 884 (15.16) | |
| Analgesic drug use (n, %) | < 0.001 | |||
| Yes | 1579 (23.37) | 444 (48.10) | 1135 (19.46) | |
| No | 5177 (76.63) | 479 (51.90) | 4698 (80.54) | |
| Antiosteoporotic drug use (n, %) | 0.728 | |||
| Yes | 887 (13.13) | 125 (13.54) | 762 (13.06) | |
| No | 5869 (86.87) | 798 (86.46) | 5071 (86.94) | |
| Antibiotic drug use (n, %) | < 0.001 | |||
| Yes | 2666 (39.46) | 550 (59.59) | 2116 (36.28) | |
| No | 4090 (60.54) | 373 (40.41) | 3717 (63.72) | |
| Hemostatic agent drug use (n, %) | < 0.001 | |||
| Yes | 544 (8.05) | 157 (17.01) | 387 (6.63) | |
| No | 6212 (91.95) | 766 (82.99) | 5446 (93.37) | |
| Psychotropic drug use (n, %) | < 0.001 | |||
| Yes | 1434 (21.23) | 263 (28.49) | 1171 (20.08) | |
| No | 5322 (78.77) | 660 (71.51) | 4662 (79.92) | |
- Abbreviations: ACCI, age-adjusted Charlson comorbidity index; ALB, albumin; ALT, alanine aminotransferase; AST, aspartate aminotransferase; CHD, coronary heart disease; CI, cerebral infarction; CREA, creatinine; DBP, diastolic blood pressure; eGFR, estimated glomerular filtration rate; HDL-C, high-density lipoprotein cholesterol; LDL-C, low-density lipoprotein cholesterol; LMR, lymphocyte-to-monocyte ratio; LOS, length of stay; NLR, neutrophil-to-lymphocyte ratio; NPAR, neutrophil percentage-to-albumin ratio; PLR, platelet-to-lymphocyte ratio; PSH, past surgical history; SBP, systolic blood pressure; TGs, triglycerides; UA, uric acid; UEMI, urban employee medical insurance; URMI, urban resident medical insurance.
Patients with prolonged LOS were more likely to be male, have a history of smoking and drinking, and be diagnosed with hypertension, CHD, and CI. They also exhibited higher levels of AST, ALT, NLR, PLR, NPAR, and CREA. Conversely, they had lower levels of TGs, LMR, UA, LDL-C, HDL-C, ALB, and GFR. Patients readmitted within 30 days were younger, more likely to be male, had a longer LOS, and were more likely to have UEMI. They also had a higher prevalence of smoking, drinking, and higher ACCI scores. These patients were more frequently diagnosed with CHD, CI, and hyperlipidemia and were more likely to use nutritional support drugs, antidiabetic drugs, statins, antiplatelet and anticoagulant drugs, Chinese patent medicines, analgesics, antibiotics, hemostatic agents, and psychotropic drugs. They exhibited higher levels of NLR, PLR, NPAR, and TGs but lower SBP, TGs, LMR, LDL-C, HDL-C, and ALB.
3.2. Selection of Predictors for Prolonged LOS and 30-Day Readmission
In the univariate analysis, several factors were significantly associated with prolonged LOS, including sex, smoking history, drinking history, hypertension, CHD, CI, PSH, AST, ALT, TGs, NLR, LMR, PLR, NPAR, CREA, UA, LDL-C, HDL-C, ALB, and GFR (p < 0.05). Similarly, factors significantly associated with 30-day readmission included age, sex, LOS, smoking history, drinking history, insurance type, ACCI score, CHD, CI, hyperlipidemia, and the use of various medications (p < 0.05) (Tables 3 and 4).
| Variables | Training set (N = 4729) | Prolonged LOS (N = 1344) | Normal LOS (N = 3385) | p value |
|---|---|---|---|---|
| Basic information | ||||
| Age (year) | 74.00 (69.00, 79.00) | 74.00 (69.00, 80.00) | 73.00 (69.00, 79.00) | 0.190 |
| Sex (n, %) | < 0.001 | |||
| Female | 2635 (55.72) | 675 (50.22) | 1960 (57.90) | |
| Male | 2094 (44.28) | 669 (49.78) | 1425 (42.10) | |
| PSH (n, %) | 0.004 | |||
| Yes | 3149 (66.59) | 937 (69.72) | 2212 (65.35) | |
| No | 1580 (33.41) | 407 (30.28) | 1173 (34.65) | |
| Smoking history (n, %) | 0.001 | |||
| Yes | 1348 (28.50) | 429 (31.92) | 919 (27.15) | |
| No | 3381 (71.50) | 915 (68.08) | 2466 (72.85) | |
| Drinking history (n, %) | 0.043 | |||
| Yes | 1086 (22.96) | 335 (24.93) | 751 (22.19) | |
| No | 3643 (77.04) | 1009 (75.07) | 2634 (77.81) | |
| Diagnosis | ||||
| Hypertension (n, %) | 0.008 | |||
| Yes | 3061 (64.73) | 909 (67.63) | 2152 (63.57) | |
| No | 1668 (35.27) | 435 (32.37) | 1233 (36.43) | |
| CHD (n, %) | 0.022 | |||
| Yes | 1578 (33.37) | 482 (35.86) | 1096 (32.38) | |
| No | 3151 (66.63) | 862 (64.14) | 2289 (67.62) | |
| CI (n, %) | < 0.001 | |||
| Yes | 867 (18.33) | 364 (27.08) | 503 (14.86) | |
| No | 3862 (81.67) | 980 (72.92) | 2882 (85.14) | |
| Hyperlipidemia (n, %) | 0.196 | |||
| Yes | 712 (15.06) | 188 (13.99) | 524 (15.48) | |
| No | 4017 (84.94) | 1156 (86.01) | 2861 (84.52) | |
| Laboratory measurements | ||||
| AST (IU/L) | 20.00 (16.00, 26.00) | 20.00 (16.00, 29.00) | 19.80 (16.00, 25.00) | < 0.001 |
| ALT (IU/L) | 18.00 (12.80, 26.00) | 18.11 (12.65, 29.03) | 17.30 (12.89, 25.00) | 0.001 |
| TGs (mmol/L) | 1.42 (1.04, 2.03) | 1.38 (1.00, 1.94) | 1.43 (1.06, 2.06) | 0.002 |
| NLR | 2.99 (2.09, 4.74) | 3.61 (2.37, 6.23) | 2.81 (2.01, 4.25) | < 0.001 |
| LMR | 3.84 (2.61, 5.44) | 3.27 (2.11, 4.76) | 4.09 (2.81, 5.69) | < 0.001 |
| PLR | 125.26 (91.05, 172.09) | 133.46 (95.11, 191.08) | 122.58 (90.00, 164.86) | < 0.001 |
| NPAR | 16.84 (14.64, 19.45) | 18.88 (15.67, 22.32) | 16.35 (14.33, 18.45) | < 0.001 |
| CREA (μmol/L) | 72.00 (57.90, 92.00) | 75.60 (59.30, 98.53) | 70.90 (57.40, 89.10) | < 0.001 |
| UA (μmol/L) | 326.00 (260.80, 399.27) | 314.50 (252.95, 397.05) | 329.16 (263.66, 400.00) | 0.010 |
| LDL-C (mmol/L) | 2.48 (1.90, 3.15) | 2.36 (1.78, 2.99) | 2.52 (1.95, 3.19) | < 0.001 |
| HDL-C (mmol/L) | 1.13 (0.94, 1.36) | 1.08 (0.88, 1.33) | 1.14 (0.95, 1.37) | < 0.001 |
| ALB (g/L) | 40.40 (37.40, 43.60) | 37.90 (34.18, 41.71) | 41.10 (38.50, 44.08) | < 0.001 |
| GFR (mL/min) | 83.67 (63.14, 102.32) | 81.35 (58.97, 100.29) | 84.54 (64.54, 103.22) | < 0.001 |
| Vital signs | ||||
| SBP (mmHg) | 139.00 (127.00, 154.00) | 139.00 (126.00, 153.00) | 139.00 (127.00, 154.00) | 0.403 |
| DBP (mmHg) | 78.00 (70.00, 85.00) | 78.00 (70.00, 85.00) | 78.00 (70.00, 85.00) | 0.344 |
- Abbreviations: ALB, albumin; ALT, alanine aminotransferase; AST, aspartate aminotransferase; CHD, coronary heart disease; CI, cerebral infarction; CREA, creatinine; DBP, diastolic blood pressure; eGFR, estimated glomerular filtration rate; HDL-C, high-density lipoprotein cholesterol; LDL-C, low-density lipoprotein cholesterol; LMR, lymphocyte-to-monocyte ratio; NLR, neutrophil-to-lymphocyte ratio; NPAR, neutrophil percentage-to-albumin ratio; PLR, platelet-to-lymphocyte ratio; PSH, past surgical history; SBP, systolic blood pressure; TGs, triglycerides; UA, uric acid.
| Variables | Training set (N = 4729) | 30-day readmission (N = 647) | Non-30-day readmission (N = 4082) | p value |
|---|---|---|---|---|
| Basic information | ||||
| Age (year) | 74.00 (69.00, 79.00) | 73.00 (68.00, 78.00) | 74.00 (69.00, 79.00) | 0.009 |
| Sex (n, %) | < 0.001 | |||
| Female | 2635 (55.72) | 276 (42.66) | 2359 (57.79) | |
| Male | 2094 (44.28) | 371 (57.34) | 1723 (42.21) | |
| Insurance type (n, %) | 0.047 | |||
| Full self-pay | 388 (8.20) | 45 (6.96) | 343 (8.40) | |
| UEMI | 3242 (68.56) | 456 (70.48) | 2786 (68.25) | |
| URMI | 871 (18.42) | 127 (19.63) | 744 (18.23) | |
| Other insurance | 228 (4.82) | 19 (2.94) | 209 (5.12) | |
| ACCI score (n, %) | 0.090 | |||
| < 8 | 1238 (26.18) | 187 (28.90) | 1051 (25.75) | |
| ≥ 8 | 3491 (73.82) | 460 (71.10) | 3031 (74.25) | |
| PSH (n, %) | 0.917 | |||
| Yes | 3149 (66.59) | 432 (66.77) | 2717 (66.56) | |
| No | 1580 (33.41) | 215 (33.23) | 1365 (33.44) | |
| Smoking history (n, %) | < 0.001 | |||
| Yes | 1348 (28.50) | 245 (37.87) | 1103 (27.02) | |
| No | 3381 (71.50) | 402 (62.13) | 2979 (72.98) | |
| Drinking history (n, %) | 0.001 | |||
| Yes | 1086 (22.96) | 181 (27.98) | 905 (22.17) | |
| No | 3643 (77.04) | 466 (72.02) | 3177 (77.83) | |
| LOS (day) | 9.00 (7.00, 14.00) | 12.00 (7.00, 21.00) | 9.00 (6.00, 14.00) | < 0.001 |
| Diagnosis | ||||
| Hypertension (n, %) | 0.080 | |||
| Yes | 3061 (64.73) | 399 (61.67) | 2662 (65.21) | |
| No | 1668 (35.27) | 248 (38.33) | 1420 (34.79) | |
| CHD (n, %) | <0.001 | |||
| Yes | 1578 (33.37) | 170 (26.28) | 1408 (34.49) | |
| No | 3151 (66.63) | 477 (73.72) | 2674 (65.51) | |
| CI (n, %) | < 0.001 | |||
| Yes | 867 (18.33) | 85 (13.14) | 782 (19.16) | |
| No | 3862 (81.67) | 562 (86.86) | 3300 (80.84) | |
| Hyperlipidemia (n, %) | < 0.001 | |||
| Yes | 712 (15.06) | 54 (8.35) | 658 (16.12) | |
| No | 4017 (84.94) | 593 (91.65) | 3424 (83.88) | |
| Laboratory measurements | ||||
| AST (IU/L) | 20.00 (16.00, 26.00) | 20.20 (15.55, 28.00) | 19.99 (16.00, 25.49) | 0.095 |
| ALT (IU/L) | 18.00 (12.80, 26.00) | 18.50 (12.95, 29.00) | 17.66 (12.80, 26.00) | 0.057 |
| TGs (mmol/L) | 1.42 (1.04, 2.03) | 1.39 (1.05, 1.95) | 1.43 (1.04, 2.05) | 0.156 |
| NLR | 2.99 (2.09, 4.74) | 3.38 (2.24, 6.00) | 2.92 (2.07, 4.56) | < 0.001 |
| LMR | 3.84 (2.61, 5.44) | 3.40 (2.12, 4.77) | 3.92 (2.66, 5.53) | < 0.001 |
| PLR | 125.26 (91.05, 172.09) | 136.05 (96.45, 200.61) | 123.48 (90.44, 167.70) | < 0.001 |
| NPAR | 16.84 (14.64, 19.45) | 18.11 (15.29, 22.08) | 16.70 (14.55, 19.18) | < 0.001 |
| CREA (μmol/L) | 72.00 (57.90, 92.00) | 72.40 (59.45, 91.50) | 71.75 (57.80, 92.18) | 0.206 |
| UA (μmol/L) | 326.00 (260.80, 399.27) | 318.60 (255.55, 398.25) | 327.00 (261.90, 399.29) | 0.110 |
| LDL-C (mmol/L) | 2.48 (1.90, 3.15) | 2.36 (1.86, 2.99) | 2.49 (1.91, 3.17) | 0.002 |
| HDL-C (mmol/L) | 1.13 (0.94, 1.36) | 1.07 (0.89, 1.29) | 1.13 (0.94, 1.36) | < 0.001 |
| ALB (g/L) | 40.40 (37.40, 43.60) | 38.94 (34.30, 42.30) | 40.67 (37.70, 43.70) | < 0.001 |
| GFR (mL/min) | 83.67 (63.14, 102.32) | 86.42 (66.81, 102.97) | 83.30 (62.89, 102.09) | 0.200 |
| Vital signs | ||||
| SBP (mmHg) | 139.00 (127.00, 154.00) | 136.00 (124.00, 150.00) | 140.00 (127.00, 154.00) | 0.002 |
| DBP (mmHg) | 78.00 (70.00, 85.00) | 77.00 (70.00, 84.00) | 78.00 (70.00, 85.00) | 0.049 |
| Medication administration | ||||
| Nutritional support drug use (n, %) | < 0.001 | |||
| Yes | 1219 (25.78) | 363 (56.11) | 856 (20.97) | |
| No | 3510 (74.22) | 284 (43.89) | 3226 (79.03) | |
| Antihypertensive drug use (n, %) | 0.026 | |||
| Yes | 3049 (64.47) | 392 (60.59) | 2657 (65.09) | |
| No | 1680 (35.53) | 255 (39.41) | 1425 (34.91) | |
| Antidiabetic drug use (n, %) | 0.167 | |||
| Yes | 3546 (74.98) | 471 (72.80) | 3075 (75.33) | |
| No | 1183 (25.02) | 176 (27.20) | 1007 (24.67) | |
| Statin drug use (n, %) | < 0.001 | |||
| Yes | 2357 (49.84) | 224 (34.62) | 2133 (52.25) | |
| No | 2372 (50.16) | 423 (65.38) | 1949 (47.75) | |
| Antiplatelet and anticoagulant drug use (n, %) | < 0.001 | |||
| Yes | 2831 (59.86) | 302 (46.68) | 2529 (61.95) | |
| No | 1898 (40.14) | 345 (53.32) | 1553 (38.05) | |
| Chinese patent medicine use (n, %) | < 0.001 | |||
| Yes | 3969 (83.93) | 493 (76.20) | 3476 (85.15) | |
| No | 760 (16.07) | 154 (23.80) | 606 (14.85) | |
| Analgesic drug use (n, %) | < 0.001 | |||
| Yes | 1134 (23.98) | 307 (47.45) | 827 (20.26) | |
| No | 3595 (76.02) | 340 (52.55) | 3255 (79.74) | |
| Antiosteoporotic drug use (n, %) | 0.819 | |||
| Yes | 620 (13.11) | 83 (12.83) | 537 (13.16) | |
| No | 4109 (86.89) | 564 (87.17) | 3545 (86.84) | |
| Antibiotic drug use (n, %) | < 0.001 | |||
| Yes | 1903 (40.24) | 386 (59.66) | 1517 (37.16) | |
| No | 2826 (59.76) | 261 (40.34) | 2565 (62.84) | |
| Hemostatic agent drug use (n, %) | < 0.001 | |||
| Yes | 395 (8.35) | 112 (17.31) | 283 (6.93) | |
| No | 4334 (91.65) | 535 (82.69) | 3799 (93.07) | |
| Psychotropic drug use (n, %) | < 0.001 | |||
| Yes | 1021 (21.59) | 185 (28.59) | 836 (20.48) | |
| No | 3708 (78.41) | 462 (71.41) | 3246 (79.52) | |
- Abbreviations: ACCI, age-adjusted Charlson comorbidity index; ALB, albumin; ALT, alanine aminotransferase; AST, aspartate aminotransferase; CHD, coronary heart disease; CI, cerebral infarction; CREA, creatinine; DBP, diastolic blood pressure; eGFR, estimated glomerular filtration rate; HDL-C, high-density lipoprotein cholesterol; LDL-C, low-density lipoprotein cholesterol; LMR, lymphocyte-to-monocyte ratio; LOS, length of stay; NLR, neutrophil-to-lymphocyte ratio; NPAR, neutrophil percentage-to-albumin ratio; PLR, platelet-to-lymphocyte ratio; PSH, past surgical history; SBP, systolic blood pressure; TGs, triglycerides; UA, uric acid; UEMI, urban employee medical insurance; URMI, urban resident medical insurance.
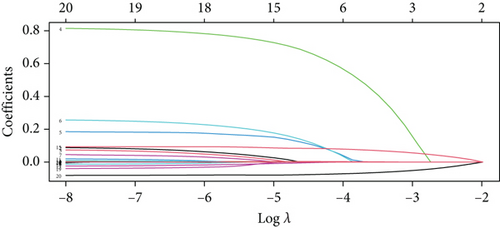
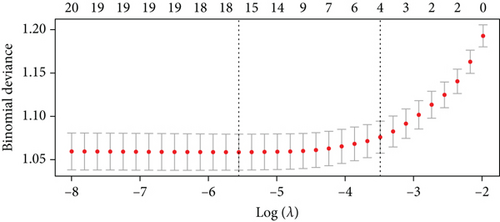
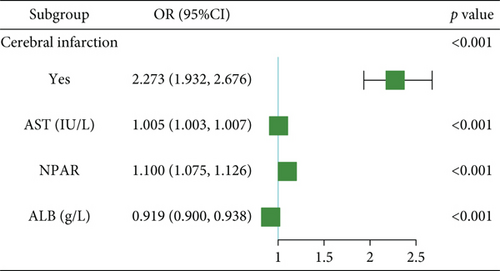
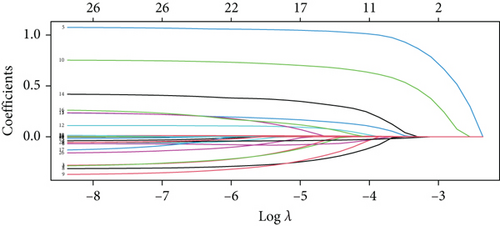
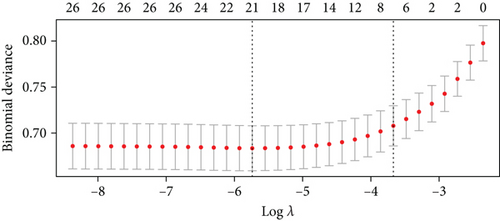
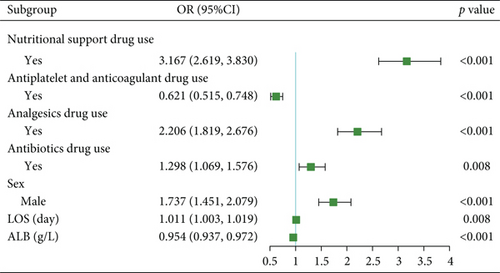
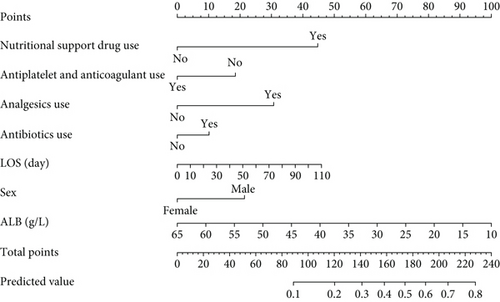
For prolonged LOS, 20 variables were entered into the LASSO regression analysis, and four were identified as significant predictors: CI, AST, NPAR, and ALB (Figure 2a,b). The final multivariate logistic regression model confirmed that CI (OR: 2.273, 95% CI: 1.932–2.676, p < 0.001), AST (OR: 1.005, 95% CI: 1.003–1.007, p < 0.001), NPAR (OR: 1.100, 95% CI: 1.075–1.126, p < 0.001), and ALB (OR: 0.919, 95% CI: 0.900–0.938, p < 0.001) were independent predictors of prolonged LOS (Figure 2c). For 30-day readmission, seven predictors were identified: sex, LOS, nutritional support drug use, antiplatelet and anticoagulant drug use, analgesic drug use, antibiotic drug use, and ALB (Figure 3a,b). The multivariate logistic regression model showed that sex (OR: 1.737, 95% CI: 1.451–2.079, p < 0.001), LOS (OR: 1.011, 95% CI: 1.003–1.019, p < 0.001), nutritional support drug use (OR: 3.167, 95% CI: 2.619–3.830, p < 0.001), antiplatelet and anticoagulant drug use (OR: 0.621, 95% CI: 0.515–0.748, p < 0.001), analgesic drug use (OR: 2.201, 95% CI: 1.819–2.676, p < 0.001), antibiotic drug use (OR: 1.298, 95% CI: 1.069–1.576, p = 0.008), and ALB (OR: 0.954, 95% CI: 0.937–0.972, p < 0.001) were independent predictors of 30-day readmission (Figure 3c).
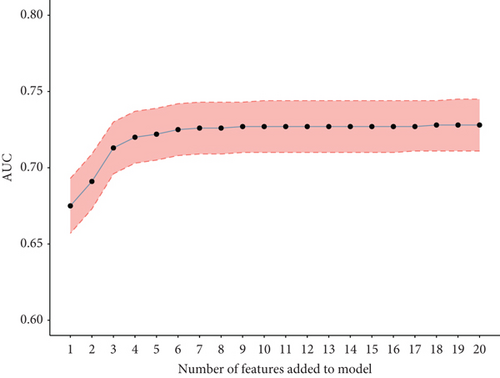
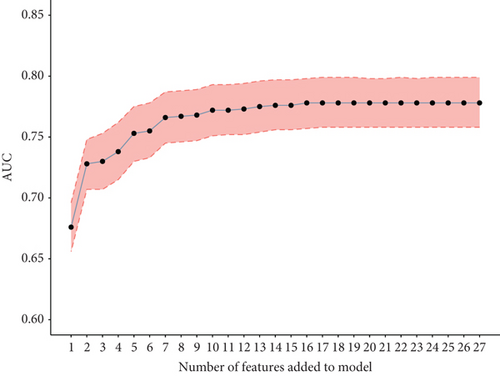
To validate the performance of the LASSO-logistic regression, we evaluated subsets of variables associated with prolonged LOS and 30-day readmission using the top K features. The addition of more variables beyond four for prolonged LOS and seven for 30-day readmission did not significantly improve the AUROC (Figure 4). This suggests that including additional variables, even if closely related to the outcomes, may not enhance the predictive performance of the models (Table S3).
3.3. Development and Validation of the Prolonged LOS Model
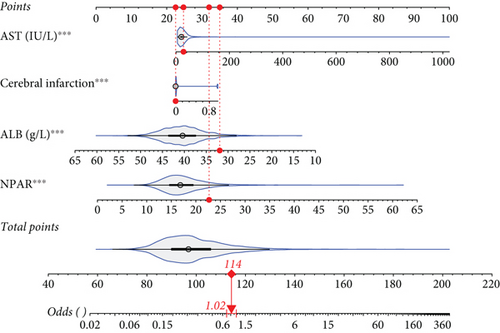
A static nomogram was developed to predict prolonged LOS based on a four-predictor model (Figure 5a). Figure 5b demonstrates how the nomogram can be used to estimate the probability of prolonged LOS for a patient in the training set. The total score, derived from the predictors, provides the predicted probability. Additionally, a dynamic nomogram was created and made available online, allowing clinicians to calculate the probability of prolonged LOS in elderly patients with T2DM (https://cqmuhyx.shinyapps.io/prolonged_los/).

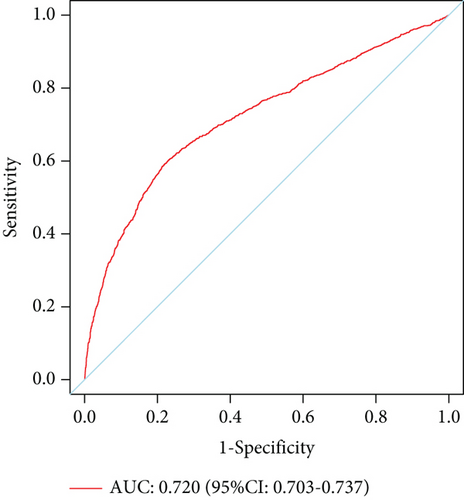
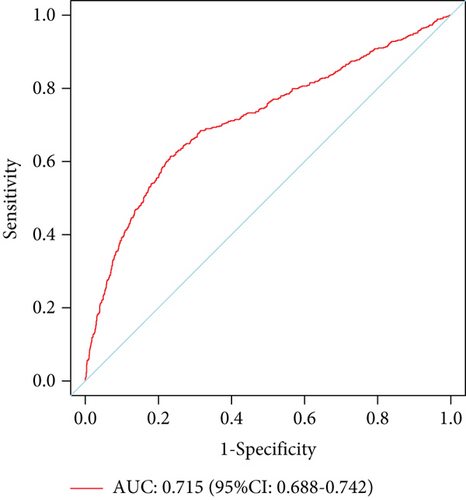
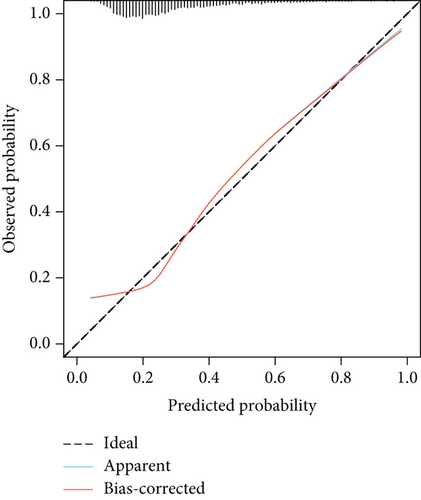
The model showed strong predictive performance, with AUROC values of 0.720 (95% CI: 0.703–0.737) in the training set, 0.715 (95% CI: 0.688–0.742) in the internal validation set, 0.736 (95% CI: 0.696–0.777) in External Validation Set I, and 0.703 (95% CI: 0.645–0.761) in External Validation Set II (Figure 6a,b; Figure S1A, B). The optimal decision probability cutoff was 0.311. Calibration curves indicated strong agreement between predicted and actual probabilities in the training set (Brier score = 0.174, 95% CI: 0.168–0.180), internal validation set (Brier score = 0.172, 95% CI: 0.163–0.182), External Validation Set I (Brier score = 0.123, 95% CI: 0.110–0.136), and External Validation Set II (Brier score = 0.106, 95% CI: 0.090–0.121) (Figure 6c,d; Figure S1C, D). Overall, the nomogram demonstrated excellent discrimination and calibration. Detailed performance metrics for all datasets are provided in Table 5.
| Models | AUC | Sensitivity | Specificity | PPV | NPV | Youden’s index |
|---|---|---|---|---|---|---|
| (95% CI) | (95% CI) | (95% CI) | (95% CI) | (95% CI) | (95% CI) | |
| Training set | 0.720 | 0.592 | 0.780 | 0.517 | 0.828 | 0.372 |
| 0.703–0.737 | 0.566–0.619 | 0.766–0.794 | 0.492–0.542 | 0.815–0.841 | 0.332–0.413 | |
| Internal validation set | 0.715 | 0.615 | 0.767 | 0.500 | 0.840 | 0.382 |
| 0.688–0.742 | 0.574–0.655 | 0.745–0.788 | 0.463–0.537 | 0.820–0.859 | 0.319–0.443 | |
| External Validation Set I | 0.736 | 0.578 | 0.848 | 0.454 | 0.902 | 0.426 |
| 0.696–0.777 | 0.514–0.643 | 0.826–0.870 | 0.396–0.512 | 0.883–0.921 | 0.340–0.513 | |
| External Validation Set II | 0.703 | 0.544 | 0.849 | 0.348 | 0.926 | 0.393 |
| 0.645–0.761 | 0.447–0.640 | 0.823–0.876 | 0.274–0.421 | 0.906–0.947 | 0.270–0.516 |
- Abbreviations: AUROC, area under the receiver operating characteristic curve; CI, confidence interval; NPV, negative predictive value; PPV, positive predictive value.
DCA showed favorable clinical utility. Specifically, when the threshold probability exceeded 12%, using the model to predict prolonged LOS and guide interventions provided greater net benefit than treating all or no patients (Figure S2A). The CIC further confirmed the model’s superior net benefit within the threshold probability range (Figure S2C). DCAs and CICs for the internal and external validation sets are shown in Figure S2B, S1E, F and Figure S2D, S1G, H, respectively.
3.4. Development and Validation of the 30-Day Readmission Model
A nomogram was developed to predict 30-day readmission in elderly patients with T2DM (Figure 7a). Figure 7b illustrates its application for a patient in the training set. A user-friendly web interface (https://cqmuhyx.shinyapps.io/readmission/) was also created to help clinicians calculate the 30-day readmission probability.

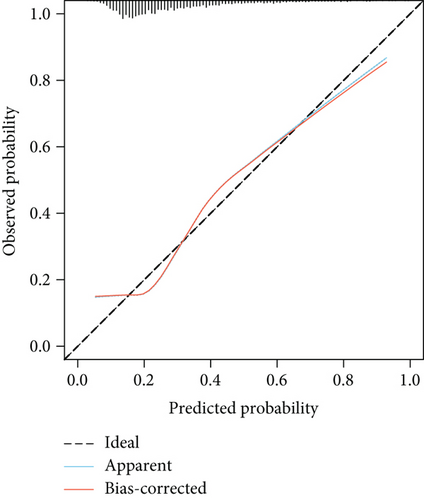
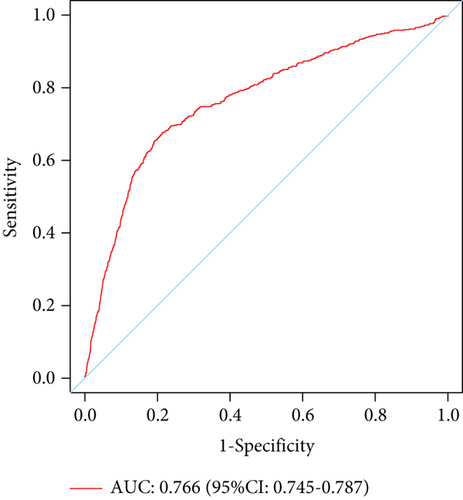
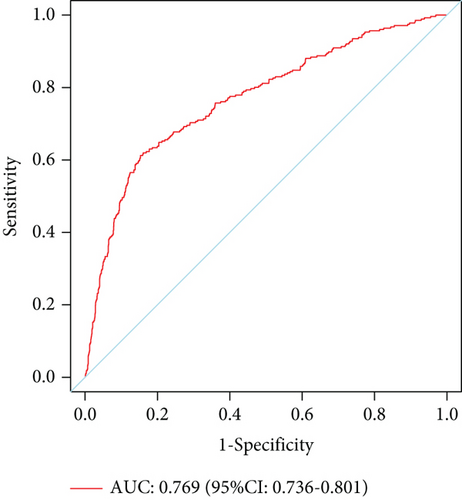
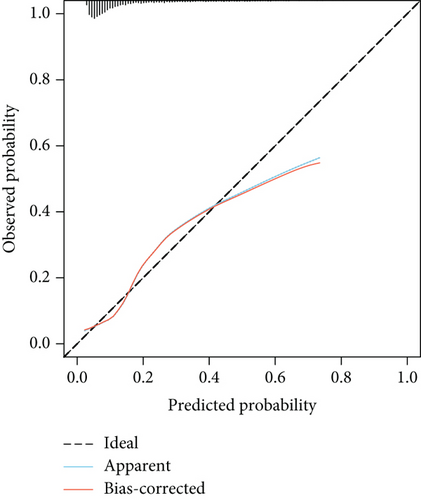
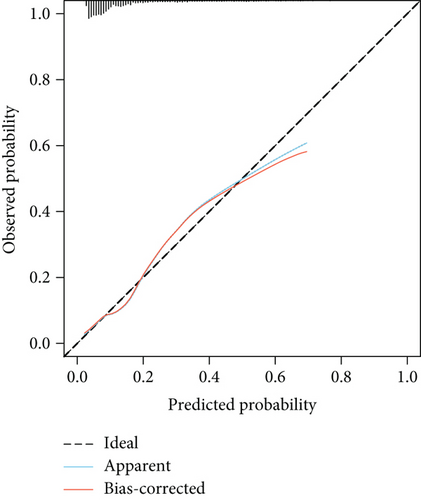
The model demonstrated strong predictive performance, with AUROC values of 0.766 (95% CI: 0.745–0.787) in the training set, 0.769 (95% CI: 0.736–0.801) in the internal validation set, 0.633 (95% CI: 0.594–0.673) in External Validation Set I, and 0.671 (95% CI: 0.613–0.729) in External Validation Set II (Figures 3a,b and 8a,b). The optimal decision probability cutoff was 0.148. Calibration curves for the training set (Brier score = 0.102, 95% CI: 0.096–0.108), internal validation set (Brier score = 0.100, 95% CI: 0.090–0.101), External Validation Set I (Brier score = 0.156, 95% CI: 0.143–0.169), and External Validation Set II (Brier score = 0.093, 95% CI: 0.078–0.109) confirmed the nomogram’s accuracy (Figure 8c,d; Figure S3C, D). Detailed performance metrics are provided in Table 6.
| Models | AUC | Sensitivity | Specificity | PPV | NPV | Youden’s index |
|---|---|---|---|---|---|---|
| (95% CI) | (95% CI) | (95% CI) | (95% CI) | (95% CI) | (95% CI) | |
| Training set | 0.766 | 0.675 | 0.787 | 0.335 | 0.939 | 0.462 |
| 0.745–0.787 | 0.639–0.712 | 0.775–0.800 | 0.309–0.360 | 0.931–0.947 | 0.414–0.512 | |
| Internal validation set | 0.769 | 0.612 | 0.847 | 0.387 | 0.933 | 0.459 |
| 0.736–0.801 | 0.555–0.670 | 0.830–0.864 | 0.341–0.432 | 0.920–0.945 | 0.385–0.534 | |
| External Validation Set I | 0.633 | 0.554 | 0.682 | 0.313 | 0.854 | 0.236 |
| 0.594–0.673 | 0.494–0.615 | 0.652–0.711 | 0.270–0.355 | 0.829–0.879 | 0.146–0.326 | |
| External Validation Set II | 0.671 | 0.548 | 0.741 | 0.218 | 0.926 | 0.289 |
| 0.613–0.729 | 0.447–0.650 | 0.709–0.773 | 0.165–0.271 | 0.906–0.947 | 0.156–0.423 |
- Abbreviations: AUROC, area under the receiver operating characteristic curve; CI, confidence interval; NPV, negative predictive value; PPV, positive predictive value.
DCA (Figure S4A) and CIC (Figure S4C) confirmed the clinical utility of the nomogram. The DCA showed that the nomogram provided greater net benefit when the high-risk threshold probability exceeded 10%. The CIC, applied to a sample size of 1000, demonstrated that the predicted number of 30-day readmissions closely matched the actual number when the threshold probability was above 0.40. DCAs and CICs for the internal and external validation sets are shown in Figure S4B, S3E, F and Figure S4D, S3E, F, respectively.
3.5. Subgroup Analysis by Age
The prolonged LOS and 30-day readmission prediction models demonstrated good discrimination across all age subgroups, with AUROCs exceeding 0.60 in all groups (Table 7). Sensitivity, specificity, NPV, PPV, and Brier scores for each age subgroup are provided in Tables S4–S8. Figures S5–S12 show the ROC curves, calibration curves, decision curves, and CICs for all age subgroups. These results confirm the robustness of the models across different age groups.
| Models | Group 1 (< 75 years) | Group 2 (75~84 years) | Group 3 (> 84 years) |
|---|---|---|---|
| Prolonged LOS | |||
| Training set | 0.706 (0.682–0.731) | 0.738 (0.712–0.764) | 0.714 (0.655–0.774) |
| Internal validation set | 0.718 (0.682–0.755) | 0.702 (0.657–0.746) | 0.725 (0.643–0.806) |
| External Validation Set I | 0.741 (0.689–0.792) | 0.716 (0.640–0.792) | 0.785 (0.658–0.912) |
| External Validation Set II | 0.726 (0.644–0.808) | 0.672 (0.577–0.768) | 0.645 (0.478–0.812) |
| 30-day readmission | |||
| Training set | 0.777 (0.750–0.804) | 0.736 (0.697–0.776) | 0.814 (0.751–0.877) |
| Internal validation set | 0.776 (0.735–0.818) | 0.745 (0.687–0.803) | 0.804 (0.700–0.908) |
| External Validation Set I | 0.623 (0.571–0.674) | 0.658 (0.592–0.723) | 0.611 (0.442–0.780) |
| External Validation Set II | 0.631 (0.535–0.727) | 0.690 (0.611–0.769) | 0.712 (0.516–0.918) |
- Note: Data in parentheses are 95% confidence intervals.
- Abbreviation: LOS, length of stay.
4. Discussion
Using a comprehensive multicenter database, we developed and validated two predictive models to identify prolonged LOS and 30-day readmission in elderly patients with T2DM. The large sample size and diverse hospital network ensure the statistical robustness and broad clinical applicability of our models.
This study focused on predicting outcomes in elderly T2DM patients without distinguishing other comorbidities. The observed prolonged LOS rate of 28.15% and 30-day readmission rate of 13.66% are consistent with previous studies [13, 27]. To enhance clinical utility, we included only commonly used and easily accessible variables collected within 48 h from EMRs. This resulted in fewer variables compared to similar studies, such as Collins et al.’s study [28] with nearly 200 variables and Sherman et al.’s study [29] with 165 variables. In contrast, our study incorporated only 38 clinically relevant and easily obtainable variables. Despite this, the models demonstrated good discriminative ability, with AUROC values of 0.720 (95% CI: 0.703–0.737) for prolonged LOS and 0.766 (95% CI: 0.745–0.787) for 30-day readmission.
Our findings identified CI (OR: 2.273, 95% CI: 1.932–2.676, p < 0.001) as an independent risk factor for prolonged LOS in elderly T2DM patients. Epidemiological studies have shown that T2DM is associated with a two- to fivefold increased risk of ischemic cerebrovascular disease, particularly CI [30–32]. A longitudinal study also linked T2DM to a higher risk of CI, which contributes to prolonged LOS [33]. NPAR has emerged as a novel inflammatory biomarker and has been investigated as an independent prognostic marker in various clinical settings, including N-methyl-D-aspartate receptor encephalitis [34], malignant tumors [35], and other diseases [36]. Our study further supports the prognostic value of NPAR, demonstrating that it is a significant risk factor for prolonged LOS in elderly patients with T2DM (OR: 1.100, 95% CI: 1.075–1.126, p < 0.001). NPAR is simple, cost-effective, and easily accessible, making it a valuable tool for clinicians, especially when neutrophil percentage and ALB levels are within normal ranges. AST (OR: 1.005, 95% CI: 1.003–1.007, p < 0.001) was also identified as a risk factor, as elevated AST levels often indicate cellular damage due to reduced blood supply or oxygenation [37].
For 30-day readmission, the use of nutritional support drugs, analgesics, and antibiotics was significantly associated with higher readmission rates, reflecting overall disease burden. A local study found that the number of medications was a predictive factor for readmission [38], and medication nonadherence due to side effects may further explain this association [39]. Interestingly, antiplatelet and anticoagulant drug use was negatively correlated with 30-day readmission (OR: 0.621, 95% CI: 0.515–0.748, p < 0.001), likely because these drugs help prevent cardiovascular events [40], a common cause of readmission in T2DM patients [41].
Consistent with previous studies by Collins et al. [28] and Regassa and Tola [42], we found that male sex was a significant risk factor for 30-day readmission, with males having 1.74 times higher odds (95% CI: 1.45–2.08) compared to females. Additionally, longer LOS was associated with a higher risk of 30-day readmission (OR: 1.011, 95% CI: 1.003–1.019, p < 0.001). LOS reflects disease severity, and prolonged hospitalization increases the risk of hospital-acquired infections, further elevating readmission risk [27, 43].
Interestingly, ALB was the only factor significantly associated with both prolonged LOS (OR: 0.919, 95% CI: 0.900–0.938, p < 0.001) and 30-day readmission (OR: 0.954, 95% CI: 0.937–0.972, p < 0.001). Low ALB levels can result from decreased synthesis, increased catabolism, heightened vascular permeability, or renal loss. Malnutrition and inflammation are the primary drivers of hypoalbuminemia [44–46]. ALB plays a multifaceted role in health and disease, serving as a marker of nutritional status and a regulator of inflammation, oxidative stress, and endothelial function. Low ALB levels often indicate systemic inflammation and chronic disease severity, which are linked to prolonged hospitalization and higher readmission rates [47–49]. For instance, hypoalbuminemia is associated with impaired immune response, delayed wound healing, and increased infection risk, all of which can extend hospital stays and raise readmission likelihood [50, 51].
The normal reference range for ALB in adults is typically 3.5–5.0 g/dL. A cohort study found that patients with higher ALB levels had a lower risk of death and readmission (HR: 0.78, p < 0.001) [52]. Another study showed that higher ALB levels were associated with a reduced risk of microvascular complications in diabetes patients [53]. Specifically, for every 10 g/L increase in ALB, the HRs for diabetic nephropathy, ophthalmopathy, and neuropathy were 0.42 (95% CI: 0.30–0.58), 0.61 (95% CI: 0.52–0.72), and 0.67 (95% CI: 0.51–0.88), respectively. These findings highlight ALB’s importance as a biomarker for both short- and long-term outcomes in diabetes. This partly explains ALB’s influence on prolonged LOS and 30-day readmission. Therefore, ALB should be included in routine admission tests for elderly T2DM patients. If ALB levels are below normal, appropriate interventions, such as nutritional support or anti-inflammatory therapies, should be considered. Future studies should investigate whether improving ALB levels can reduce prolonged hospitalization and readmission risks in this population.
In addition to the findings of our study, the potential role of SGLT2 inhibitors in preventing adverse events, such as frailty, in older adults with diabetes warrants further discussion. Recent studies have demonstrated that SGLT2 inhibitors, such as empagliflozin, not only improve glycemic control but also offer significant benefits in reducing the risk of cardiovascular events, slowing the progression of chronic kidney disease, and potentially mitigating cognitive and physical decline in frail older adults [54–56]. These findings highlight the functional and clinical importance of SGLT2 inhibitors in this vulnerable population, particularly in the context of multimorbidity and polypharmacy [57–60]. Future research should explore the optimal use of SGLT2 inhibitors in older adults with diabetes, taking into account their level of frailty and comorbidities.
This study has two main strengths: first, the use of a large, multicenter dataset to develop the predictive models; second, the inclusion of simple, easily obtainable variables, which enhances the models’ generalizability and clinical applicability. However, limitations must be acknowledged. First, the retrospective design provides weaker evidence compared to prospective studies, so findings should be interpreted cautiously. Second, some potential predictors were excluded due to high rates of missing data, which may have affected the models’ predictive performance. Future prospective studies with more comprehensive data and larger sample sizes are needed to validate or refine these findings.
5. Conclusion
Two predictive models were developed to assess prolonged LOS and 30-day readmission in elderly T2DM patients. Both models demonstrated strong performance, with AUROC values of 0.720 for prolonged LOS and 0.766 for 30-day readmission. The inclusion of inexpensive and readily available variables, such as demographic characteristics, comorbidities, and routine laboratory results, enhances the models’ feasibility for clinical use. These models offer valuable tools for identifying high-risk patients and guiding targeted interventions to improve outcomes.
Ethics Statement
The research protocol received approval from the ethics committee of the Chongqing Medical University (Approval No. 2024097), the ethics committee of the Affiliated Banan Hospital of Chongqing Medical University (Approval No. BNLLKY2023037), and the ethics committee of the First Affiliated Hospital of Zhejiang University School of Medicine (Approval No. IIT20230312B-R1). Written informed consent for participation was not required for this study due to its retrospective design, and the study was undertaken in accordance with national legislation and institutional requirements.
Conflicts of Interest
The authors declare no conflicts of interest.
Author Contributions
J.T. and Y.L. designed the research. J.T., Y.H., and Z.Z. collected and organized the data. J.T., J.L., J.D., and W.Z. analyzed the data. J.T. drafted the manuscript, and Y.L. contributed to the critical revision of the manuscript. All authors contributed to the manuscript and approved the submitted version.
Funding
This study was funded by projects of the Chongqing Medical Scientific Research Project (Joint Project of Chongqing Health Commission and Science and Technology Bureau) (2024QNXM017), the Scientific and Technological Research Program of Chongqing Municipal Education Commission (KJQN202300454), and the Banan District Science and Technology Bureau of Chongqing Municipality (BNWJ202300106).
Acknowledgments
We would like to thank all the participants of this project and the investigators for collecting the data.
Open Research
Data Availability Statement
The datasets used for this study are available on request to the corresponding author.


