Molecular and Cellular Insights Into Retinoblastoma: Pathways, Immune Landscape, and Therapeutic Opportunities
Abstract
Background: Retinoblastoma (RB) is the most common primary intraocular malignancy in children, primarily caused by inactivation of the RB1 tumor suppressor gene. Despite advancements in multimodal therapies, the molecular mechanisms underlying RB progression and its tumor microenvironment (TME) remain poorly understood, limiting the development of effective targeted treatments.
Methods: This study integrates bulk and single-cell RNA sequencing data to characterize the molecular landscape of RB. Differential gene expression analysis, pathway enrichment analysis, and single-sample gene set enrichment analysis (ssGSEA) were performed to uncover key pathways and immune cell populations. Immune checkpoint molecules, m6A RNA modification-related genes, and ferroptosis-associated genes were analyzed to identify potential therapeutic targets. Protein-protein interaction (PPI) networks and cell-cell communication analyses were conducted to explore intercellular signaling within the TME. Additionally, functional validation was performed for CDKN1A, a candidate gene identified from transcriptomic analysis, using shRNA-mediated knockdown and in vitro assays.
Results: Transcriptomic profiling revealed distinct gene expression signatures between RB and normal retinal tissues, including upregulation of oncogenic pathways (e.g., MYC targets and G2/M checkpoint regulation) and downregulation of tumor suppressor pathways (e.g., p53 signaling). Chemotherapy-induced gene expression changes were observed, notably the activation of immune-related pathways such as antigen presentation and NK cell-mediated cytotoxicity. Immune checkpoint molecules (PDCD1, CD274, HAVCR2) exhibited cell-type-specific expression, indicating potential for immunotherapy. Elevated expression of m6A regulators (METTL3, WTAP) and ferroptosis-associated genes (ACSL4, SLC7A11) pointed to novel therapeutic vulnerabilities. Among key regulatory genes, CDKN1A was identified as significantly downregulated in RB. Functional experiments demonstrated that knockdown of CDKN1A inhibited cell proliferation and induced G1 phase arrest in RB cell lines, supporting its potential tumor-promoting role in this context.
Conclusion: This study provides a comprehensive molecular and cellular overview of RB progression and reveals novel therapeutic targets, including immune checkpoints, m6A modification enzymes, ferroptosis regulators, and CDKN1A. Our findings emphasize the need to address tumor heterogeneity and cell-type-specific gene expression in designing effective personalized therapies for RB patients.
1. Introduction
Retinoblastoma (RB) is the most common primary intraocular malignancy in children, accounting for approximately 3% of all pediatric cancers [1]. This rare but aggressive tumor originates in the retina, arising from immature retinal cells due to biallelic inactivation of the RB1 gene, a tumor suppressor located on chromosome 13q14 [2]. While most cases are sporadic, approximately 40% are hereditary, often associated with germline mutations in the RB1 gene, predisposing patients to bilateral tumors and secondary malignancies [3]. Clinically, RB is characterized by leukocoria (a white pupillary reflex) and strabismus, which are often the initial signs prompting medical attention [4]. Early diagnosis and treatment are critical for preserving vision, preventing metastasis, and ensuring survival. Advances in multimodal therapies, including systemic chemotherapy, local treatments such as laser photocoagulation and cryotherapy, and enucleation for advanced cases, have significantly improved survival rates in high-resource settings [5]. However, challenges remain in low- and middle-income countries, where delayed diagnosis and limited access to treatment contribute to poorer outcomes [6]. From a molecular perspective, the RB1 gene plays a crucial role in regulating the cell cycle by inhibiting the transition from G1 to S phase [7]. Loss of RB1 function leads to uncontrolled cellular proliferation, which is central to the pathogenesis of RB [8].
Chemotherapy plays a central role in the management of RB, particularly in cases where vision preservation is a priority or when the disease extends beyond the eye [9]. Systemic chemotherapy, often referred to as chemoreduction, is commonly used to shrink intraocular tumors, facilitating localized treatments such as laser photocoagulation, cryotherapy, or brachytherapy [10]. The most widely used regimens include combinations of vincristine, etoposide, and carboplatin (VEC), which have demonstrated high efficacy in reducing tumor size and preventing disease progression [11]. For advanced or recurrent cases, alternative approaches such as intra-arterial chemotherapy (IAC) and intravitreal chemotherapy (IViC) have emerged as effective strategies [12]. IAC, which involves direct delivery of chemotherapeutic agents like melphalan or topotecan into the ophthalmic artery, allows for higher local drug concentrations while minimizing systemic toxicity [13]. IViC, used primarily for vitreous seeding, provides targeted treatment to eliminate tumor cells within the vitreous humor and has shown promising results in reducing the risk of recurrence [14].
In recent years, there has been growing interest in exploring the potential of immunotherapy for RB, leveraging the immune system to target and eliminate tumor cells [15]. Despite the immune-privileged status of the eye, which limits systemic immune responses to intraocular tumors, the tumor microenvironment (TME) in RB demonstrates immunological features that could be exploited for therapeutic purposes [16]. Studies have revealed the presence of immune cells, such as tumor-associated macrophages (TAMs), regulatory T cells (Tregs), and myeloid-derived suppressor cells (MDSCs), within the RB microenvironment, which often contribute to an immunosuppressive milieu and tumor progression [17]. Checkpoint inhibitors, such as antibodies targeting programmed death-1 (PD-1) or PD-ligand 1 (PD-L1), have shown success in other cancers and are being investigated for their applicability in RB [18]. Elevated PD-L1 expression has been detected in RB tissues, suggesting that immune evasion mechanisms may play a role in tumor survival and highlighting a potential target for immunotherapy [19]. Furthermore, preclinical models are being developed to study the effects of checkpoint blockade in RB and assess its feasibility [20]. Adoptive cell therapy, including chimeric antigen receptor (CAR) T-cell therapy, also holds promise. RB cells express unique surface antigens, such as gangliosides (e.g., GD2), which could serve as potential targets for engineered T cells [21]. Early studies in other pediatric solid tumors suggest that CAR T-cell therapy could be adapted to address RB with further refinement [22]. Additionally, tumor vaccines and oncolytic viruses represent innovative strategies that could stimulate anti-tumor immunity in RB. For instance, vaccines designed to target specific RB-associated antigens could activate cytotoxic T lymphocytes to recognize and eliminate tumor cells [23]. Oncolytic viruses, which selectively infect and lyse tumor cells while enhancing local immune activation, have shown potential in preclinical settings for ocular tumors [24]. Despite these advances, significant challenges remain in translating immunotherapy to RB treatment. The immune-privileged nature of the eye, potential off-target effects, and the unique biology of RB necessitate careful consideration in therapy design [25]. Ongoing research to better characterize the immunogenicity of RB, combined with technological advancements in immunotherapy, may pave the way for novel, effective treatments that improve outcomes for RB patients while preserving vision.
2. Methods
2.1. Data Acquisition
Gene expression data and associated metadata were retrieved from the Gene Expression Omnibus (GEO) database, a publicly accessible repository hosted by the National Center for Biotechnology Information (NCBI). The search was conducted using relevant keywords, including “RB,” “RNA-seq,” and “microarray,” and further refined by selecting datasets with complete clinical and experimental information. Specific datasets were identified using their GEO accession numbers (GSE24673). Data were downloaded using the GEOquery package in R, which facilitates automated access to GEO. Raw data files, such as CEL files for microarray data or FASTQ files for RNA sequencing data, were downloaded when available. For microarray datasets, raw intensity files were preprocessed and normalized using the Robust Multiarray Average (RMA) algorithm. For RNA-seq data, processed expression matrices or raw count data were utilized when available. In cases where raw sequencing data was provided, alignment to the reference genome (e.g., GRCh38) and quantification of gene expression levels were performed using appropriate tools such as STAR for alignment and featureCounts for quantification. Metadata, including sample characteristics, experimental conditions, and clinical annotations, were extracted and curated for downstream analysis. Only datasets with clear annotations and sufficient sample sizes were included.
2.2. Differential Expression Analysis
Differential gene expression analysis was performed to identify genes with significant changes in expression between the experimental and control groups. Raw count data obtained from RNA sequencing were preprocessed and normalized using the DESeq2 package in R. Initial quality control was conducted to assess sequencing depth, sample-to-sample distances, and the presence of outliers. Genes with low expression levels, defined as those with fewer than 10 counts across all samples, were filtered out to reduce noise. Normalized count data were used to calculate fold changes (log2FC) and associated p values for each gene. The Benjamini–Hochberg method was applied to adjust p values for multiple testing, controlling the false discovery rate (FDR). Genes with an adjusted p value < 0.05 and |log2FC| ≥ 1 were considered significantly differentially expressed. For microarray data, differential analysis was conducted using the limma package in R. Raw intensity values were normalized using the RMA method, followed by linear modeling and empirical Bayes moderation to calculate differential expression statistics. Similar thresholds for significance (adjusted p value < 0.05 and |log2FC| ≥ 1) were applied. Volcano plots and heatmaps were generated to visualize the distribution of differentially expressed genes (DEGs). Pathway enrichment analysis was conducted using the Gene Ontology (GO) and Kyoto Encyclopedia of Genes and Genomes (KEGG) databases to identify biological processes and pathways associated with the DEGs.
2.3. Pathway Enrichment Analysis
To explore the biological significance of the DEGs, pathway enrichment analysis was performed using multiple bioinformatics tools and databases. GO analysis was conducted to identify enriched biological processes, cellular components, and molecular functions. KEGG pathway analysis was performed to uncover key signaling pathways associated with the DEGs. The gene set enrichment analysis (GSEA) tool was used to evaluate whether predefined gene sets, such as hallmark pathways or curated functional gene sets, showed significant enrichment in specific conditions. Enrichment scores and normalized enrichment scores (NES) were calculated, and statistical significance was determined using permutation tests with a p value < 0.05 and a FDR < 0.25 as thresholds. For GO and KEGG pathway analysis, the clusterProfiler package in R was utilized. DEGs were annotated with their corresponding Entrez Gene IDs or official gene symbols, and enrichment was assessed using hypergeometric testing. Pathways or GO terms with an adjusted p value < 0.05 were considered significantly enriched. Results were visualized using bar plots, dot plots, and enrichment maps to provide a comprehensive overview of the enriched pathways.
2.4. Protein-Protein Interaction (PPI) Network Analysis
Additionally, PPI networks were constructed using the STRING database to identify key hub genes and their interactions within enriched pathways. Cytoscape software was used to visualize the PPI network, and hub genes were identified using topological analysis methods such as degree centrality.
2.5. Immune Infiltration Analysis Using ssGSEA
Single-sample GSEA (ssGSEA) was employed to estimate the relative abundance of immune cell populations in RB tumor samples. The analysis was performed using the gene set variation analysis (GSVA) package in R. Gene expression profiles were normalized and input into the ssGSEA algorithm, which computes an enrichment score for each sample and immune cell type based on predefined immune-related gene sets. Immune cell-specific gene sets were derived from the published signatures, such as the CIBERSORT or LM22 gene sets, representing various immune cell populations, including T cells, B cells, macrophages, natural killer (NK) cells, and dendritic cells. The ssGSEA method calculated enrichment scores for each immune cell type in individual samples, providing a quantitative measure of immune infiltration. To compare immune infiltration between different groups, enrichment scores were statistically analyzed using the Wilcoxon rank-sum test or Kruskal–Wallis test, depending on the number of groups. Correlation analysis was performed to examine the association between immune infiltration levels and clinical or molecular features. Results were visualized using boxplots, heatmaps, and correlation matrices.
2.6. Single-Cell RNA Sequencing (scRNA-seq) Analysis
scRNA-seq data were processed and analyzed to investigate the cellular heterogeneity and transcriptional landscapes of RB tumors. Raw sequencing data in FASTQ format were aligned to the human reference genome (e.g., GRCh38) using the Cell Ranger software (10x Genomics). Quality control was performed to filter out low-quality cells based on parameters such as mitochondrial gene expression (> 20%), unique molecular identifier (UMI) counts, and the number of detected genes per cell. The filtered gene expression matrix was imported into the Seurat package in R for downstream analysis. Data normalization and scaling were performed using the LogNormalize method, and variable features were identified for dimensionality reduction. Principal component analysis (PCA) was applied to identify the most significant components, and clustering was performed using a graph-based clustering algorithm. The clusters were visualized using Uniform Manifold Approximation and Projection (UMAP) or t-Distributed Stochastic Neighbor Embedding (t-SNE) for dimensionality reduction. Cell-type annotation was conducted based on canonical marker genes and verified using CellMarker. Differential gene expression analysis between clusters or conditions was performed using the Wilcoxon rank-sum test, and significantly enriched genes were identified based on adjusted p values (< 0.05).
2.7. Cell Culture
To validate transcriptomic findings and perform downstream functional assays, human RB cell lines Y79 and WERI-Rb1 were utilized. Cell lines were obtained from the American Type Culture Collection. Cells were cultured in RPMI-1640 medium supplemented with 10% fetal bovine serum, 100 U/mL penicillin, and 100 μg/mL streptomycin. Cultures were maintained in a humidified incubator at 37°C with 5% CO2. Cells were routinely passaged at 70%–80% confluency using gentle pipetting to minimize cell clumping and maintain viability.
2.8. Short Hairpin RNA (shRNA) Construction and Transfection
shRNAs targeting the coding sequence of the target gene were designed using the RNAi Consortium shRNA design tool to ensure effective gene knockdown and minimal off-target effects. High-scoring shRNA sequences were synthesized and cloned into the pLKO.1-puro lentiviral vector. Briefly, complementary oligonucleotides with AgeI and EcoRI overhangs were annealed and ligated into AgeI/EcoRI-digested pLKO.1 vector using T4 DNA ligase. The ligation products were transformed into Escherichia coli DH5α competent cells and selected on LB agar plates containing 100 μg/mL ampicillin. Positive colonies were screened by colony PCR and confirmed by Sanger sequencing to verify the correct insertion of shRNA sequences. For lentivirus production, HEK293T cells were co-transfected with the pLKO.1-shRNA plasmid, packaging plasmid psPAX2, and envelope plasmid pMD2.G using Lipofectamine 3000, according to the manufacturer’s instructions. Viral supernatants were collected 48–72 h post-transfection, filtered through a 0.45 μm syringe filter, and used to infect RB cell lines in the presence of 8 μg/mL polybrene. Successfully transduced cells were selected with 2 μg/mL puromycin for 3–5 days before downstream assays.
2.9. Quantitative Real-Time PCR (qPCR)
Total RNA was extracted from cells using TRIzol reagent, and 1 μg of RNA was reverse-transcribed into cDNA using the PrimeScript RT reagent kit with gDNA Eraser following the manufacturer’s protocol. qPCR was carried out using SYBR Premix Ex TaqII on a QuantStudio 6 Flex Real-Time PCR System. Gene-specific primers were designed using Primer-BLAST and synthesized by Sangon Biotech. GAPDH was used as the internal control for normalization. Relative mRNA expression levels were calculated using the 2−ΔΔCt method. Each sample was run in triplicate, and data were presented as mean ± standard deviation (SD) from at least three independent experiments.
2.10. Cell Cycle Analysis
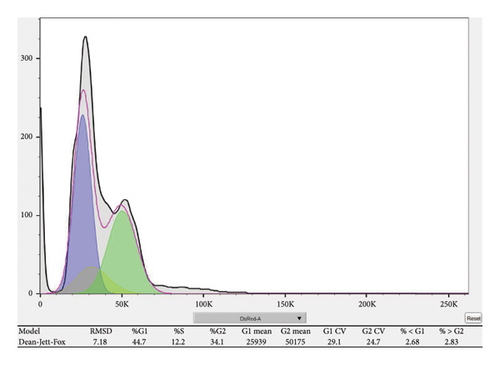
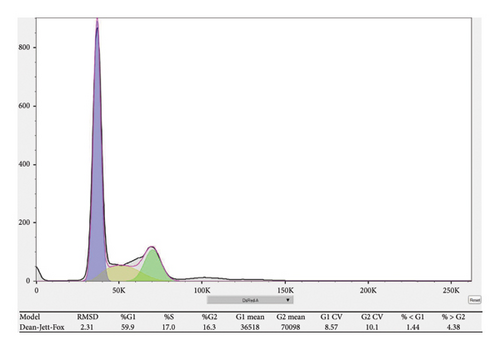
Cell cycle distribution was assessed using propidium iodide (PI) staining followed by flow cytometry. RB cells were collected 48 h after transfection or treatment. Cells were washed twice with cold phosphate-buffered saline (PBS), fixed in 70% ethanol at 4°C overnight, and subsequently stored at −20°C until analysis. Prior to staining, fixed cells were washed with PBS to remove residual ethanol and resuspended in 500 μL PI staining solution containing 50 μg/mL PI, 100 μg/mL RNase A, and 0.1% Triton X-100 in PBS. Cells were incubated at 37°C for 30 min in the dark. Stained cells were analyzed using a flow cytometer, and at least 10,000 events per sample were recorded. Cell cycle distribution (G0/G1, S, and G2/M phases) was determined using FlowJo software (v10.0) with the Watson (Pragmatic) model for cell cycle analysis.
2.11. MTT Assay
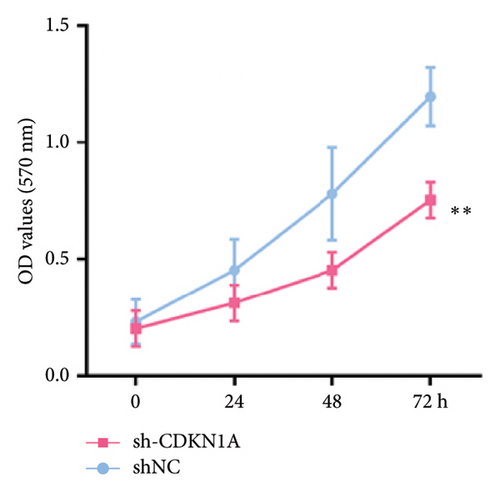
The MTT assay was performed to assess cell viability and proliferation following gene knockdown. RB cell lines were seeded into 96-well plates at a density of 5 × 10³ cells per well in 100 μL of complete culture medium. After 24 h of incubation, cells were treated or transduced as indicated, and viability was measured at 24, 48, and 72 h post-treatment. At each time point, 10 μL of MTT solution was added to each well and incubated at 37°C for 4 h. Following incubation, the medium was carefully removed, and 100 μL of dimethyl sulfoxide was added to each well to dissolve the formazan crystals. The absorbance at 570 nm was measured using a microplate reader. All experiments were performed in triplicate, and results were expressed as mean ± SD (SD). Cell viability was normalized to control groups and plotted over time to assess proliferation dynamics.
3. Results
3.1. Differential Gene Expression and Pathway Enrichment Analysis in RB
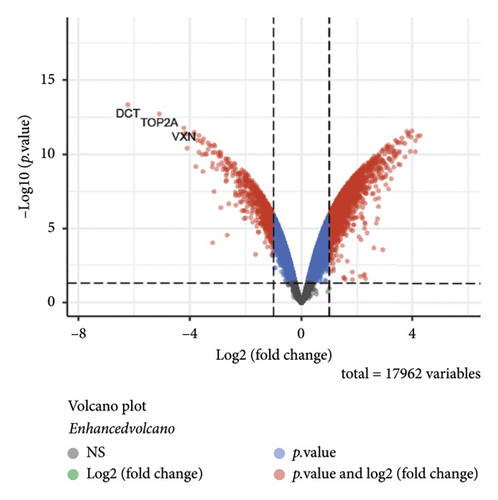
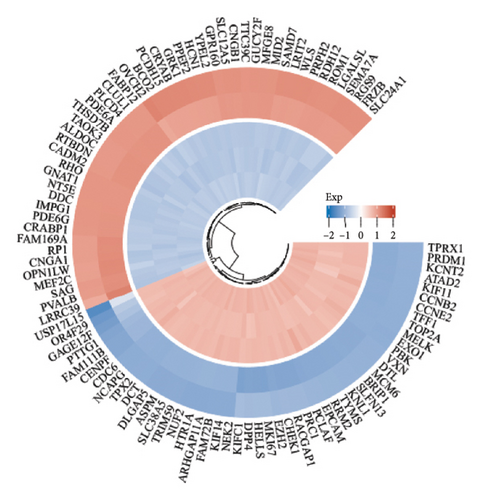
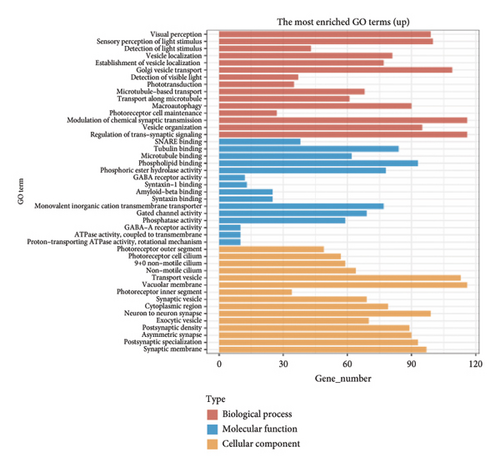
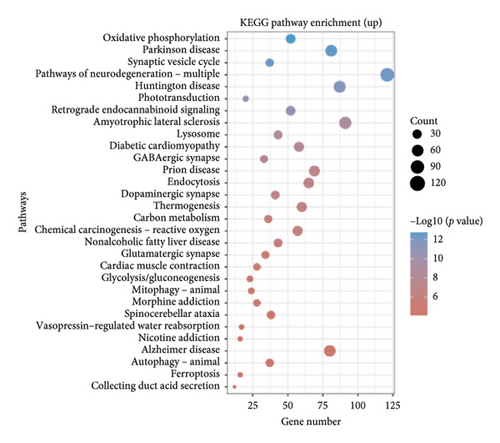
The dataset titled “Expression of PRAME in RB primary tumors” (GSE24673) provides a comprehensive transcriptome analysis of partially degraded and fragmented RNA samples derived from RB primary tumors. This study aimed to identify global gene expression changes in RB compared to normal retinal tissues, facilitating high-throughput biomarker discovery for early disease detection. The dataset includes gene expression profiles from RB primary tumors with or without the chemotherapy, each processed in triplicates, normalized against RNA from healthy adult retinas collected from cadaveric eyes. Figure 1(a) illustrates the volcano plot of DEGs between RB samples and normal retinal tissues. A total of 17,962 genes were analyzed, among which significantly upregulated (log2FC > 1, adjusted p value < 0.05) and downregulated (log2FC < −1, adjusted p value < 0.05) genes are highlighted in red and blue, respectively. Key upregulated genes, such as TOP2A and DCT, and downregulated genes, such as VXN, are labeled, emphasizing their potential roles in RB progression. Figure 1(b) presents a circular heatmap showing the expression levels of the top DEGs across all samples. The red and blue gradients indicate high and low expression, respectively. Clustering analysis highlights distinct gene expression patterns between RB and normal retinal tissues, with notable upregulation of oncogenic genes like TOP2A in RB samples. GO enrichment analysis of upregulated genes is shown in Figure 1(c), revealing significant enrichment in biological processes such as “cell cycle regulation,” “phosphorylation activity,” and “mitotic spindle organization.” These findings underscore the active proliferation and signaling pathways contributing to RB pathogenesis. Pathway enrichment analysis using the KEGG database, shown in Figure 1(d), identified key upregulated pathways, including “oxidative phosphorylation,” “cell cycle,” and “DNA replication.” These pathways reflect the enhanced metabolic and proliferative activities in RB tumors. For downregulated genes, GO analysis highlighted processes such as “chromosome condensation,” “centrosome organization,” and “nucleosome assembly” (Figure 1(e)), indicating disruption of normal retinal function. Additionally, KEGG pathway analysis revealed suppression of critical pathways, including “p53 signaling,” “homologous recombination,” and “antigen processing and presentation,” which may contribute to impaired DNA repair and immune evasion in RB.
3.2. Differential Gene Expression and Pathway Enrichment Analysis Between Chemotherapy-Treated and Nontreated RB Patients
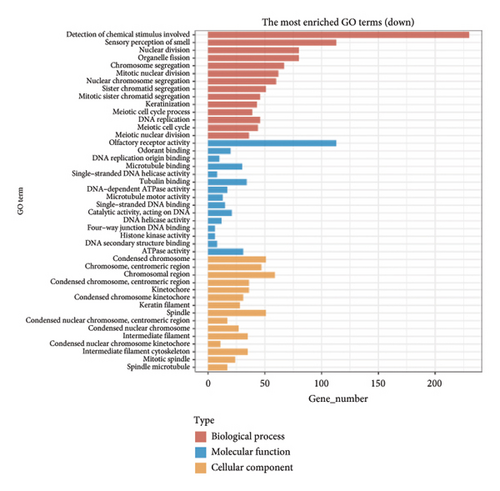
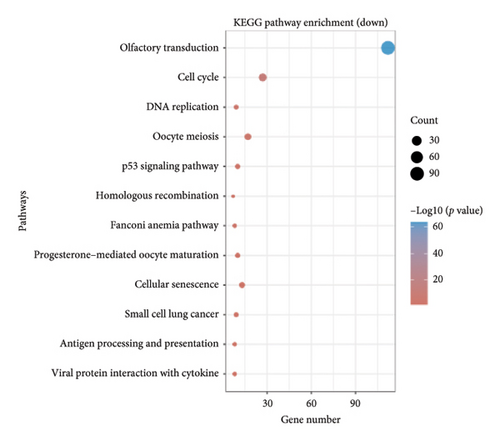
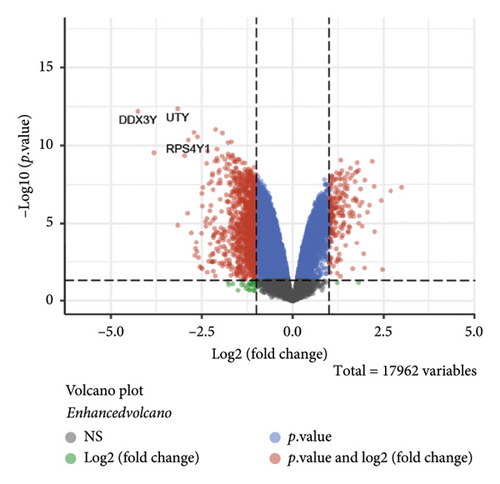
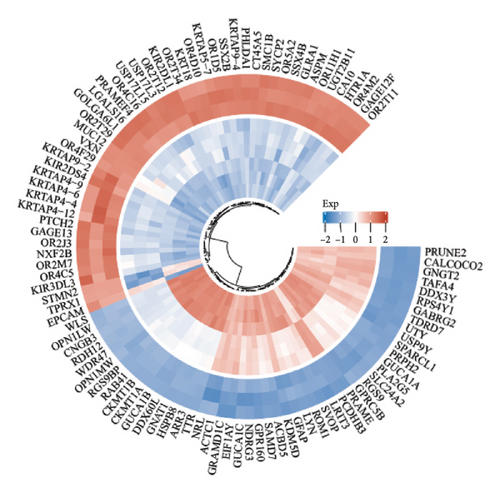
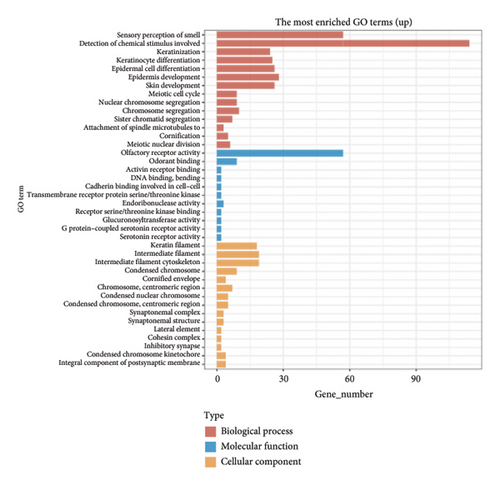
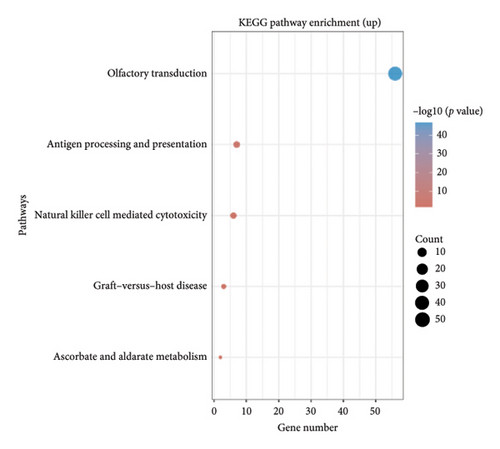
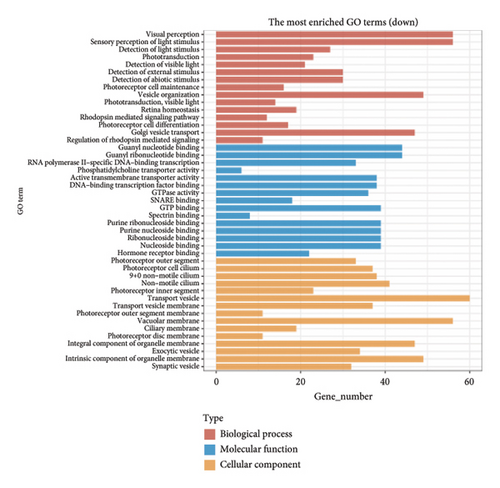
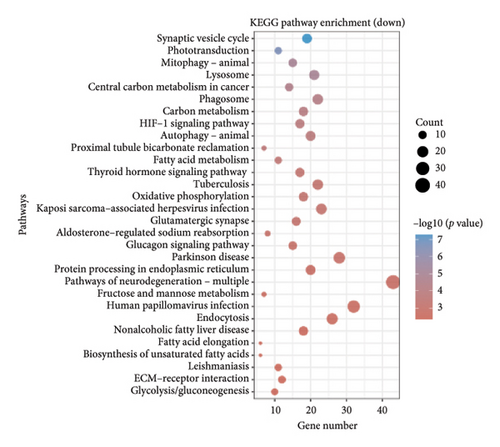
The volcano plot (Figure 2(a)) displays the DEGs between chemotherapy-treated and nontreated RB samples. A total of 17,962 genes were analyzed, with significantly upregulated (log2FC > 1, adjusted p value < 0.05) and downregulated (log2FC < −1, adjusted p value < 0.05) genes highlighted in red and blue, respectively. Key upregulated genes such as DDX3Y and UTY, and downregulated genes such as RPS4Y1, are labeled, highlighting their potential roles in the response to chemotherapy. The circular heatmap (Figure 2(b)) presents the expression levels of the top DEGs in chemotherapy-treated versus nontreated RB patients. The red and blue gradients represent high and low expression, respectively. Distinct clustering of samples indicates clear differences in gene expression patterns influenced by chemotherapy, with notable upregulation of specific genes in treated samples. GO enrichment analysis of upregulated genes (Figure 2(c)) reveals significant enrichment in biological processes such as “antigen processing and presentation,” “NK cell-mediated cytotoxicity,” and “olfactory transduction.” These results suggest enhanced immune activation and potential changes in signaling pathways following chemotherapy. The KEGG pathway enrichment analysis of upregulated genes (Figure 2(d)) identifies key pathways such as “antigen processing and presentation,” “NK cell-mediated cytotoxicity,” and “gut-microbiota-host-disease interactions,” implying immune system activation as a consequence of chemotherapy. Conversely, GO analysis for downregulated genes (Figure 2(e)) highlights processes such as “photoreceptor cell differentiation,” “chromatin organization,” and “RNA splicing,” suggesting a potential suppression of normal retinal cell functions due to chemotherapy. KEGG pathway analysis of downregulated genes (Figure 2(f)) shows significant enrichment in pathways such as “synaptic vesicle cycle,” “phototransduction,” and “thyroid hormone synthesis,” indicating alterations in retinal cellular and metabolic functions in chemotherapy-treated samples.
3.3. Comparison of DEGs in Chemotherapy-Treated and Nontreated RB Patients
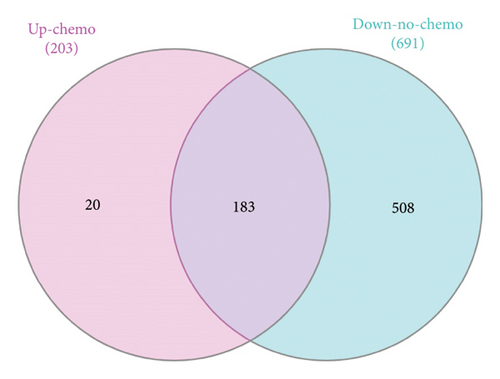
The Venn diagrams illustrate the overlap and distinctions in DEGs between chemotherapy-treated and nontreated RB patients. Upregulated genes in chemotherapy-treated samples (203 genes) were compared with downregulated genes in nontreated samples (691 genes), revealing 183 overlapping genes, which may play a crucial role in chemotherapy response. Additionally, 20 genes were uniquely upregulated in chemotherapy-treated samples, while 508 genes were exclusively downregulated in nontreated samples (Figure 3(a)). Similarly, a comparison of downregulated genes in chemotherapy-treated samples (1083 genes) with upregulated genes in nontreated samples (2450 genes) identified 838 overlapping genes, suggesting their involvement in chemotherapy-induced transcriptional changes. Furthermore, 245 genes were uniquely downregulated in chemotherapy-treated samples, whereas 1612 genes were exclusively upregulated in nontreated samples (Figure 3(b)).

3.4. Single-Cell Analysis of RB TME
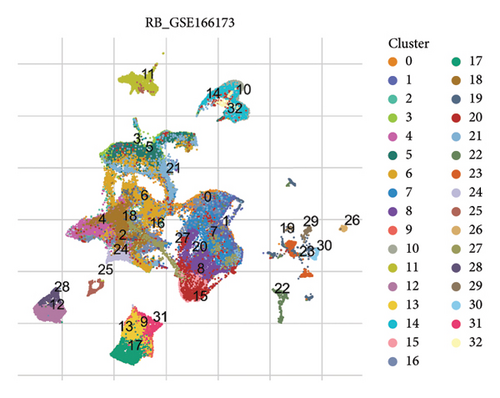
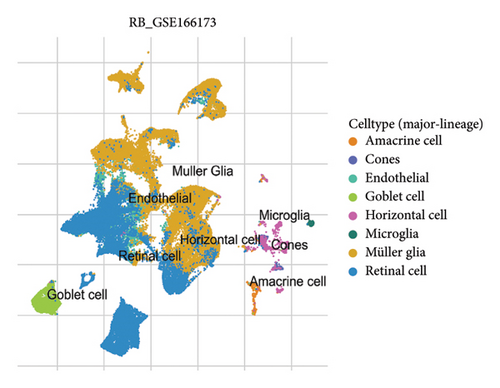
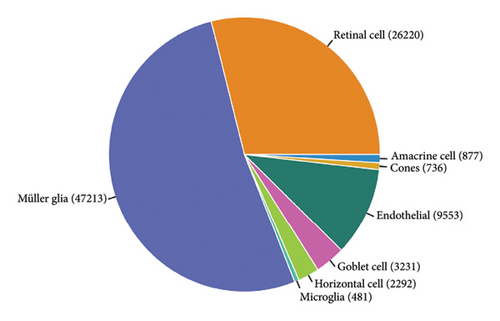
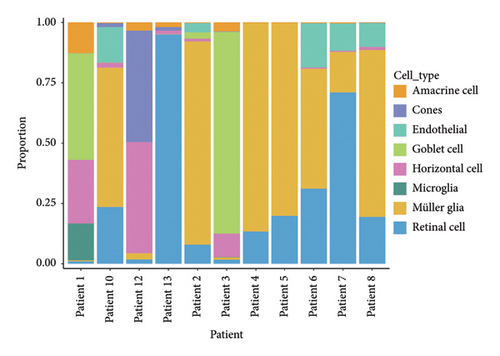
The scRNA-seq data from RB samples were visualized and analyzed to characterize the cellular composition and distribution within the TME. The UMAP plot shows 32 distinct clusters, representing transcriptionally unique cell populations (Figure 4(a)). These clusters were annotated into major cell types based on canonical marker genes, including Müller glia, retinal cells, amacrine cells, cones, horizontal cells, goblet cells, endothelial cells, and microglia (Figure 4(b)). The pie chart in Figure 4(c) illustrates the overall composition of cell types across all RB samples. Müller glia and retinal cells were the most abundant cell populations, comprising 47,213 and 26,220 cells, respectively, followed by endothelial cells (9553 cells), goblet cells (3231 cells), and microglia (1834 cells). Other cell types, such as amacrine cells (877 cells), cones (736 cells), and horizontal cells (292 cells), were present in smaller proportions. The bar plot in Figure 4(d) shows the proportional distribution of cell types across individual patients. While Müller glia and retinal cells dominate in most patients, the relative abundance of other cell types varies significantly between samples, suggesting inter-patient heterogeneity in the TME.
3.5. Immunological GSEA Across RB Cell Types
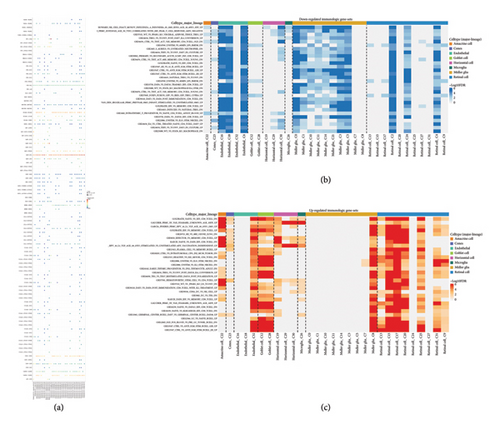
To investigate immune-related transcriptional changes in RB, immunologic GSEA was performed across different cell types. The results are summarized in heatmaps showing downregulated (Figure 5(b)) and upregulated (Figure 5(c)) gene sets, with cell type-specific differences in expression patterns. The dot plot (Figure 5(a)) provides an overview of the distribution of immune-related genes across all cell types, with color and size indicating relative expression levels and the number of cells expressing specific genes, respectively. Figure 5(b) illustrates the downregulated immunologic gene sets across major cell lineages. Müller glia and retinal cells exhibited a notable reduction in pathways related to antigen presentation, NK cell activity, and immune effector processes. Other cell types, such as microglia and endothelial cells, also displayed suppressed expression of key immune-associated pathways, indicating an overall immunosuppressive environment in certain RB cell populations. In contrast, the upregulated immunologic gene sets are shown in Figure 5(c). Retinal cells and Müller glia demonstrated significant upregulation in pathways associated with inflammatory responses, cytokine signaling, and immune cell recruitment. Additionally, microglia exhibited enhanced expression of pathways linked to immune surveillance and innate immunity, reflecting their role in tumor immune interactions.
3.6. Oncogenic Pathway Analysis and Cell-Cell Interaction in RB
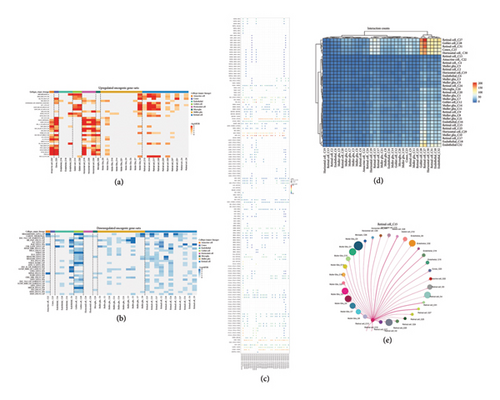
To investigate the activation and suppression of oncogenic pathways in RB, GSEA was performed across different cell types. Figure 6(a) shows the upregulated oncogenic gene sets, where Müller glia and retinal cells displayed significant enrichment in pathways such as MYC targets, E2F targets, and G2/M checkpoint regulation, highlighting their active roles in tumor proliferation and survival. Conversely, Figure 6(b) illustrates the downregulated oncogenic gene sets, with reduced activity in signaling pathways like Hedgehog, WNT, and mTOR in certain cell types, suggesting potential therapeutic vulnerabilities. The dot plot (Figure 6(c)) visualizes the distribution of key oncogenic genes across different cell types, with color and size indicating the relative expression and number of cells expressing specific genes, respectively. This analysis underscores the heterogeneity of oncogenic signaling within the RB TME. Cell-cell interaction analysis was conducted to explore intercellular communication within the RB TME. The interaction heatmap (Figure 6(d)) reveals the number of interactions between cell clusters, with strong interactions observed among Müller glia, retinal cells, and endothelial cells. These findings suggest coordinated signaling between these cell types, potentially contributing to tumor progression. A detailed network plot of interactions focusing on retinal cell cluster C15 is presented in Figure 6(e). Retinal cells (C15) show extensive interactions with Müller glia and endothelial cells, emphasizing their central role in shaping the TME through paracrine and juxtacrine signaling mechanisms.
3.7. Expression Patterns of Immune Checkpoint Molecules in RB
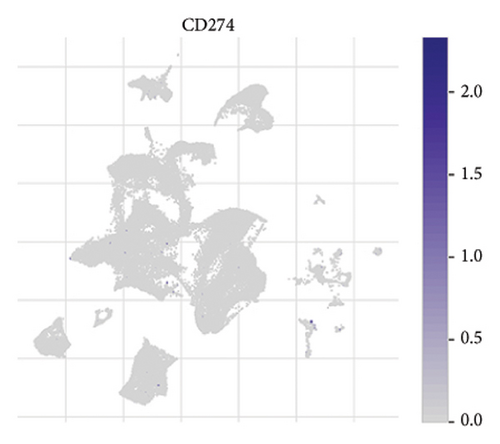
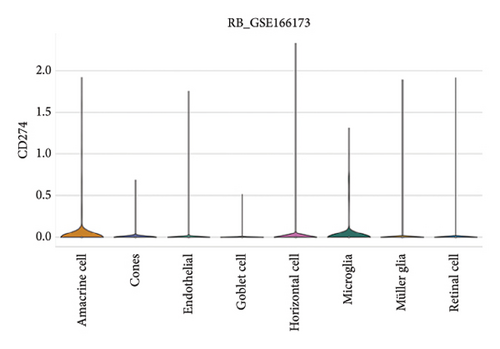
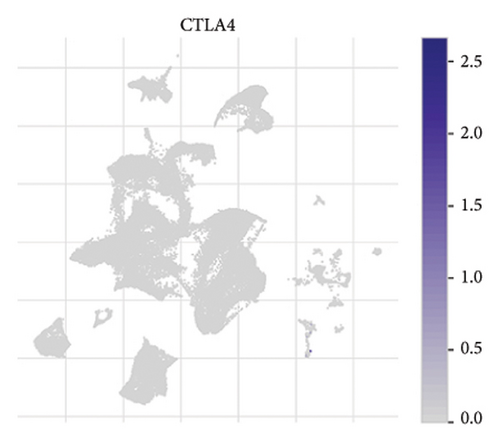
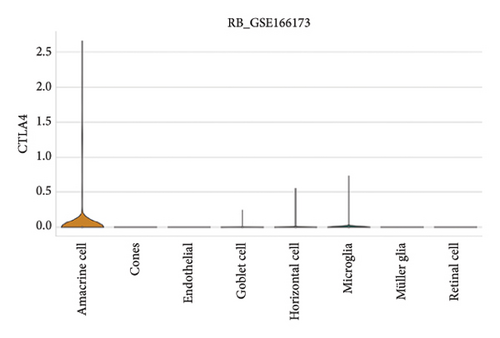
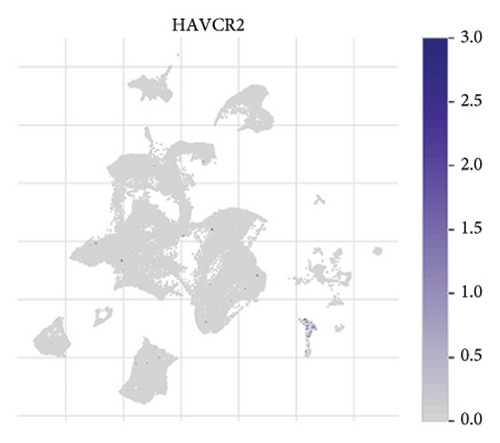
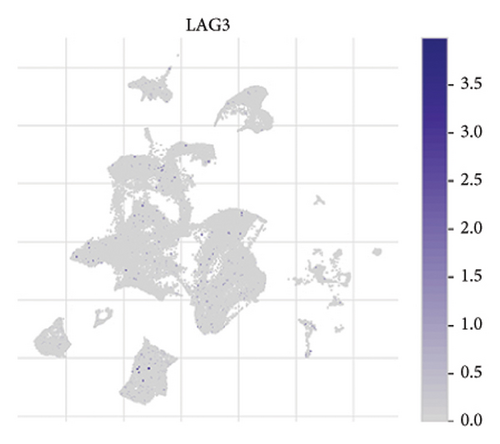
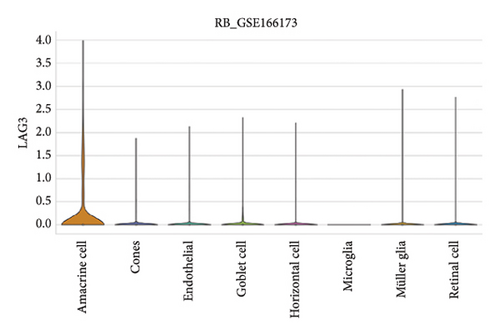
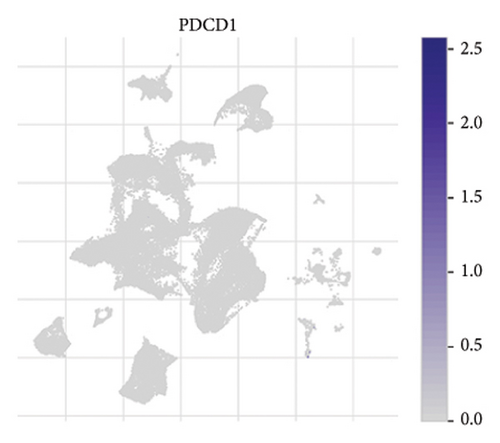
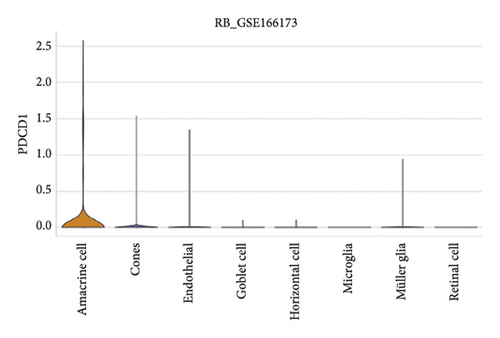
The expression of immune checkpoint molecules, including CD274 (PD-L1), CTLA4, HAVCR2 (TIM-3), LAG3, and PDCD1 (PD-1), was analyzed across different cell types in RB samples to investigate the tumor immune microenvironment. Figures 7(a), 7(b) show the spatial and cell-type-specific expression of CD274 (PD-L1), indicating its low but detectable expression predominantly in microglia and Müller glia, suggesting these cell types may contribute to immune evasion in RB. Similarly, CTLA4 expression was primarily confined to amacrine cells, as shown in Figures 7(c), 7(d), with minimal expression in other cell types. HAVCR2 (TIM-3) expression was relatively higher in amacrine cells, as visualized in Figures 7(e), 7(f), implying its potential involvement in modulating immune responses within this specific cell population. LAG3 followed a similar pattern, with enhanced expression in amacrine cells (Figures 7(g), 7(h)), reinforcing the immunoregulatory role of these cells in the RB TME. Lastly, PDCD1 (PD-1), a key immune checkpoint molecule, was predominantly expressed in amacrine cells, as shown in Figures 7(i), 7(j). This further supports the hypothesis that amacrine cells may play a critical role in immune suppression in RB.

3.8. Differential Expression of Immune, m6A, and Ferroptosis-Related Genes in RB
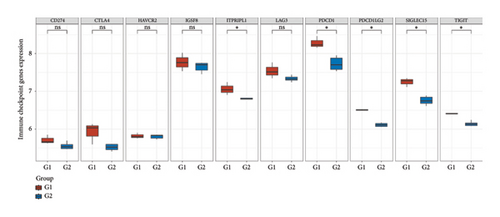
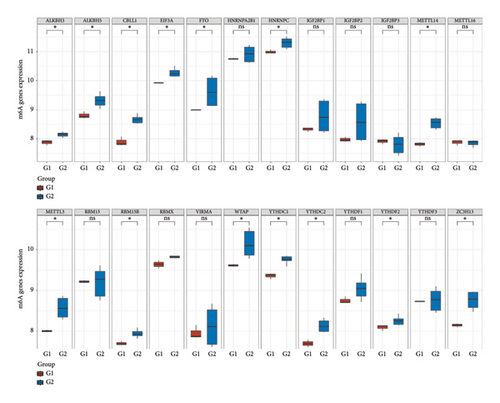
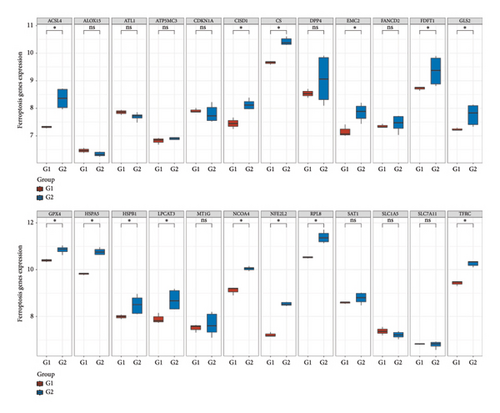
To further understand the molecular mechanisms underlying RB, the expression of immune checkpoint-related genes, m6A modification-related genes, and ferroptosis-associated genes was analyzed across different sample groups. Figure 8(a) illustrates the expression patterns of immune checkpoint-related genes, including CD274 (PD-L1), CTLA4, HAVCR2 (TIM-3), LAG3, PDCD1 (PD-1), and others. Significant upregulation of PDCD1 and CD274 was observed in Group Q2 compared to Group Q1, highlighting a potentially enhanced immune suppression in this group. Other checkpoint genes, such as LAG3 and HAVCR2, showed no significant differences between the groups. Figure 8(b) depicts the expression of m6A modification-related genes, including writers (METTL3, WTAP), erasers (FTO, ALKBH5), and readers (YTHDF1, YTHDF2). Key m6A regulatory genes, such as METTL3, WTAP, and YTHDF2, were significantly upregulated in Group Q2 compared to Group Q1, suggesting that alterations in RNA methylation may play a role in RB progression. Figure 8(c) focuses on ferroptosis-related genes, which are crucial for regulating iron-dependent cell death. Genes such as ACSL4, SLC7A11, and GPX4 were significantly upregulated in Group Q2, indicating an elevated ferroptosis potential. Conversely, genes like SAT1 and FTL showed no significant differences between groups, suggesting that ferroptosis regulation may vary across specific pathways or subtypes.
3.9. CDKN1A Knockdown Suppresses Cell Viability and Alters Cell Cycle Progression in RB Cells
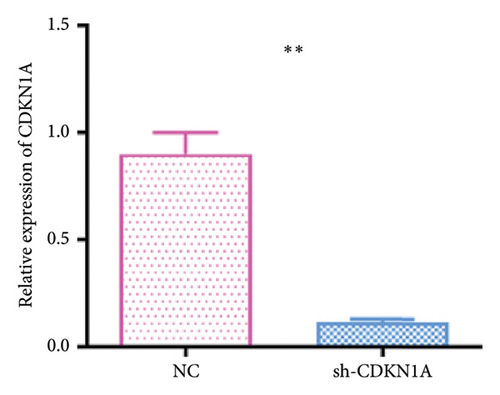
To investigate the functional role of CDKN1A in RB cells, we first confirmed the knockdown efficiency of shRNA targeting CDKN1A by qPCR. As shown in Figure 9(a), transfection with sh-CDKN1A significantly reduced CDKN1A mRNA expression compared to the negative control (sh-NC) group (p < 0.01), confirming successful gene silencing. Next, cell viability was assessed using the MTT assay at 0, 24, 48, and 72 h post-transfection. As shown in Figure 9(b), the sh-CDKN1A group exhibited significantly reduced cell viability compared to the sh-NC group in a time-dependent manner, with a notable difference observed at 72 h (p < 0.01), suggesting that CDKN1A knockdown suppressed the proliferative capacity of RB cells. To further elucidate the mechanism underlying the proliferation suppression, we performed cell cycle analysis by flow cytometry. The results revealed a marked increase in the proportion of cells in the G1 phase and a decrease in S phase in the sh-CDKN1A group relative to the control (Figure 9(c)), indicating G1 phase cell cycle arrest upon CDKN1A silencing.
4. Discussion
In this study, we comprehensively analyzed gene expression profiles, immune checkpoint molecules, oncogenic pathways, and ferroptosis-related genes in RB using bulk and scRNA-seq data. Our findings provide insights into the molecular and cellular heterogeneity of RB, emphasizing potential therapeutic targets and pathways that contribute to tumor progression and immune evasion.
The differential expression analysis revealed distinct transcriptional profiles between RB and normal retinal tissues, as well as between chemotherapy-treated and nontreated samples. Key upregulated genes, such as TOP2A and DCT, highlight the active proliferation and signaling pathways involved in RB pathogenesis. Downregulated genes, including those associated with “p53 signaling” and “DNA repair” pathways, suggest impaired genomic stability in RB. The identification of overlapping and unique gene sets in chemotherapy-treated and nontreated samples underscores the significant impact of chemotherapy on tumor biology and highlights potential markers of treatment response.
Our immune infiltration analysis using ssGSEA demonstrated an immunosuppressive TME in RB, characterized by reduced antigen presentation and NK cell activity in Müller glia and retinal cells. Notably, immune checkpoint molecules such as PDCD1 (PD-1), CD274 (PD-L1), and HAVCR2 (TIM-3) were differentially expressed, with higher expression observed in specific cell types like amacrine cells, microglia, and Müller glia. These findings suggest that immune evasion mechanisms are active in RB and may be targeted using immune checkpoint inhibitors. Despite the immune-privileged nature of the eye, the presence of immunological features in the RB TME highlights the potential for immunotherapeutic interventions.
The oncogenic pathway analysis revealed that pathways such as MYC targets, E2F targets, and G2/M checkpoint regulation are significantly upregulated in Müller glia and retinal cells, reflecting their roles in driving tumor proliferation and survival. Conversely, downregulated pathways, including Hedgehog and mTOR signaling, suggest therapeutic vulnerabilities that could be exploited in RB treatment. Furthermore, cell-cell interaction analysis identified strong signaling interactions between Müller glia, retinal cells, and endothelial cells, emphasizing their cooperative roles in tumor progression.
Our study highlights the involvement of RNA modifications and ferroptosis in RB. Elevated expression of m6A regulatory genes, such as METTL3, WTAP, and YTHDF2, suggests that alterations in RNA methylation may contribute to tumor progression. Similarly, the upregulation of ferroptosis-related genes, including ACSL4, SLC7A11, and GPX4, indicates a potential vulnerability in RB that could be targeted using ferroptosis-inducing therapies.
The findings of this study have significant clinical implications. The identification of immune checkpoint molecules as potential therapeutic targets supports the application of immunotherapy in RB. Furthermore, the discovery of altered oncogenic pathways, m6A modifications, and ferroptosis-related genes provides opportunities for the development of novel targeted therapies. scRNA-seq further revealed the cellular heterogeneity and inter-patient variability in the RB TME, underscoring the need for personalized treatment strategies.
Future studies should focus on validating these findings in larger patient cohorts and exploring combination therapies that integrate immunotherapy, targeted therapies, and ferroptosis-inducing agents. Additionally, leveraging advanced technologies such as spatial transcriptomics could provide further insights into the spatial organization and functional states of cells within the RB microenvironment.
Despite providing comprehensive multiomics insights into the molecular landscape and TME of RB, this study has several limitations. First, the bulk and single-cell transcriptomic analyses were based on publicly available datasets with limited sample size, which may not fully capture the heterogeneity of RB across diverse clinical subtypes [26]. Second, while CDKN1A was functionally validated in vitro through knockdown and proliferation assays, further in vivo studies are needed to confirm its role in tumor progression and therapeutic response.
5. Conclusion
This study advances our understanding of the molecular and cellular mechanisms underlying RB and highlights potential therapeutic avenues. The integration of multiomics approaches provides a comprehensive view of RB biology, paving the way for more effective and personalized treatment strategies that address the unique challenges of this aggressive pediatric malignancy.
Conflicts of Interest
The authors declare no conflicts of interest.
Funding
This research received no specific grant from any funding agency in the public, commercial, or not-for-profit sectors.
Open Research
Data Availability Statement
The data that support the findings of this study are available from the corresponding author upon reasonable request.


