Population Pharmacokinetics and AUC-Based Dose Optimization of Vancomycin in Chinese Neonates
Abstract
Objective: The primary objective of this study revolves around the development of a population pharmacokinetic (PPK) model for vancomycin in neonatal subjects, with the objective of providing a theoretical basis for judicious therapeutic interventions.
Methods: In this study, a retrospective collection encompassed 75 neonatal patients, contributing to a total of 89 vancomycin blood concentration monitoring datasets. The establishment of the PPK model is carried out utilizing the nonlinear mixed effects model methodology. The PPK model was constructed employing a one-compartment model with proportional residual error, and the influence of covariates on pharmacokinetic parameters was systematically assessed through forward stepwise addition and backward elimination methods. The stability and predictive accuracy of the final model were assessed using goodness-of-fit plots, nonparametric bootstrap validation, visual predictive checks, and normalized prediction distribution errors. Furthermore, Monte Carlo simulations were employed to predict vancomycin concentrations in neonatal patients with typical characteristics.
Results: The final PPK model yielded population-typical values of 0.24 L/h for vancomycin clearance (CL). Noteworthy contributors to vancomycin CL were identified as body weight, gestational age, creatinine clearance rate (CLcr), and sex. Internal validation results of the model indicate that it possesses stability, efficacy, and demonstrates a favorable predictive capacity. Monte Carlo simulations indicate that for a male neonatal patient characterized by a gestational age of 37 weeks, a body weight of 2.5 kg, and a CLcr of 60 mL/min, the recommended dosing regimen is 25.5 to 41.5 mg every 8 h.
Conclusion: This investigation has successfully formulated a PPK model for vancomycin in neonatal patients, offering the capacity to estimate individual CL. The dosing regimen for neonates should take into account factors such as body weight, gestational age, CLcr, and sex.
1. Introduction
Vancomycin, the inaugural glycopeptide antibiotic to be clinically marketed worldwide, retains its status as the preferred therapeutic agent for combatting Methicillin-resistant Staphylococcus aureus (MRSA) infections [1, 2]. Its mechanism of action involves disrupting bacterial cell wall and RNA synthesis, thereby impinging cellular membrane permeability and exerting bactericidal effects [3]. Following intravenous administration, approximately 80% of the administered vancomycin dose undergoes renal elimination in an unaltered form [4, 5]. Vancomycin possesses a narrow therapeutic window, with suboptimal blood levels potentially giving rise to drug resistance, while elevated blood concentrations can induce renal toxicity or ototoxicity [1, 6–8]. Recent clinical data on vancomycin pharmacokinetics and pharmacodynamics indicate that monitoring the concentration–time curve at 24 h to the minimal inhibitory concentration (AUC24/MIC) ratio significantly reduces vancomycin exposure and nephrotoxicity rates compared to traditional trough concentration monitoring [9, 10]. In response to these findings, the American Society of Health-System Pharmacists has issued revised guidelines for vancomycin therapy. The guidelines recommend an individualized target AUC24/MIC of 400 to 600 mg × h/L (assuming a vancomycin MIC of 1 mg/L) for all patients, including children and neonates, with suspected or confirmed serious MRSA infections [9].
Striking a balance between the risks and therapeutic efficacy remains a significant challenge, prompting ongoing refinement and advancement in vancomycin monitoring. This pursuit is particularly pronounced in specific patient demographics, such as neonates, warranting meticulous attention and further development [11, 12].
Neonatal sepsis stands as a prevalent etiological contributor to neonatal mortality, with vancomycin frequently employed as an antibiotic within the Neonatal Intensive Care Unit (NICU) for sepsis treatment [13–15]. However, vancomycin exhibits substantial interindividual variations in its therapeutic management of critical infections among neonates, posing clinical challenges [16, 17]. The physiological characteristics of neonates encompass rapid metabolic turnover and incomplete organ maturation, with a particular emphasis on the renal system [18]. Notably, neonates exhibit renal tubular secretion rates and glomerular filtration rates ranging from merely 1/8 to 1/5 of those observed in adults [19, 20]. These distinctions give rise to significant disparities in drug absorption, distribution, metabolism, and elimination processes between neonates and adults [18]. Furthermore, due to the lack of a consensus on the ideal dosing regimen, clinicians encounter difficulties in achieving target blood trough concentrations in neonates following initial empiric dosing [21]. Consequently, guidelines advocate the incorporation of population pharmacokinetic (PPK) methodologies, along with therapeutic drug monitoring, to guide the refinement of vancomycin protocols for this specific demographic [22].
PPK employs statistical principles in conjunction with therapeutic drug monitoring techniques to examine covariates that influence the pharmacokinetic processes in a population [23]. This approach holistically assesses diverse factors contributing to interindividual and intraindividual pharmacokinetic variations, subsequently predicting personalized pharmacokinetic parameters for patients, thereby facilitating the development of individualized dosing strategies [23, 24]. Several PPK models for vancomycin in neonates have been established. These models have indicated that postmenstrual age (PMA), body weight (BW), and serum creatinine are the most significant predictors for clearance (CL), while BW plays a pivotal role in the volume of distribution (Vd) [16, 25–38]. However, these models demonstrate notable variability in estimating the pharmacokinetic parameters of the neonatal population. This variability may arise from a multitude of factors, including ethnic backgrounds, disease states, analytical methods for vancomycin, the sample sizes, clinical practices, and treatment regimens [39]. These factors collectively contribute to significant differences in the models’ predictive capabilities, especially when they undergo external validation [39].
Therefore, the objective of this study is to identify the covariates that influence pharmacokinetic parameters of vancomycin and to develop a PPK model for neonatal patients in our healthcare institution, which may offer valuable insights for guiding clinical dosing strategies, thus ensuring the clinical efficacy and safety of vancomycin in this specific patient population.
2. Materials and Methods
2.1. Study Population
This was a retrospective study conducted at the Yinchuan First People’s Hospital, Yinchuan, Ningxia, China, from August 2018 and December 2022. Our study received approval from the Ethics Committee of Yinchuan First People’s Hospital (ID: KY-2023--065) and obtained informed consent from the patients or their legal guardians. The study cohort enrolled 75 neonatal patients receiving intravenous vancomycin treatment in the NICU of the First People’s Hospital of Yinchuan City.
Inclusion criteria: Neonates who received intravenous vancomycin therapy for more than 72 h and underwent at least one measurement of steady-state vancomycin trough concentration were included.
Exclusion criteria: Patients with incomplete information in the medical records, those with multiorgan dysfunction syndrome, disseminated intravascular coagulation, and those who underwent blood dialysis or hemofiltration during the period of vancomycin treatment were excluded.
2.2. Patient Treatment and Sample Collection
Vancomycin dosing regimens were personalized by clinical physicians based on individual patient conditions. The administration ranged from 7 to 30 mg/kg per dose, with intervals varying between every 8 h and every 12 h. Vancomycin was administered intravenously, and 2 mL of venous blood specimen were collected 0.5 h before administration for monitoring trough concentrations.
2.3. Vancomycin Concentrations Monitoring Method
After subjecting blood samples to centrifugation at 5000 revolutions per minute (rpm) for 5 min, 100 μL of plasma was extracted. This plasma was then combined with 300 μL of chromatographically pure ethyl acetate. Following vortex mixing, the solution underwent further centrifugation at 12,000 rpm for 10 min. Subsequently, 300 μL of chloroform was added, and the resulting mixture was vortexed for 1 min, followed by centrifugation (1200 rpm, 10 min). The resulting supernatant was extracted for subsequent analysis.
Utilizing the Agilent 1260 high-performance liquid chromatograph (HPLC) system, employing an Agilent ZORBAX Eclipse XDB-C18 column (250 × 4.6 mm, 5 μm), with the column temperature at 30°C, a 10 μL aliquot of the extracted sample was injected. Chromatographic separation was facilitated using a mobile phase consisting of acetonitrile and phosphate buffer (pH 3.2, 10:90), with a flow rate set at 1.0 mL/min. Detection took place at a wavelength of 236 nm, employing the Agilent ZORBAX Eclipse XDB-Cs column. The analytical range encompassed concentrations ranging from 4 to 100 mg/L.
2.4. Data Collection
From the patient cohort, type of infection, comprehensive demographic and vancomycin-associated clinical data were meticulously gathered. This encompassed a range of fundamental particulars, including gestational age (GA), postnatal age (PNA), PMA, sex, stature, BW, body mass index (BMI), clinical diagnoses, laboratory results (albumin levels, neutrophil ratio), vancomycin administration specifics (dosage, dosing intervals, duration of administration, initiation and cessation timestamps, blood sampling timings, and corresponding vancomycin blood concentration values), renal function profiles (serum creatinine [Scr], creatinine clearance rate [CLcr], and concurrent medication utilization (meropenem, diuretics, human serum albumin), among other pertinent attributes. CLcr is calculated by the Schwartz 2009 formula [40].
2.5. Development of PPK Model
The nonlinear mixed effects modeling of the PPK model was conducted using Phoenix NLME software (version 8.3; Certara, St. Louis, Missouri). The first-order conditional estimation with extended least square method (FOCE-ELS) was adopted for parameter estimation in model. Assessment and comparison of various models relied on disparities in the objective function value (OFV), the Akaike Information Criterion, and the Bayesian Information Criterion. To evaluate the robustness and predictive performance of the final model, we conducted bootstrap analysis, visual predictive check (VPC), and assessment of normalized prediction distribution errors (NPDE) [41].
2.5.1. Base Model
CL represents the vancomycin CL, Ac signifies the amount of vancomycin in the central compartment, and Cc represents the concentration of vancomycin in the central compartment.
2.5.2. Covariate Model
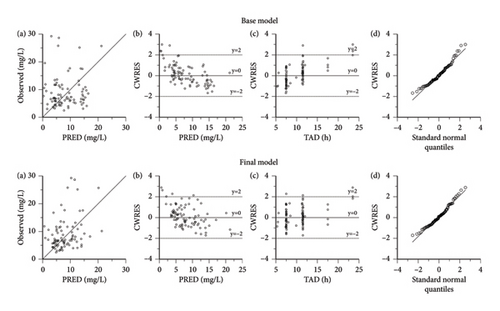
Vancomycin pharmacokinetic parameters underwent evaluation for the effects of various covariates through the forward addition and backward elimination method. In the forward addition phase, covariates were deemed to significantly influence the parameters if the difference in ΔOFV exceeded 3.84 (p < 0.05, df = 1), warranting their incorporation into the model. Conversely, during the backward elimination stage, covariates were retained in the model if the ΔOFV exceeded 6.64. Scatter plots were employed to appraise the goodness-of-fit between the base model and final model, encompassing observed concentrations versus population predicted concentration (PRED), conditional weighted residuals (CWRES) versus PRED, CWRES versus time after dose (TAD), and CWRES versus standard normal quantiles (p < 0.01, df = 1), indicating a significant impact on the parameters. Any covariates failing to meet these criteria were excluded from the model.
2.5.3. Goodness-of-Fit and Model Evaluation
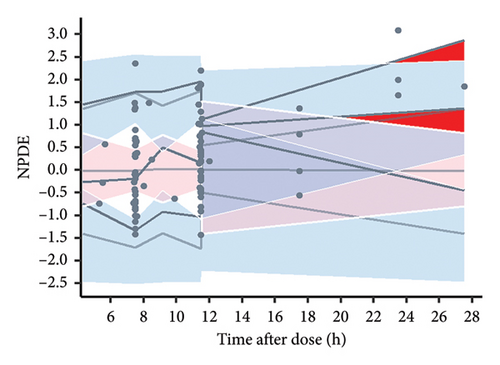
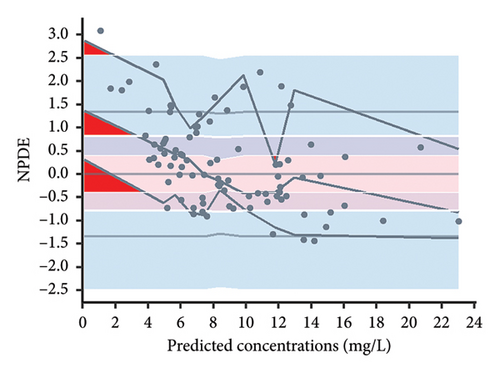
The final model was both graphically and statistically validated using bootstrap analysis, VPC, and NPDE method. For 1000 bootstrap, median estimates and the 95% confidence interval (2.5%–97.5%) of the parameters were calculated and compared with the final model’s estimations. 1000 Monte Carlo simulation was executed for VPC and NPDE analyses. The VPC analysis was carried out by computing the 5th, 50th, and 95th percentiles of the simulated outcomes (90% prediction interval) and subsequently contrasting them with the observed concentrations distribution. The NPDE analysis was utilized to assess the model’s adequacy for describing the data, with the assumption of adhering to a normal distribution N (0, 1). The divergence of NPDE mean from 0 and variance from 1 was evaluated using the Wilcoxon signed-rank test and Fisher test for variance, respectively. Assessment of the potential deviation from a normal distribution was carried out using the Shapiro–Wilk test. Graphical diagnostics for NPDE encompassed a histogram of NPDE, a quantile–quantile plot of NPDE, NPDE versus TAD, and NPDE versus PRED. Data analysis and visualization were executed using R software (Version 4.2.3; https://www.r-project.org).
2.5.4. Simulations for Dose Selection
To predict vancomycin concentrations in neonatal patients with typical characteristics, Monte Carlo simulation was employed. Referring to the instruction manual and clinical guidelines of vancomycin, the recommendation is to administer medication to neonates every 12 h for the first week after birth, and then every 8 h for those aged between 1 week and 1 month. In our study, the median PNA of the neonates was 19 days, with only 13% of patients being within the first week of birth. Consequently, for our simulation, we have selected a standard dosing interval of 8 h, allowing for a comprehensive exploration of various dosing regimens. Iterative simulations, totaling 1000 repetitions, were conducted for each distinct dosing regimen. Within each subgroup of patients, individualized computations were performed to determine the median dosages required to achieve therapeutic target AUC24 levels of 400 and 650 mg × h/L, as recommended by clinical guidelines. This determination was based on 1000 simulation runs for each specific scenario [10].
2.6. Statistical Analysis
Statistical analysis was executed employing SPSS Statistics software (Version 27.0). Given that the covariate obtained in this study did not conform to a normal distribution, descriptive statistics were presented in the form of median (minimum-maximum) to accurately represent the central tendency and variability of the dataset. The vancomycin concentrations at 1-h intervals postadministration were simulated by final PPK model, and the AUC24 is precisely calculated using the linear trapezoidal method.
3. Results
3.1. Demographic Data of Enrolled Patients
A dataset comprising 89 vancomycin plasma concentrations was gathered from a cohort of 75 Chinese neonatal patients, consisting of 46 males and 29 females. The cohort displayed a mean GA of 36.27 ± 3.66 weeks, a PNA of 22.64 ± 21.29 days, and an average weight of 2.75 ± 0.93 kg. The mean vancomycin plasma concentration was 8.55 ± 5.63 mg/L, with 70.8% (63/89) of patients achieving the guideline-recommended steady-state trough concentration of 5 to 15 mg/L [10]. Within this cohort, a subset of patients (21.33%) received albumin during their treatment, while 86.67% were administered meropenem, and 45.33% were prescribed diuretics. A summary of patients’ demographic attributes, laboratory test results, and administered medications is presented in Table 1.
| Variable | Median (range) |
|---|---|
| No. of subjects | 75 |
| No. of observation | 89 |
| Sex (male/female) | 46/29 |
| Race (Han/Hui/Mongolian) | (52/22/1) |
| Vancomycin concentration (mg/L) | 7.01 (2.46–29.23) |
| Gestational age (weeks) | 37 (28–42) |
| Postnatal age (days) | 19 (3–146) |
| Postmenstrual age (weeks) | 40.29 (30.14–48.86) |
| Height (cm) | 49.0 (35.0–59.5) |
| Body weight (kg) | 3.0 (1.07–4.74) |
| Body mass index (kg/m2) | 12.3 (5.40–17.50) |
| Serum creatinine (μmol/L) | 31.2 (10.7–101.8) |
| Creatinine clearance (mL/min/1.73 m2) | 68.69 (23.88–218.10) |
| Albumin (g/L) | 31.5 (13.8–42.4) |
| Neutrophilic granulocyte percentage (%) | 54.8 (10.5–90.5) |
| Type of infection (%) | |
| Septicemia | 12 (16%) |
| Sepsis | 11 (14.7%) |
| Intrauterine infection | 9 (12%) |
| Intracranial infection | 21 (28%) |
| Neonatal pneumonia | 34 (45.3%) |
| Necrotizing enterocolitis | 10 (13.3%) |
| Neonatal peritonitis | 6 (8%) |
| Urinary tract infection | 3 (4%) |
| Comedications (used, %) | |
| Human albumin | 20 (22.5%) |
| Meropenem | 77 (86.5%) |
| Diuretics | 42 (47.2%) |
3.2. Development of PPK Model
| Model no. | Model description | OFV | ΔOFV | p value |
|---|---|---|---|---|
| Forward addition | ||||
| 1 | Base model | 581.37 | ||
| 2 | Add CLcr on CL in model 1 | 548.96 | −32.41 | < 0.05 |
| 3 | Add GA on CL in model 2 | 542.13 | −6.83 | < 0.05 |
| 4 | Add sex on CL in model 3 | 535.08 | −7.05 | < 0.05 |
| Backward elimination | ||||
| 5 | Remove CLcr on CL from model 4 | 563.79 | 28.71 | < 0.01 |
| 6 | Remove GA on CL from model 4 | 542.96 | 7.89 | < 0.01 |
| 7 | Remove sex on CL from model 4 | 542.13 | 7.05 | < 0.01 |
Within this equation, the value of 0.24 L/h signifies the typical value of CL (L/h), while 1.8 L stands as the typical value of Vd (L). The coefficients estimated for the association between CL and CLcr were determined as 0.4, while the linkage between GA and CLcr yielded an estimated coefficient of 1.23. Furthermore, in instances where the sex was identified as female, the sex value was assigned as 0.25; conversely, it was set to 0 for male subjects. Table 3 presents exhaustive information regarding parameter estimates, relative standard errors, 95% confidence intervals, interindividual variability, intraindividual residual variability, and outcomes of bootstrap analyses.
| Parameter | Base model | Final model | Bootstrap final model | |||
|---|---|---|---|---|---|---|
| Estimate (%RSE) | 95% CI | Estimate (%RSE) | 95% CI | Median (%RSE) | 95% CI | |
| Vd (L) | 1.8 | — | 1.8 | — | 1.8 | — |
| CL (L/h) | 0.25 (5.26) | (0.23, 0.28) | 0.24 (6.06) | (0.21, 0.26) | 0.24 (7.55) | (0.20, 0.27) |
| θCLcr | — | — | 0.40 (19.84) | (0.24, 0.56) | 0.40 (20.41) | (0.23, 0.53) |
| θGA | — | — | 1.23 (37.37) | (0.32, 2.15) | 1.22 (40.32) | (0.28, 2.25) |
| θsex | — | — | 0.25 (34.41) | (0.08, 0.42) | 0.25 (35.23) | (0.08, 0.44) |
| IIVCL (CV%) | 47.87% | — | 33.66% | — | 32.33% | — |
| σ (proportional) | 0.46 (10.61) | (0.37, 0.56) | 0.39 (12.71) | (0.29, 0.48) | 0.38 (12.94) | (0.28, 0.47) |
3.3. Goodness-of-Fit and Model Evaluation
Figure 1 illustrates the diagnostic plots presenting both the base model and the final models. The results demonstrate an improved fit of data achieved by the PPK models compared to the base model. The scatter plot depicted in Figure 1(a), illustrating the relationship between observed concentrations and PRED, reveals a robust correlation across the population. Examination of the plots representing CWRES versus PRED (Figure 1(b)) and CWRES versus TAD (Figure 1(c)) highlighted that a significant proportion of the residuals fell within a range of two standard deviations, evenly distributed on both sides of the coordinate axis. Evidently, no noticeable bias emerged among the variables of PRED, time, and CWRES. Furthermore, the quantile–quantile plots of CWRES (Figure 1(d)) exhibited adherence of the final model’s random effects (η and ε) to a normal distribution, aligning with the underlying modeling assumptions.
Consistency between the typical parameter estimates, standard errors, and 95% confidence intervals derived from the original dataset and those generated from successful bootstrap replicates was observed during the 1000 bootstrap iterations for the final models (Table 3). These results underscore the robustness and reproducibility of the final models. The presentation of the VPC outcomes is illustrated in Figure 2, where all 89 recorded vancomycin concentrations (100%) are found to fall within the 90% prediction interval as delineated by the final model, indicating that the model’s predictive capability is satisfactory. However, due to an insufficient amount of data, the deviation of the 5% and 50% percentiles indicates a potential insufficiency in the model’s ability to predict vancomycin concentrations when the TAD exceeds 15 h.

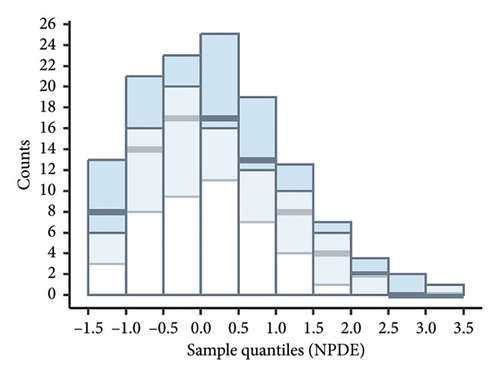
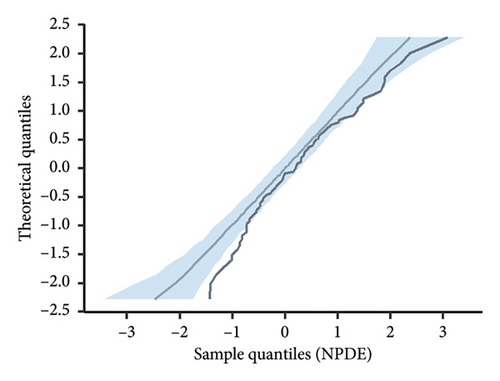
According to the statistical analysis, the mean NPDE value for the final model did not significantly differ from zero (0.24, p > 0.05), and the variance was not significantly different from one (0.89, p > 0.05). Furthermore, the Shapiro–Wilk test conducted on the final model yielded a p value greater than 0.05, suggesting that the NPDE adhered to a normal distribution. Figure 3 displays the diagnostic plots of the NPDE. Both the quantile–quantile plot and histogram of NPDE within the final model demonstrate a commendable alignment with the theoretical distribution, with minimal deviations observed concerning time or predicted concentration. These results provide compelling support for the adequacy of the final model in accurately describing the pharmacokinetics of vancomycin in neonates.
3.4. Simulations for Dose Selection
Table 4 aggregates the median dosages required to achieve AUC24 values of 400 and 650 mg × h/L, as projected by the final model across various subgroups of neonatal patients. As an example, in the scenario of a male neonatal patient characterized by a GA of 37 weeks, a BW of 2.5 kg, and a creatinine CL of 90 mL/min, the projected AUC24 was determined to be 398.0 mg × h/L when administered a dosage of 30.0 mg every 8 h.
| Creatinine clearance (mL/min/1.73 m2) | Body weight (kg) | Dosing interval (h) | Gestational age (weeks) | |||||||||||
|---|---|---|---|---|---|---|---|---|---|---|---|---|---|---|
| 32 | 37 | 40 | ||||||||||||
| Dose1 (mg) | AUC24 (400) | Dose2 (mg) | AUC24 (650) | Dose1 (mg) | AUC24 (400) | Dose2 (mg) | AUC24 (650) | Dose1 (mg) | AUC24 (400) | Dose2 (mg) | AUC24 (650) | |||
| Male | ||||||||||||||
| 90 | 1.5 | 8 | 17.5 | 400.0 | 28.5 | 651.5 | 21.0 | 405.6 | 33.5 | 647.0 | 23.0 | 399.5 | 37.0 | 642.6 |
| 90 | 2.5 | 8 | 25.5 | 399.0 | 41.5 | 649.4 | 30.0 | 398.0 | 49.0 | 650.0 | 34.0 | 404.9 | 54.0 | 643.1 |
| 90 | 4 | 8 | 36.0 | 401.8 | 58.0 | 647.3 | 43.0 | 394.8 | 70.0 | 642.7 | 48.5 | 395.7 | 80.0 | 652.7 |
| 60 | 1.5 | 8 | 15.0 | 403.0 | 24.0 | 644.9 | 17.5 | 397.4 | 28.5 | 647.2 | 19.5 | 398.2 | 32.0 | 653.5 |
| 60 | 2.5 | 8 | 21.5 | 395.3 | 35.5 | 652.6 | 25.5 | 397.6 | 41.5 | 647.1 | 28.5 | 399.0 | 46.5 | 651.1 |
| 60 | 4 | 8 | 30.5 | 399.5 | 49.5 | 648.4 | 37.0 | 399.2 | 60.0 | 647.4 | 42.0 | 402.8 | 67.5 | 647.4 |
| 30 | 1.5 | 8 | 11.5 | 406.6 | 18.5 | 654.0 | 13.5 | 404.0 | 21.5 | 643.4 | 15.0 | 403.9 | 24.0 | 646.2 |
| 30 | 2.5 | 8 | 16.5 | 398.2 | 27.0 | 651.6 | 19.5 | 400.3 | 31.5 | 646.6 | 21.5 | 396.6 | 35.0 | 645.7 |
| 30 | 4 | 8 | 23.0 | 394.0 | 38.0 | 651.0 | 28.0 | 397.1 | 46.0 | 652.4 | 32.0 | 404.1 | 51.5 | 650.3 |
| Female | ||||||||||||||
| 90 | 1.5 | 8 | 22.5 | 400.3 | 36.5 | 649.3 | 26.5 | 398.2 | 43.5 | 653.7 | 29.5 | 398.7 | 48.0 | 648.7 |
| 90 | 2.5 | 8 | 32.5 | 395.9 | 53.0 | 645.5 | 38.0 | 392.3 | 63.0 | 650.3 | 43.0 | 398.5 | 70.0 | 648.7 |
| 90 | 4 | 8 | 45.5 | 395.5 | 75.0 | 651.9 | 55.0 | 393.0 | 90.0 | 643.1 | 62.0 | 393.6 | 101.0 | 641.2 |
| 60 | 1.5 | 8 | 19.0 | 397.4 | 31.0 | 648.4 | 22.5 | 397.6 | 37.0 | 653.8 | 25.0 | 397.3 | 41.0 | 651.5 |
| 60 | 2.5 | 8 | 28.0 | 401.0 | 45.5 | 651.6 | 33.0 | 400.5 | 53.5 | 649.4 | 36.5 | 397.7 | 60.0 | 653.8 |
| 60 | 4 | 8 | 39.0 | 398.4 | 63.5 | 648.7 | 47.5 | 399.1 | 77.0 | 646.9 | 53.5 | 399.4 | 87.0 | 649.5 |
| 30 | 1.5 | 8 | 14.5 | 399.8 | 23.5 | 648.0 | 17.0 | 396.2 | 28.0 | 652.6 | 19.0 | 398.2 | 31.0 | 649.7 |
| 30 | 2.5 | 8 | 21.0 | 396.2 | 34.5 | 650.8 | 25.0 | 400.1 | 40.5 | 648.1 | 27.5 | 395.2 | 45.0 | 646.7 |
| 30 | 4 | 8 | 30.0 | 403.2 | 48.5 | 651.8 | 36.0 | 398.6 | 58.5 | 647.8 | 40.5 | 398.7 | 66.0 | 649.7 |
4. Discussion
4.1. Model Development and Validation
The study was conducted on neonates admitted to the NICU, employing retrospective analyses of routine therapeutic drug monitoring data to construct a neonatal PPK model for vancomycin. The model, structured as a one-compartment model, encompasses individual intervariability and residual variability, depicted respectively through exponential and proportional models. In prior PPK studies of vancomycin, two-compartment models were predominantly employed in adult patients, while one-compartment models were commonly applied in pediatric and neonatal populations [6, 42]. In our study, due to the sparsity of data resulting from the collection of trough concentrations only, comprehensive estimation of the two-compartment model was not feasible. Therefore, the structural model adopted a one-compartment model. Furthermore, considering the characteristics of this age group, which include a short distribution half-life and long elimination half-life, the predictive capacity of the one-compartment model is comparable to that of the two-compartment model. Numerous studies have also indicated that a one-compartment model is the most appropriate for describing vancomycin’s PPKs in neonates [26, 29–34, 36].
In accordance with prior research, the impact of BW on both vancomycin CL and Vd has been substantiated [25–38]. Consequently, in the formulation of the foundational vancomycin model, the influence of BW on CL and Vd was explicitly incorporated. Due to the absence of data regarding vancomycin’s distribution phase, the model could not estimate the value of Vd. In comparison to previous PPK studies of vancomycin in neonates, the baseline characteristics of the patients in our study were most similar to those of Frymoyer et al. [31]. Therefore, in reference to their work, the Vd value was fixed at 1.8 L (0.6 L/kg), which aligns with the Vd values estimated in the majority of neonatal vancomycin PPK models (0.5 to 0.7 L/kg) [20, 26, 30, 31, 33, 36]. The typical value for vancomycin CL in this study was determined to be 0.24 L/h, which falls within the range of average CL rates reported in previous literature (0.05 to 0.538 L/h) [16, 30, 31, 33, 35, 36, 38, 43]. Additionally, the interindividual variability in CL (33.66%) observed in this study is in line with the results reported in other vancomycin models (ranging from 21% to 61.92%) [29–31, 33, 43].
This study investigated various covariates influencing vancomycin CL in neonatal patients and ultimately determined that neonatal vancomycin CL can be predicted using BW, GA, CLcr, and sex. Multiple published neonatal models have demonstrated significant covariates for vancomycin CL, including birth weight, serum creatinine levels, PMA, and PNA [25–38]. As vancomycin primarily undergoes renal CL, the maturation of the kidneys significantly impacts its CL. In prior studies, SCr was the primary indicator used to reflect renal function and was incorporated into neonatal vancomycin PPK models [25, 29, 31, 33, 38]. Indeed, neonatal renal function is influenced by a multitude of factors, and common indicators have limitations in accurately assessing renal function in newborns. For instance, SCr is susceptible to various factors, including maternal creatinine levels at birth, muscle mass, and age [44, 45]. Notably, preterm infants exhibit an unstable trend in SCr [46]. Similarly, the accuracy of CLcr, calculated based on creatinine concentration and patient height, can be influenced by the dynamic physiological changes that typify the neonatal period [45]. In our study, the impact of CLcr on vancomycin CL (ΔOFV = −32.41) was more pronounced compared to that of SCr (ΔOFV = −27.14), suggesting that CLcr may be better suited for reflecting changes in vancomycin CL. With the increase in CLcr, there is a concurrent elevation in vancomycin CL. Consistent with preceding investigations, the study unveils an accelerated vancomycin CL in tandem with augmented BW and increased GA [29–36]. For neonates, BW and GA are closely linked to renal development, which offers a plausible rationale for the observed influence of BW and GA on vancomycin CL [47].
Furthermore, our study identifies sex as a significant covariate influencing vancomycin CL in neonates. In contrast to previous research, female patients exhibit higher vancomycin CL compared to males [48]. This phenomenon might be related to factors such as body fat content and hormonal regulation within the female physiology, although the specific reasons necessitate further investigation [49]. However, it should also be acknowledged that the potential for bias in the results due to the limited sample size of this study cannot be ruled out. In prior investigations, the majority of studies did not identify significant influences of concomitant medication on vancomycin pharmacokinetic parameters [16, 25, 26, 28–31, 33–38]. Previously, it has been observed that amoxicillin and clavulanate may be associated with an increase in CL, while ibuprofen, dopamine, spironolactone (positive inotropic drugs), and positive pressure ventilation are potentially linked to a decrease in CL and volume of distribution of vancomycin [23, 27, 43, 50]. Yang et al. investigated the four antibiotics (meropenem, fluconazole, cefoperazone/sulbactam, and imipenem/cilastatin) most frequently coadministered with vancomycin and reported that the concurrent use of meropenem was associated with an increased CL of vancomycin [51]. This study also explored the potential impact of concomitant medications on vancomycin CL, including human serum albumin, meropenem, and diuretics, which accounted for more than 20% of the total cases. However, we did not observe significant effects of these concomitant medications on vancomycin CL. This may be attributed to either the limited number of cases or the relatively subtle influence of concomitant medication.
Regarding vancomycin dosage regimens, guidelines recommend administering 10–15 mg/kg per dose to neonates, with dosing every 12 h for those under 1 week of age and every 8 h for neonates aged 1 week to 1 month, with each infusion lasting more than 60 min. To individualize vancomycin dosing, our study performed simulations of dosing regimens in neonatal patients with representative clinical characteristics. Model simulations targeting an AUC24 of 400 mg × h/L revealed that neonates with renal impairment (CLcr = 30 mL/min) required doses lower than 10 mg/kg. However, when the simulated AUC24 reached 650 mg × h/L, the necessary dose exceeded 15 mg/kg, potentially increasing the risk of nephrotoxicity [10].
4.2. Deficiencies of the Study
- 1.
Trial design considerations: Sparse sampling points featuring exclusively through concentrations constrain the precision of estimating apparent volume of distribution.
- 2.
Sample size constraints: The study’s statistical robustness is somewhat curtailed due to a relatively diminutive sample size, incorporating a modest cohort of merely 75 subjects.
- 3.
External validation omission: A notable absence in the study pertains to the absence of external validation with independent datasets, which warrants future endeavors to ascertain the model’s generalizability and reliability.
5. Conclusion
In summary, our study has developed a PPK model that demonstrates a significant impact of neonatal patient BW, GA, creatinine CL, and sex on the CL rate of vancomycin. The apparent distribution volume was corrected using BW. The final PPK model exhibits satisfactory stability and predictive capability. This model holds promise for facilitating the development and adjustment of personalized vancomycin dosing regimens in clinical practice.
Ethics Statement
All procedures performed in studies involving human participants were in accordance with the ethical standards of the institutional and/or national research committee and with the 1964 Helsinki Declaration and its later amendments or comparable ethical standards and approved by the Ethics Committee of Yinchuan First People’s Hospital (ID: KY-2023-065). Written obtained informed consent was from the individual(s) for the publication of any potentially identifiable images or data included in this article.
Conflicts of Interest
The authors declare no conflicts of interest.
Author Contributions
C.Y., S.M., and D.X. conceived and designed the study. C.Y., S.M., B.W., and S.W. designed the statistical analysis and extracted data. C.Y., S.W., Z.Z., and S.M. performed the analysis, and drafted and revised the manuscript. S.M. and D.X. supervised the quality of the study. All authors read and approved the final manuscript. C.Y. and S.W. contributed equally to this work and should be considered co-first authors.
Funding
This research did not receive any specific grant from funding agencies in the public, commercial, or not-for-profit sectors.
Acknowledgments
The authors thank all the patients and authors who participated in this study.
Open Research
Data Availability Statement
The raw data supporting the conclusion of this article will be made available by the authors, without undue reservation.


