Estimation of Growth Performance of Crassostrea virginica in a Recirculating Aquaculture System (RAS) in Cox’s Bazar, Bangladesh: A Case Study
Abstract
The current study was conducted at the Bangladesh Fisheries Research Institute in Cox’s Bazar, from February 2023 to April 2024. Oyster (Crassostrea virginica) growth and survival rate were studied in a recirculating aquaculture system (RAS). The study also evaluated the impact of various water parameters (viz., temperature, pH, dissolved oxygen [DO], salinity, alkalinity, nitrite, nitrate, and ammonia) on oyster development. Oysters were cultivated in T1, T2, and T3 using two replications for each treatment. RAS was used with continuous aeration throughout the two treatments (T1 and T2), while non-RAS continuous aeration was given during the control treatment (T3). 50, 60, and 55 oysters were presented in three treatments. Three distinct marine microalgae (Nannochlorum spp., Tetraselmis spp., and Nannochloropsis spp.) were added to tanks for feeding oysters. Statistically significant differences (p < 0.05) were found in the T1 therapy group, which had the highest specific growth rate per day (0.119%) and survival rate (92.85%), followed by T2 (87.5%) and T3 (77.5%). In addition, first treatment (T1) continuously measured the largest weight (36.08 g), length (6.51 cm), and width (6.43 cm); however, T2 showed a significant depth rate (4.44 cm). Optimum oyster population, salinity (29.5 ppt), pH (7.25), DO (5.12), temperature (30.75°C), and other water quality indicator levels displayed a significant correlation with oyster growth performance for the T1 group rather than T2 and T3. However, the T2 group was also treated under RAS circumstances. The findings demonstrated that RAS can significantly enhance oyster growth and survival-controlling water indicators, which provide valuable insights for sustainable aquaculture practices in the coastal areas of Bangladesh.
1. Introduction
The southeast coastal region of Bangladesh, known for its profusion of marine bivalves, is located in Cox’s Bazar. The four main bivalve groups are mussels, windowpane oysters, edible oysters, and clams, listed in order of abundance [1]. Approximately 317 mollusks have been found in Bangladesh till now, of which 125 species belong to 19 families of bivalves [2]. Worldwide, bivalve species are highly significant economically. One example is the expensive pearl goods that are produced from pearl oysters. In addition, fish, poultry, shrimp, and lime are prepared using mollusks, including oysters [3].
Oysters are highly nutrient-dense, edible mollusks that contain many vital nutrients, including vitamin B12, omega-3 fatty acids, and minerals. Moreover, several minerals support increased oxygenation and blood circulation while lowering blood pressure [4]. The oyster farming system depends on several environmental factors that need to be considered particularly salinity, temperature, and the availability of food [5]. Among other elements, oyster growth and other physiological processes are regulated by salinity [6]. Additionally, the growth of shells is seriously disrupted by pH levels both excessively low and too high [7–9]. Likewise, the variation in the water’s dissolved oxygen (DO) content has also impacted the growth and development of oysters both individually and as a population [10]. The rate of eating, breathing, gonadal development, and spawning possession of oysters are all frequently impacted by temperature fluctuation [11].
Surprisingly, in mitigating environmental drawbacks, the recirculating aquaculture system (RAS) is expanding in popularity due to its outstanding efficacy in boosting larval development while reducing water usage [12, 13]. In a nutshell, RASs were established as a technique for intensive fish farming, allowing for 90%–99% water recycling. These systems make the most optimal conditions for fish production possible, which gives the operator precise control over the environmental and water quality parameters [14]. RAS is utilized in indoor tank-based systems for fish farming when biofiltration is necessary to lower ionization and ammonia levels [15]. Furthermore, it enhances the opportunities for the prevention and control of diseases, biological pollution control, improved hygienic conditions, waste management, and finally easy utilization of nutrients for growth and development [16].
Regrettably, Bangladesh is still lagging in the cultivation and export of oysters, despite the enormous demand for them as foods and ornaments. Although it is not commonly consumed by humans in Bangladesh, it is the most economically demanding farm for other agricultural industries. Nowadays, the government and a few private organizations are currently working in this area, but the progress is not economically viable. From this point of view, it is crucial to research oyster growth performance to cultivate oysters successfully. However, still, now there is no research work available in this arena in Bangladesh, where the growth performance of adult oysters has been observed in the RAS. Therefore, the eastern oyster (Crassostrea virginica) was selected to evaluate the growth performance and survival rates (SRs) of oysters and to investigate the impact of key water quality parameters on oyster growth and health in the RAS. Additionally, this study offered guidance on where to choose to harvest oysters based on the assessment of water quality indicators (temperature, pH, DO, salinity, alkalinity, nitrite, nitrate, and ammonia) as well as mitigating the environmental effects on oyster’s growth using RAS.
2. Materials and Methods
2.1. Study Area
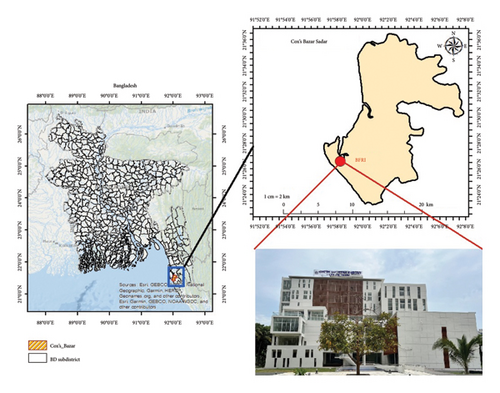
Before designing the experimental setup, a preliminary survey was conducted in the chosen location. The experiments (open culture and RAS culture) were carried out at Bangladesh Fisheries Research Institute (BFRI) in Cox’s Bazar, Bangladesh (Figure 1), for the duration of 14 months, from February 2023 to April 2024, and the trial was extended for 90 days.
2.2. Experimental Setup
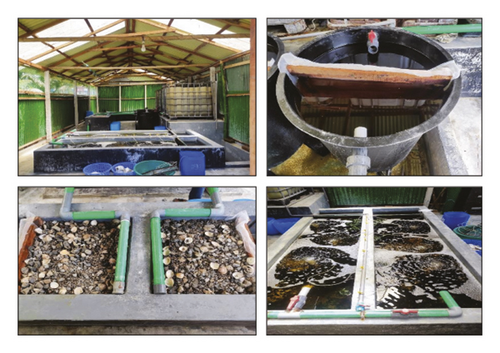
Two replications were carried out after the experiment having two treatment groups and one control group. Circular tanks and other filtration elements were included in the arrangement to maintain the optimal water quality indicators for oyster culture (Figure 2).
2.3. System Components and Setup
2.3.1. 1000-L Rectangular Tanks
A set quantity of oysters was added to each tank. The symmetrical design of the tanks helped to ensure uniform water flow and avoid dead zones. Using automated sensors, the water quality parameters (viz., pH, DO, temperature, and salinity) were continuously monitored and maintained.
2.3.2. Clarifiers (600 L)
600-L clarifiers were employed to remove solid waste from the oyster tanks. The solids were separated from the water by gravitational settling in the clarifiers, which received water from the oyster tanks. To keep the clarifiers efficient and avoid blockage, routine cleaning and maintenance were carried out during the experiment.
2.3.3. Biofilter
Biofilters (mechanical and biological) were employed to speed up the nitrification process and turn ammonia hazardous waste products into nitrate. The media in these filters were sustained nitrifying bacterial colonies. The biofilters were made of bacteria, where the water from the clarifiers was passed through to change ammonia into less harmful nitrate. To guarantee that the bacteria had an adequate supply of oxygen, which was necessary for their metabolic activities, the biofilters were aerated frequently.
2.3.4. Degassing Chamber
Water was treated with degassing chambers to eliminate dissolved gases like carbon dioxide. The water flowed into the degassing chambers, where it was aerated to remove extra dissolved gases, after going through the biofilters. To optimize gas exchange efficiency and guarantee that no hazardous gases were released into the water returning to the oyster tanks, the chambers were constructed with baffles.
2.3.5. Plant Filters (700 L)
For further filtration and nutrient uptake, seaweed-containing plant filters were employed. A 700-L capacity filters were filled with appropriate seaweed species that had been chosen based on their rate of development and ability to absorb nutrients. Nitrates and other nutrients from the water were absorbed by the seaweed, adding to the biofiltration process and enhancing system health.
2.3.6. Reservoir Tanks (500 L)
Water was stored and circulated throughout the system using 500-L reservoir tanks. The treated water from the degassing chambers and plant filters was collected in reservoir tanks and then cycled back to the oyster tanks. To guarantee constant circulation and avoid system interruptions, the reservoir tanks’ water levels were kept at the appropriate levels. For the control, there were a stocking tank of 1000 L and a plant filter of 700 L. There was no RAS in the control. The stocking tanks and the plant filter were kept under aeration all the time.
2.4. Oyster Collection and Stocking
Around 150 oysters (Crassostrea virginica) were collected from the Kutubdia Channel, Khurushkul Union of Cox’s Bazar, weighing 30 ± 2.0 g per oyster. The oysters were divided among the six culture tanks Treatment 1 (T1), Treatment 2 (T2), and control in 24 h. Then, oysters were taken from the culture tank to measure length once a month. Three different stocking techniques were employed in this study to evaluate the oysters’ growth performance. For the first treatment (T1), 50 oysters were distributed equally between two rectangular tanks (each holding 1000 gallons). Regarding the second treatment (T2), 60 oysters were split equally between two rectangular tanks. Lastly, the control (T3) consisted of 55 oysters kept in a circular tank with constant aeration throughout the day. This experimental setup assesses the growth rates and psychological condition of oysters in tanks with varying densities and shapes to determine the optimal conditions for oyster production.
2.5. Feeding of Oysters
To feed oysters in the RAS, three distinct species of marine microalgae were added (Nannochlorum spp., Tetraselmis spp., and Nannochloropsis spp.). To propagate each species, eight, 800-L conical bottom tanks with internal culture stocks were employed. Each culture tank was divided into half, and 3 L of live feed was included in each half each day. During feeding times, aeration was halted to reduce disruption and ensure that the oysters were consumed as efficiently as possible. After feeding, 30 min of aeration was added to maintain the water’s quality and oxygen content, which were indispensable for the oysters’ growth.
2.6. Monitoring Water Qualities
The growth of oysters was measured every 15 days. Water parameters such as DO (mg/L), pH, salinity (ppt), and temperature (°C) were measured using a hand-held refractometer (ATAGO), a pH meter (SUNTEXTS-1), a DO meter (LUTRONY22DO), and a thermometer (°C).
2.7. Growth Monitoring
A digital caliper was used to measure the shell’s length followed by [17]. Meanwhile, a digital scale with an accuracy of 0.1 g was used to determine the overall weight of oysters.
2.7.1. Weight Gain Measurement
2.7.2. Length and Depth Gain Measurement
2.7.3. Calculation of Specific Weight Growth Rate (SGR)
2.7.4. Measurement of SR
2.8. Data Analysis
ANOVA was performed to analyze all of the variance. Duncan’s test was used to compare the treatment means and analyze the significance of the variation between them. All statistical analyses were conducted using MS EXCEL 2020 and SPSS software.
3. Results
3.1. Growth Performance of Oyster
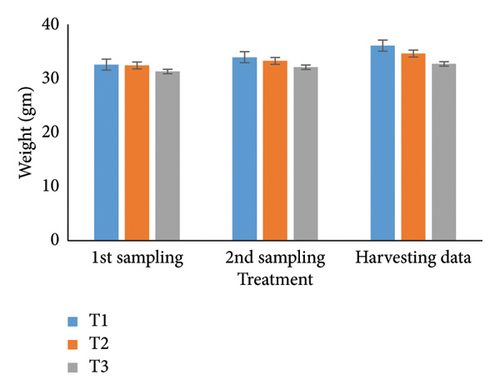
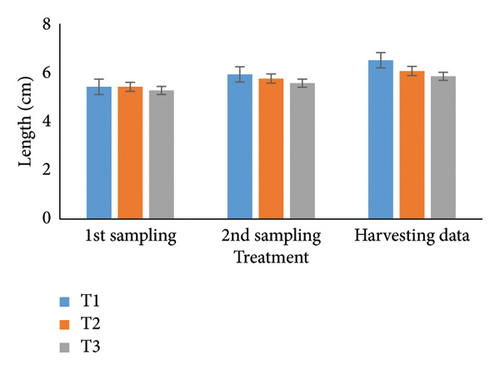
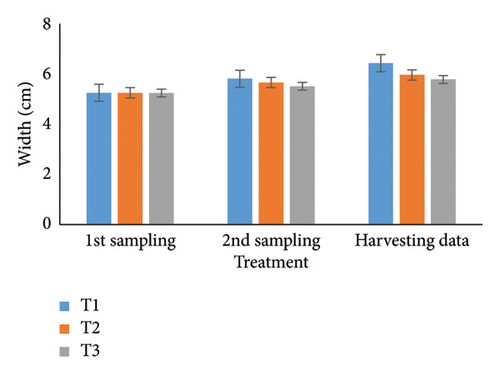
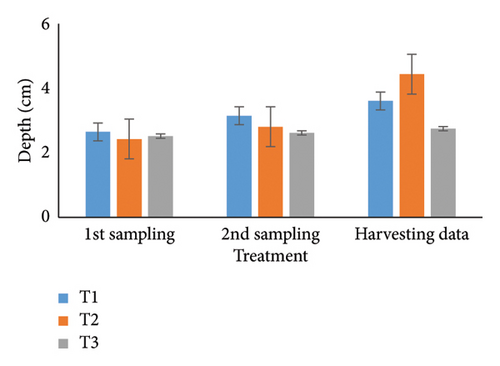
Over 90 days, oysters’ weight, length, width, and depth were examined and studied for each of the three treatments. Individual growth and SRs were also estimated. The most favorable parameters for oyster development and survival in aquaculture systems were determined in part by this recent finding. During the stocking period, the weight of the oyster varied a little among the three treatments (Table 1); however, there were no notable changes seen between the first and second samplings. It was significant that throughout peak time, there were noticeable variations in weight at the 5% level. T1 consistently reported the highest weight (36.08 g), followed by T2 (34.61 g) and T3 (32.70 g). Then, at stocking, the oyster length (Table 2) and width (Table 3) in groups T1, T2, and T3 were comparable but not significantly different (p < 0.05) from one another. Oysters treated with T1 had the longest length (6.51 cm) after 3 months, followed by T2 (6.07 cm) and T3 (5.85 cm). Similarly, oysters of the first treatment displayed the largest width than others (T2: 5.96 cm; T3: 5.78 cm). Initial measurements of oyster depth for T1, T2, and T3 showed no apparent variations, which is explained in Table 4. Interestingly, noticeable variations were observed between the first and second samplings, which were significantly different (p < 0.05). Ultimately, the oyster group T2 (4.44 cm) experienced the maximum depth, next to T1 (3.61 cm) and T3 (2.75 cm), respectively.
| Sampling data/month | Weight (g) | Significance | LSD(0.05) | CV (%) | p value | ||
|---|---|---|---|---|---|---|---|
| T1 | T2 | T3 | |||||
| Stocking data | 32.35 ± 0.36a | 31.89 ± 0.58a | 31.09 ± 0.09a | NS | 8.03 | 0.28 | 0.07 |
| 1st sampling | 32.57 ± 0.38a | 32.41 ± 0.52a | 31.29 ± 0.19a | NS | 9.88 | 0.26 | 0.06 |
| 2nd sampling | 33.94 ± 0.22a | 33.25 ± 0.55b | 32.07 ± 0.06c | ∗ | 2.52 | 0.47 | 0.03 |
| Harvesting data | 36.08 ± 0.18a | 34.61 ± 0.37b | 32.70 ± 0.18c | ∗ | 3.23 | 0.47 | 0.04 |
- Note: Here, data are expressed as mean ± SD, and asterisk (∗) indicates significant difference (p < 0.05). Values bearing different superscripts in the same row vary significantly.
- Abbreviations: CV, coefficient of variation; LSD, least significant difference; NS, not significant.
- a,b,cshow the significance of the data by the post hoc analysis test (Tukey’s test).
| Sampling data/month | Length (cm) | Significance | LSD(0.05) | CV (%) | p value | ||
|---|---|---|---|---|---|---|---|
| T1 | T2 | T3 | |||||
| Stocking data | 5.11 ± 0.11a | 5.29 ± 0.13a | 5.26 ± 0.07a | NS | 0.96 | 1.92 | 1.12 |
| 1st sampling | 5.42 ± 0.30a | 5.42 ± 0.18b | 5.27 ± 0.03c | ∗ | 0.65 | 0.68 | 0.03 |
| 2nd sampling | 5.93 ± 0.03a | 5.76 ± 0.03a | 5.57 ± 0.08a | NS | 0.37 | 0.45 | 0.08 |
| Harvesting data | 6.51 ± 0.04a | 6.07 ± 0.20b | 5.85 ± 0.07c | ∗ | 0.32 | 0.72 | 0.02 |
- a,b,cshow the significance of the data by the post hoc analysis test (Tukey’s test).
| Sampling data/month | Width (cm) | Significance | LSD(0.05) | CV (%) | p value | ||
|---|---|---|---|---|---|---|---|
| T1 | T2 | T3 | |||||
| Stocking data | 4.98 ± 0.03a | 4.99 ± 0.34a | 5.11 ± 0.06a | NS | 0.34 | 0.98 | 0.06 |
| 1st sampling | 5.25 ± 0.22a | 5.25 ± 0.24a | 5.24 + 0.03a | NS | 0.54 | 1.08 | 0.07 |
| 2nd sampling | 5.81 ± 0.12a | 5.66 ± 0.12a | 5.51 ± 0.08a | NS | 0.43 | 1.55 | 0.08 |
| Harvesting data | 6.43 ± 0.02a | 5.96 ± 0.18b | 5.78 ± 0.07c | ∗ | 2.3 | 1.18 | 0.02 |
- a,b,cshow the significance of the data by the post hoc analysis test (Tukey’s test).
| Sampling data/month | Depth (cm) | Significance | LSD(0.05) | CV (%) | p value | ||
|---|---|---|---|---|---|---|---|
| T1 | T2 | T3 | |||||
| Stocking data | 2.47 ± 0.33a | 2.22 ± 0.01a | 2.44 ± 0.04a | NS | 2.64 | 0.58 | 0.08 |
| 1st sampling | 2.65 ± 0.07b | 2.43 ± 0.09a | 2.52 ± 0.02c | ∗ | 0.61 | 1.39 | 0.04 |
| 2nd sampling | 3.15 ± 0.07b | 2.81 ± 0.07a | 2.62 ± 0.02c | ∗ | 0.75 | 0.82 | 0.01 |
| Harvesting data | 3.61 ± 0.12a | 4.44 ± 1.56a | 2.75 ± 0.16a | NS | 2.82 | 1.52 | 0.07 |
- a,b,cshow the significance of the data by the post hoc analysis test (Tukey’s test).
3.2. Determination of SGR of Oysters
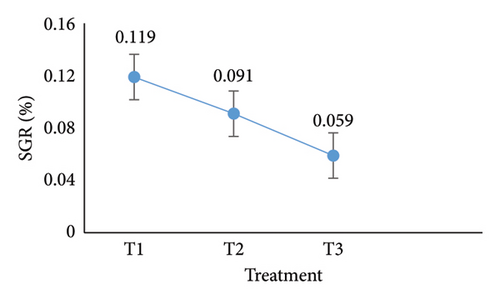
Over 90 days, from the first sampling to the last data collection, the experiments estimated the oysters’ SGR revealed significant variations across the three treatments (T1, T2, and T3) (Figure 3(e)). At the end, T1 had the greatest SGR percentage per day (0.119%) compared to T2 (0.091%) and T3 (0.059%). Oysters in T1 grew faster under the RAS, according to statistical analysis, which verified that these differences were significant at the 5% level. Without RAS, on the other hand, T3 had the slowest development rate, suggesting less ideal circumstances. The significance of comprehending and optimizing environmental elements and oyster population to improve oyster development and total aquaculture yield was underscored by the results.
3.3. Estimation of SR (%)
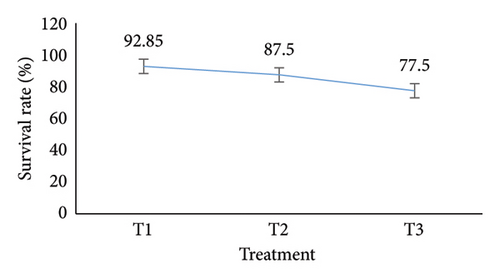
The number of oysters that survived in the last month of the experiment compared to the original number at the beginning of the trial allowed researchers to calculate the oyster SR across three treatments. The SR was calculated using the methodology described in [18]. At first, the treatment did not differ much from one another. Significant changes were observed, however, surface by the first sample to the harvesting phase. With an SR of 92.85, T1 had the greatest rate, followed by T2 (87.5) and T3 (77.5) (Figure 3(f)).
3.4. Measurement of Water Quality Parameters
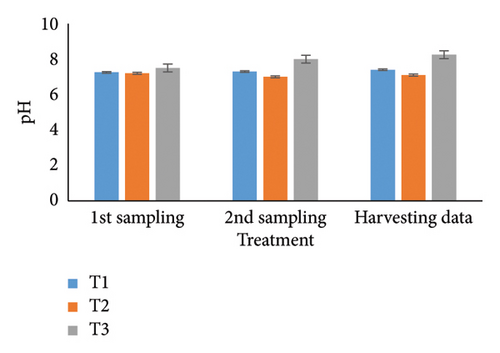
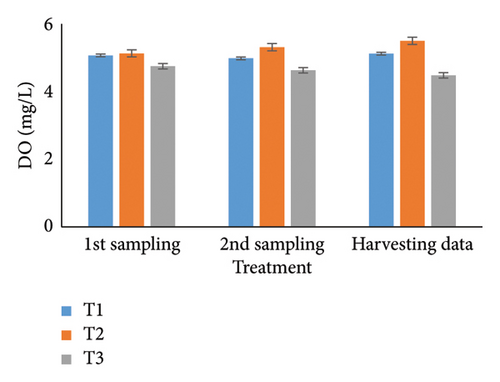
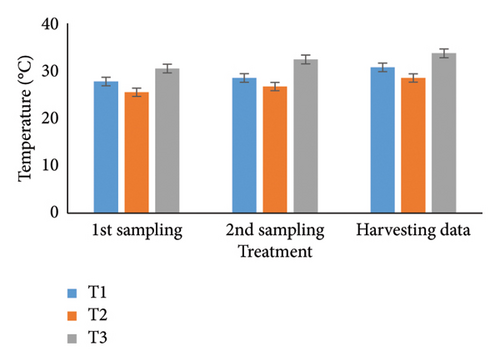
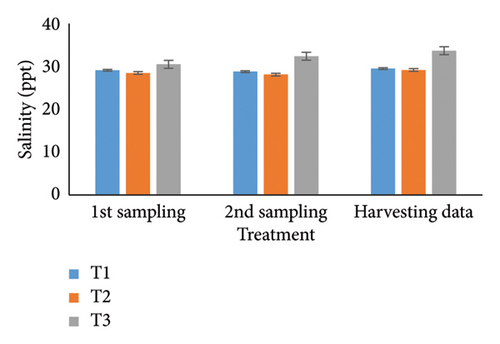
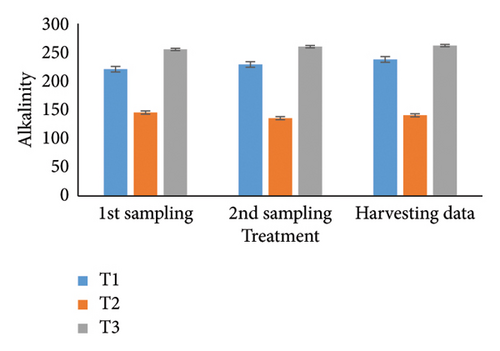
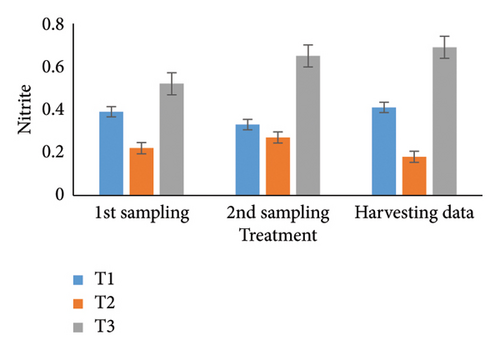
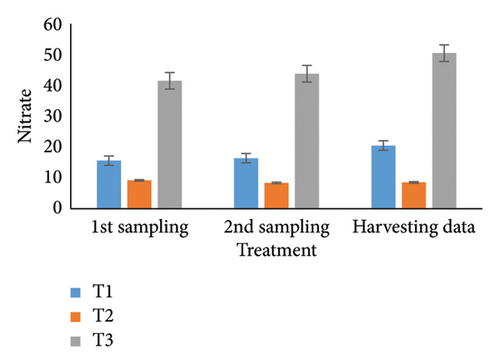
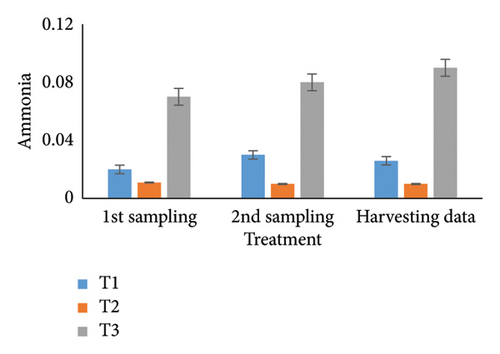
Observing water quality parameters was crucial for oyster culture because oysters were highly sensitive to their environment. Therefore, this research was focused on water quality parameters to investigate the relationship between oyster growth and environmental factors. Temperature, DO, salinity, pH, nitrate, nitrite, alkalinity, and ammonia concentrations are presented in Tables 5 and 6. Three treatments had initial pH values of 7.25, 7.2, and 7.5; throughout the harvesting time, these values changed to 7.4, 7.1, and 8.25. There were no significant differences between the two times. In the first sampling, three treatments demonstrated DO levels of 5.07, 5.13, and 4.75; the second treatment had the highest value. Ultimately, the value increased for T1 (5.12) and T2 (5.5) but declined for the control treatment (4.48). Previous studies have shown that low salinity reduces the rate of species survival by delaying larval growth [19, 20]. The current study showed that salinity levels were 29.1, 28.5, and 30.5 ppt for T1, T2, and T3 during the first month. During the harvesting time, the salinity levels were 29.5, 29.2, and 33.7 ppt, with no significant differences. Temperature was another important factor in oyster culture since it influences the filtration activity of the oysters. T1, T2, and T3 had initial temperatures of 25.5°C, 30.5°C, and 27.75°C, respectively. All treatments recorded temperatures of 30.75°C, 28.5°C, and 33.7°C during the picking period, with a significance level of 5%. There were no appreciable variations in the initial alkalinity levels for T1, T2, and T3 (220.75, 145.25, and 255.25 mg/L). Levels at the end of the data collecting period were 237.75 for T1, 140.5 for T2, and 262.00 for T3; however, there were no significant differences. Treatments T1, T2, and T3 had initial nitrate levels of 15.6, 9.2, and 41.5 mg/L, respectively, with treatment T3 (control) having the highest nitrate level. The nitrate levels finally fluctuated to 20.5, 8.5, and 50.5, with notable variations. In the beginning, the nitrite concentrations were 0.39, 0.22, and 0.52 mg/L for all three treatments. The results have varied to 0.41, 0.81, and 0.69 over the last month, indicating a 5% significant difference. In the initial phase of sampling, the ammonia levels in T1, T2, and T3 were 0.02, 0.011, and 0.07 mg/L. Levels for T3, T2, and T1 were 0.09, 0.01, and 0.026 during the harvesting period. There were no notable variations between the two circumstances.
| Sampling data/month | pH | DO (mg/L) | Salinity (ppt) | Temperature (°C) | ||||||||
|---|---|---|---|---|---|---|---|---|---|---|---|---|
| T1 | T2 | T3 | T1 | T2 | T3 | T1 | T2 | T3 | T1 | T2 | T3 | |
| 1st sampling | 7.25 ± 1.12a | 7.2 ± 1.13a | 7.5 ± 1.16a | 5.07 ± 0.44b | 5.13 ± 0.25a | 4.75 ± 0.13c | 29.1 ± 1.06b | 28.50 ± 0.70a | 30.5 ± 0.71c | 27.75 ± 1.06a | 25.5 ± 0.71a | 30.5 ± 0.71a |
| 2nd sampling | 7.3 ± 2.94b | 7.0 ± 1.18a | 8.0 ± 3.28c | 4.98 ± 0.40b | 5.31 ± 0.24a | 4.63 ± 0.33c | 28.8 ± 0.71a | 28.1 ± 0.35a | 32.4 ± 0.71a | 28.5 ± 0.70b | 26.7 ± 0.35a | 32.4 ± 0.72c |
| Harvesting data | 7.4 ± 5.55a | 7.1 ± 4.16a | 8.25 ± 3.81a | 5.12 ± 0.26a | 5.5 ± 0.45a | 4.48 ± 0.38a | 29.5 ± 0.35a | 29.2 ± 0.71a | 33.7 ± 1.06a | 30.75 ± 0.35b | 28.5 ± 0.70a | 33.7 ± 1.06c |
- a,b,cshow the significance of the data by the post hoc analysis test (Tukey’s test).
| Sampling data/month | Alkalinity (mg/L) | Nitrite (mg/L) | Nitrate (mg/L) | Ammonia (mg/L) | ||||||||
|---|---|---|---|---|---|---|---|---|---|---|---|---|
| T1 | T2 | T3 | T1 | T2 | T3 | T1 | T2 | T3 | T1 | T2 | T3 | |
| 1st sampling | 220.75 ± 2.47a | 145.25 ± 1.76a | 255.25 ± 1.76a | 0.39 ± 0.03a | 0.22 ± 0.01a | 0.52 ± 0.02a | 15.6 ± 0.02a | 9.2 ± 0.01a | 41.5 ± 0.01a | 0.02 ± 0.01a | 0.011 ± 0.01a | 0.07 ± 0.02a |
| 2nd sampling | 229.00 ± 2.82b | 135.5 ± 7.07a | 260.00 ± 7.07c | 0.33 ± 0.003a | 0.27 ± 0.01a | 0.65 ± 0.09a | 16.4 ± 0.08a | 8.4 ± 0.05a | 43.8 ± 0.01a | 0.03 ± 0.04b | 0.01 ± 0.01a | 0.08 ± 0.02c |
| Harvesting data | 237.75 ± 1.76a | 140.50 ± 0a | 262.00 ± 0.00a | 0.41 ± 0.03b | 0.18 ± 0.03a | 0.6875 ± 0.03c | 20.5 ± 0.03a | 8.5 ± 0.03a | 50.5 ± 0.02a | 0.026 ± 0.01a | 0.01 ± 0.01a | 0.09 ± 0.03a |
- a,b,cshow the significance of the data by the post hoc analysis test (Tukey’s test).
4. Discussion
The results of the present study indicated that the SRs were the best in treatment T1, which was 99.85% (Figure 3(f)), and its length, width, and depth increased at average rates of 1.4, 1.45, and 1.14 cm after 3 months of culture, respectively (Figures 3(b) and 3(d)). In the meantime, the mean oyster mass was 3.73 g during harvesting time (Figure 3(a)), and the final weight was 36.08 g for the T1 treatment group. Comparably, among the treatments, the first treatment had the highest percentage of SGR per day (0.119%) (Figure 3(e)). In the past, oysters were cultivated in Levon screen bags and rectangular baskets. According to [21], the group using the rectangular baskets showed a slightly higher SGR per day (0.09%) than the group using the velon screen bag per day (0.007%). However, the oysters’ SGR varied greatly between sites, ranging from 0.12% at Thaladuwa to 0.48% in Pitipana in Sri Lanka each day [22]. After the floods in September of 2014, the highest SGR figure was discovered in December of the same year because the growth rate depends on the season [23]. The growth rates of suspension feeders were reduced in the summer when temperatures were high, even though the SGR was not temperature-related [24]. Mollusks in Onega Bay had a nearly twofold lower linear growth rate than those in Kandalaksha Bay. Compared to oyster species (Ostrea edulis and Magallana gigas), the patterns of variability in soft tissue and shell development rates were more complicated in blue mussel (Mytilus edulis) growth [25]. In suspension culture, oyster spat reached 5.56-cm shell height (SH) on the convex surface, with an SR of 47.45%; however, it achieved 5.59-cm SH on the concave surface, with an SR of 46.73% [26]. Overall oyster SR was still more than 99%, and the average weekly growth for length, width, and thickness was 1.3, 1.1, and 0.33 mm, respectively. The weekly average mean weight was 0.39 g [27]. Then, Saccostrea cucullata’s initial figures of 8.8 cm and 153.4 g were exceeded by 9.1 cm and 163.2 g, respectively, after 4 months in the rectangular basket. This finding is in good agreement with the previous researcher [21].
According to [27], growth data of oysters put in the field with similar initial size is comparable, and in some cases, better than the 1.4 cm per month growth in length demonstrated here. Over the first 13 months, the Cortez oyster (C. corteziensis) grows its shell isometrically, measuring 71.3 mm in length, 52.6 mm in thickness, and 25.1 mm in width. There was shown to be allometric growth (SR 70%) between total weight and length, thickness, and width [28]. Over the first 8 months (April to December), oysters were grown to an average size of 71 mm, reaching a maximum size of 75.8 mm in the final month (March) [29]. The average length was 19.58 mm at the start of the trial in November 2017, and it climbed to 43.77 mm 12 months later in October 2018 which proved that SGR was excessive in January and February for small-sized mussels [30]. The mussels in Çanakkale Strait that were studied had a mean length of 20.72 mm at the start of their study, and after 12 months, their mean length had increased to 56.75 mm [31]. All things considered, the latest study found that RAS is the most suitable aquaculture method for speeding oyster growth and the ideal medium for a greater SR.
The current study showed the acceptable ranges of water quality parameters under RAS, which assisted in accelerating the oyster’s weight, length, width, and depth as well as the highest SR. When C. virginica oysters were cultivated under RAS, the maximum values of alkalinity, DO, nitrate, nitrite, pH, salinity, temperature, and ammonia were 3.19, 7.67, 22.00, 1.90 mg/L, 8.61, 24.00 g/L, 26.5°C, and 0.94 mg/L, respectively [27]. Three locations in Bangladesh, Nunia Chara, Chowfoldandy, and Sonadia Island, were used to rear edible oyster Crassostrea spp. The average salinity, temperature, and pH varied from 20.3 to 27.8 g/L, 26.9°C to 27.4°C, and 7.4 to 7.7 [32]. Reference [33] reported that the temperature at two places in Cox’s Bazar ranged from 27.35°C (Nunia Chara) to 27.67°C (Sonadia), which was ideal for the growth and recruitment of oyster spats. Additionally, the authors in [33] measured the salinity (21.64–26.33 ppt), DO (6.52–6.99), and pH (7.38–7.50), indicating that their study areas were suitable for oyster culture. For the oyster population to thrive and generate progeny, the pH must be lower than 9 [34]. pH is a vital element of both oyster populations and aquaculture worldwide since changing and declining pH values jeopardize oyster development and have detrimental impacts on human health [35, 36]. For 8 months (December to July), West African mangrove oysters (C. tulipa) were cultivated using bottom culture and suspension techniques in Ghana where the water temperature, pH, DO, salinity, and nitrate differed between 26.37 and 29.50°C, 7.18 and 8.82, 0.63 and 6.53 mg/L, 0.20%–40.33%, and below detection point (BDP) to 18.87 mg/L [26]. Five different locations in Sri Lanka were used to cultivate C. madrasensis. The water temperature varied from 26.77 to 27.06°C, the salinity ranged from 13.29% to 20.86%, the pH ranged from 7.18 to 8.38, the DO fluctuated from 5.89 to 7.73 mg/L, the nitrite concentrations varied from 0.003 to 0.11 mg/L, and the ammoniacal nitrogen concentration differed from 0.105 to 0.368 mg/L [22]. Furthermore, the authors in [37] reported that the highest salinity for Perna viridis in the Moheshkhali channel was 29.8 ppt, while the authors in [38] found that the largest DO level for mussel culture in North Khurshukul, Cox’s Bazar, was 6.1–7.0 mgL−1. Similarly, it was important to have DO at least 3.2 mg/L (mgL−1) because lower levels of DO were responsible for closing the shell; however, 5.5 mg/L or more is preferred [39].
For a year, the growth response of C. madrasensis was examined in suspended culture, where seasonal fluctuations were detected in salinity (> 1–35.6 ppt), DO (5.67–7.37 mg/L), temperature (27.3°C–30.9°C), and pH (6.0–8.05) [29]. The pH value (Figure 4(a)) obtained from the current experiment was comparable with the previously mentioned research [22, 26, 29, 32, 33]. At peak time, the first and second treatments (pH: 7.4 and 7.1) experienced the greatest development of oysters compared to the control treatment (pH: 8.25). The two treatment groups growing under RAS witnessed the DO concentrations (5.12 and 5.5) during the harvesting phase (Figure 4(b)). However, the aforementioned authors reported a higher DO level [22, 29, 33, 38] than the present study, while the authors in [26] estimated a more or less similar value. In this investigation, C. virginica recorded the maximum growth rate during the first treatment at a water temperature of 30.75°C (Figure 4(c)); this value was greater than that of the other studies [22, 27, 32, 33]. Notably, the obtained value was identical to the findings of [29]. Additionally, the salinity level (29.5 ppt) of T1 was higher than that in the earlier research [22, 27, 32, 33] but similar to [29, 37], which was the appropriate salinity level for C. virginica cultivation (Figure 4(d)). This experiment examined the lower level of alkalinity (Figure 4(e)) during the last month for T1 (237 mg/L) and T2 (140.50 mg/L) than [27] though this element has been poorly investigated by other authors. The nitrite concentration varied from 0.33 to 0.41 mg/L from the first sampling to the last in the case of the T1 group (Figure 4(f)); the value was lower than previous values [27]. Similarly, the final nitrate (Figure 4(g)) concentration of T1 (20.5 mg/L) was closer to those reported by the earlier scientists [26, 27]. Finally, ammonia showed the lowest concentrations (between 0.02 and 0.03 mg/L) for T1 among other water elements during the whole experimental period (Figure 4(h)). The current level of ammonia was lower than that observed by previous researchers [27], though it was rarely measured by other authors.
5. Conclusion
According to the present study, the oysters raised in the RAS showed a significant increase in weight, length, width, and depth, with a maximum SR of 99.85%. Indicators of water quality such as salinity, pH, DO, and temperature were all within permissible bounds for oyster farming under RAS. Based on these results, it appears that RAS can sustain oyster farming by preserving consistent environmental conditions throughout the year. This could have advantages over conventional techniques, especially in temperate regions where growth is impacted by seasonal variations. Organic waste buildup and disease proliferation are two issues that the RAS faces, even though its controlled environment makes it easier to monitor and manage the quality of the water. However, the advantages of steady growing conditions and large stocking densities in RAS are a good choice for inland oyster production and a controlled research system.
Conflicts of Interest
The authors declare no conflicts of interest.
Funding
This research work did not receive any funding.
Open Research
Data Availability Statement
Due to restrictions, data will be available upon request from the corresponding author.


