Temperature-Induced Expression Dynamics for the Stress, Appetite and Growth-Related Genes in Nile Tilapia (Oreochromis niloticus)
Abstract
Global climate change significantly influences environmental temperature, affecting the feeding patterns, growth, and overall health of fish. Understanding how fish respond to thermal changes is crucial, particularly for growth and stress response in aquaculture. This study examines the effects of different acclimation temperatures on the expression of stress, appetite, and growth-related genes in Nile tilapia (Oreochromis niloticus). Quantitative real-time PCR method was employed to analyze the expression of genes for growth hormone (gh) from the pituitary, insulin-like growth factors (igf1 and igf2), ghrelin, and heat shock proteins (hsp70 and hsp90) from the liver of juvenile Nile tilapia acclimated to 31°C (control), 34°C, and 37°C for 14 days. Results revealed that the expression of hsp70 and hsp90 as well as the level of blood glucose were significantly upregulated at 37°C in both males and females, indicating a pronounced stress response due to higher acclimation temperature. Conversely, the expressions of gh, igf1, and igf2 were highest at 34°C, stimulating metabolic processes and promoting somatic growth. In comparison, significantly lower expression of these genes was observed at 37°C, suggesting an inhibitory effect of higher temperatures on growth processes. Expression of ghrelin followed a similar pattern to that of GH and IGFs with higher levels at 34°C correlating with increased appetite and growth, but a decreased expression at 37°C, indicating reduced feeding activity resulting from thermal stress. These findings underscore the critical role of maintaining optimal temperatures in aquaculture settings and provide valuable insights into the physiological mechanisms underlying thermal adaptation in Nile tilapia under varying environmental conditions.
1. Introduction
Aquaculture, the farming of aquatic organisms including fish, mollusks, crustaceans, and aquatic plants such as seaweed, has emerged as a critical sector in global food production [1]. Due to the depletion of wild fish stocks and the increasing global demand for protein, this rapid expansion of aquaculture is a crying need. Over the past few decades, this sector has grown exponentially, surpassing wild-capture fisheries to become a major contributor to the food supply [2]. Thus, the recognition of the potentiality of aquaculture to enhance food security and economic development is now profound [3]. The intensification of production systems, the integration of technology for monitoring and managing aquafarms, and a shift toward sustainable practices are some of the current trends in the aquaculture industry [4]. Despite these advancements, aquaculture faces significant challenges, particularly in the context of climate change. Elevated temperatures resulting from chronic climate change can pose a significant challenge to the aquaculture industry, affecting the physiology, growth, and survival of farmed aquatic species [5]. Being ectothermic organisms, the physiological and metabolic processes of fish are directly influenced by the ambient water temperature. Temperature is a key regulator of metabolic activity which exerts an influential role in the ability to survive and physiological processes of all living beings [6]. Warmer water temperatures can accelerate metabolic rates in fish and other aquatic organisms, leading to increased feed consumption, oxygen, and energy demand, while simultaneously reducing dissolved oxygen (DO) levels in the water which can potentially reduce the energy available for growth and reproduction [7] and can also cause stress, increased susceptibility to diseases, and elevate mortality rates [8]. Previous studies demonstrated that temperature-related stress has a significant impact on the biochemical processes, energy metabolism, and growth in fish [9, 10]. In addition, heat stress can impair reproductive functions, reduce fecundity, and affect the overall health and quality of aquaculture products [6]. Therefore, understanding the physiological responses of fish to varied temperatures is crucial for optimizing aquaculture practices and ensuring the sustainability of fish populations in the context of climate change.
It is well known that temperatures beyond the optimal range for a given species can cause stress, suppress the immune system, and increase disease susceptibility [11]. For instance, Atlantic salmon (Salmo salar) is highly temperature-sensitive, with optimal growth occurring at 14−17°C and temperatures above this range can significantly hinder growth and survival [12]. In Nile tilapia, the lowest (CTmin) and upper (CTmax) critical temperatures were 13.1°C and 38.8°C, respectively [13]. Elevated temperatures driven by climate change adversely affect Thai pangas (Pangasianodon hypophthalmus), Nile tilapia, and rohu (Labeo rohita) by inducing growth impairments, hematobiochemical changes, and cellular and nuclear abnormalities in erythrocytes [10, 14, 15]. The physiological functions of aquatic animals may be affected by rising temperatures, which could have both positive and negative consequences on aquaculture production systems, and depending on the species and habitat, temperature tolerance can vary in its regulation of fish physiological functions, including metabolism, growth, and reproduction [9, 14, 16–18]. A small increase in the average temperature during a production cycle may be beneficial to the growth of some cultivable fish species [9, 10, 19, 20]. Under this situation, in-depth studies on the thermal tolerance and acclimatization abilities of different fish species are essential. Such research can help to identify the thermal optima and critical thermal limits for various species which is vital for developing adaptive aquaculture strategies [21]. Moreover, the integration of molecular and genomic tools has advanced the understanding of the genetic basis of thermal tolerance, offering a new platform for enhancing the resilience of aquaculture species through genetic selection and biotechnology [22]. Hence, it is crucial to comprehend the fundamental molecular mechanisms by which environmental temperature (in response to climate change effect) regulates the growth, physiological mechanism, and reproduction in an aquaculture system.
The regulation of fish growth and the developmental process is orchestrated by the somatotrophic axis or hypothalamus–pituitary–liver axis through releasing several hormones including growth hormone (GH) and insulin-like growth factors (IGFs) [23, 24]. At the apex of this axis, a range of internal and external cues, for instance, environmental temperature instigates the hypothalamus to generate pituitary–adenylate–cyclase–activating polypeptide (PACAP) that subsequently activates the pituitary gland to secrete GH [25]. Eventually, pituitary GH exerts its effects through the liver by stimulating the production of IGFs which mediate growth-promoting activities [26, 27]. IGFs impact almost all organ systems and are important for controlling cell division, growth, and survival [28]. The induction of many bioactivities of IGFs, such as cell proliferation, differentiation, and survival, is largely dependent on igf1 receptor signaling pathways [29]. Concordant relations between igf1 levels and growth indicate a positive correlation where higher igf1 levels are associated with increased growth rates [30]. Similar to igf1, igf2 has mitogenic and metabolic effects on fish muscle cells and both IGFs achieve these effects by using the same signaling pathways [31]. In fish, the expression and secretion of GH are highly sensitive to environmental factors, particularly temperature, which is a major determinant of metabolic rates and physiological responses [32]. Thus, it is imperative to evaluate the condition of the GH–IGF system in farmed fish to understand the impact of rearing temperature on its growth and developmental process.
In a changing climatic environment, controlling the consumption of food and managing the energy balance are crucial for animals to ensure they have an adequate amount of energy to sustain their well-being and proper development. Ghrelin, a peptide hormone, has a notable function in the endocrine regulation of energy homeostasis [33]. It stimulates the secretion of GHs by interacting with the GH secretagogue receptor [34]. Ghrelin plays a pivotal role in governing multiple physiological functions in fish, including the triggering of food intake and the regulation of pituitary secretion of hormones. An increase in temperature can lead to changes in the expression of the ghrelin gene, causing it to be elevated or reduced. This alteration in gene expression is ultimately accountable for the decline in appetite and the impaired growth observed in fish [18, 35]. Therefore, the amount and secretion of ghrelin should be evaluated in a changing climate to ascertain whether the overall dietary factors of a fish are stable or not in the aquaculture system.
Heat shock proteins (HSPs) are found across unicellular and multicellular organisms and are essential for proteostasis by acting as molecular chaperones that aid in protein folding, prevent aggregation, and promote cell survival under stressful conditions [36, 37]. In fish, HSPs play a crucial role in maintaining cellular homeostasis under thermal and other environmental stresses [36, 38]. Various families of HPSs (hsp100, hsp90, hsp70, hsp60, and small HSPs [sHSPs]) have been identified and each serving distinct functions [39–41] Among them, hsp70 and hsp90 are often induced by temperature fluctuations [42, 43]. Beyond thermal stress, HSPs serve as vital biomarkers for environmental monitoring and aquaculture health [44, 45]. Their regulation and function are key to enhancing stress resilience in aquaculture [46], making HSPs fundamental for the survival and adaptation of fish in changing environments. Elevated HSP levels in fish acclimatized to higher temperatures confer thermotolerance and cytoprotection [47]. Therefore, HSPs could be evaluated as reliable biomarkers for assessing the physiological responses of fish reared under elevated temperatures, providing critical insights into stress resilience and the potential for optimizing aquaculture practices in a changing climate.
Nile tilapia (Oreochromis niloticus), belonging to the family Cichlidae, is one of the most widely cultured fish species known for its adaptability, fast growth, and resilience. It is a prominent candidate in aquaculture due to its economic and nutritional value. The world’s tilapia harvest has reached over 6 million tones (MT), making tilapia the second most widely farmed freshwater fish worldwide, after carp [48, 49]. Tilapia culture is now considered as one of the possible remedies to withstand the changing climate and vulnerabilities associated with the aquaculture sector due to its temperature tolerance [50, 51]. Recent studies found that increased temperature has an impact on hematobiochemical and growth parameters, causing erythrocyte morphological defects in Nile tilapia [10]. However, there is a scarcity of research regarding the impact of elevated temperatures on the expression of growth, appetite, and stress-related genes and their influence on the overall growth process in O. niloticus. Therefore, this study was conducted to analyze the expression of genes associated with stress response (hsp70 and hsp90), growth (gh, igf1, and igf2), and appetite (ghrelin) in Nile tilapia reared at different temperatures to determine the optimum thermal level for facilitating higher growth and sustainable production.
2. Materials and Methods
2.1. Experimental Fish
Juvenile O. niloticus (9.0 ± 0.5 cm and 5.8 ± 1.34 gm) of both sexes were obtained from the Bangladesh Fisheries Research Institute (BFRI), Mymensingh, Bangladesh and then acclimated in the fish ecophysiology laboratory of Bangladesh Agricultural University (BAU), Mymensingh for a duration of 14 days at 31°C. During acclimation, fish were kept in a 500L tank having provision of flow through at the natural photoperiod. The fish-rearing system was well-equipped with continuous aeration and the fish were fed a commercial feed with a crude protein level of 35% twice a day ad libitum.
2.2. Experimental Design
In this study, O. niloticus juveniles (n = 20) were reared in the nine glass aquaria (with a volume of 150 L and dimensions of 75 × 45 × 45 cm), each filled with 100L of freshwater. The O. niloticus juveniles were acclimatized and exposed to three different acclimation temperatures (31°C, 34°C, and 37°C) for a period of 14 days. The aquarium water temperature was raised gradually (Δ1°C/12 h) from the control temperature (31°C) to the target temperatures (34°C and 37°C) using a thermocontroller (REI sea, TC-201, Japan). The commercial food, which has a 35% protein content, was fed twice a day, at 9:00 and 17:00 h, until they were satiated. Aquariums were routinely cleaned to maintain a healthier environment.
2.3. Water Quality Parameters’ Measurement
Different water quality parameters such as pH, free CO2, DO, ammonia (NH3), and total alkalinity were measured at the end of 14 days. DO and pH were measured by using a portable DO meter (DO 5509, Taiwan) and pH meter (RI02895, HANNA Co.), respectively. Free CO2 and total alkalinity were estimated by employing the titrimetric method [52]. Ammonia was measured by the test kit solution (Sera ammonia test kit, Germany) as guided by the manufacturer.
2.4. Sample Collection
Following a 14-days period of rearing, the fish at varying temperatures were anesthetized with clove oil (5 mg/L), and the body weight (BW) of each fish was recorded. Blood samples were then collected from the caudal vein of the fish. Blood glucose level was assessed with the help of glucose strips (Digital blood glucose monitoring system, EasyMate® GHb). After sacrificing fish, the pituitary and liver (n = 12, male = 6, female = 6) were removed and preserved at 4°C for 24 h using RNAlater (Ambion, Austin, Texas). The samples were then transferred to the Molecular Biology and Biotechnology laboratory of the Faculty of Fisheries at Chattogram Veterinary and Animal Sciences University (CVASU), Chattogram, and stored at −80°C for further analysis.
2.5. Extraction of Total RNA and Synthesis of First Strand cDNA
Total RNA from the pituitary and liver was extracted using a phenolic reagent RNAiso Plus (Takara Bio Inc., Japan) by following the manufacturer’s instructions. The pellet was reconstituted in 20 μL of DEPC water and thereafter stored at −80°C until the next investigation. The RNA integrity and quality were assessed by measuring the ratio of 260/280 using a NanoDrop spectrophotometer (NanoPhotometer NP80, Germany), and values ∼2.0 were used for the preparation of cDNA. The first strand of cDNA was synthesized with the cDNA Synthesis Kit (AddScript cDNA synthesis kit, ADDBIO, Korea) using total RNA concentration ranging from 300 to 500 ng, according to the directions provided by the manufacturer and the prepared cDNA was frozen at −20°C for future use.
2.6. Real-Time PCR Assays of hsp70, hsp90, ghrelin, gh, igf1, and igf2 mRNAs
Quantitative real-time PCR was performed with a QuantStudio™ 5 Real-Time PCR System (Applied Biosystems, United States of America). The primers utilized to quantify the expression of hsp70, hsp90, ghrelin, gh, igf1, and igf2 were obtained from prior experiments (Table 1). The reaction mixture (10 μL) for PCR assay consists of standard cDNA or sample (1 μL), forward and reverse primer (0.4 μL each), and SYBR premix (5 µL) (Add SYBR Master, ADDBIO Inc, Korea). Initial amplification was conducted at 95°C for 10 min, followed by 40 cycles of 95°C for 30 s, 60°C for 30 s, and 72°C for 1 min. Melting curve analysis was utilized to verify the accurate amplification of each cDNA product. Expression level was normalized by employing the 2−ΔΔCt method and β-actin was used as a housekeeping gene. Each qPCR experiment was conducted in duplicate.
| Gene | Primer sequence | Tissue sample | Reference |
|---|---|---|---|
| hsp70 | F- 5′ CATCGCCTACGGTCTGGACAA 3′ | Liver | [53] |
| R- 5′ TGCCGTCTTCAATGGTCAGGAT 3′ | |||
| hsp90 | F- 5′ TTTGCTGAACTGGGTGAGGA 3′ | Liver | [54] |
| R- 5′ AGAGACCAGGGTCTTGCCAT 3′ | |||
| ghrelin | F- 5′ GTGGTGCAAGTCAACCAGTG 3′ | Liver | [55] |
| R- 5′ CATGGCTTGGCGACCAATTC 3′ | |||
| gh | F- 5′ CTGCTGATCAGGGCCAATC 3′ | Pituitary | [56] |
| R- 5′ TCGACATTTAGCTACCGTCAGG 3′ | |||
| igf1 | F- 5′ GTTTGTCTGTGGAGAGCGAGG 3′ | Liver | [57] |
| R- 5′ GAAGCAGCACTCGTCCACG 3′ | |||
| igf2 | F- 5′ GCTTTTATTTCAGTAGGCCAACCA 3′ | Liver | [58] |
| R- 5′ CACAGCTACAGAAAAGACACTCCTCTA 3′ | |||
| β-actin | F- 5′ CGAGCTGTCTTCCCATCCA 3′ | [59] | |
| R- 5′ TCACCAACGTAGCTGCTTTCTG 3′ | |||
2.7. Statistical Analysis
All the data representing gene expressions are displayed as mean ± standard deviation (SD). Data were first analyzed using one-way analysis of variance (ANOVA) to assess the significance between the three temperature treatments. Upon observing any significance, the means were compared using Tukey’s HSD post hoc test in SPSS (Version 26.0). Visualizations were produced using package “ggplot2” [60] and “ggpubr” [61] in R (R version 4.4.1) (R Core Team, 2024). Statistically significant differences were denoted by p < 0.05, unless otherwise noted in the text.
3. Results
3.1. Variations in the Expression of hsp70 in the Liver of Nile Tilapia at Different Acclimation Temperatures
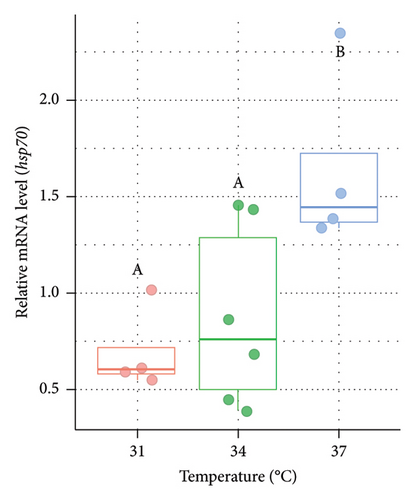
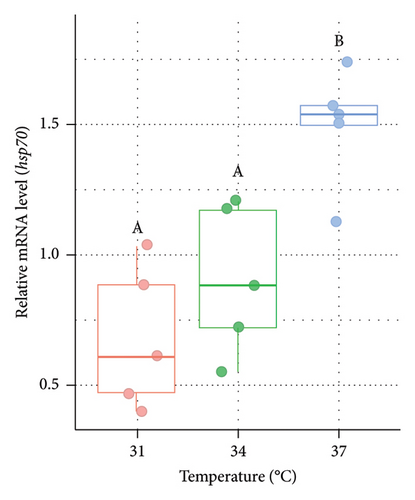
The relative expression level of genes for HSPs at varied temperatures was measured from the liver of Nile tilapia after the rearing period of 14 days (Figure 1). In the case of both males (Figure 1(a)) and females (Figure 1(b)), the relative mRNA expression of hsp70 was significantly (p < 0.05) higher at 37°C (higher acclimation temperature) than the other two groups (31°C and 34°C). However, the expression of hsp70 did not differ significantly (p > 0.05) between 31°C and 34°C.
3.2. Variations in the Expression of hsp90 in the Liver of Nile Tilapia at Different Acclimation Temperatures
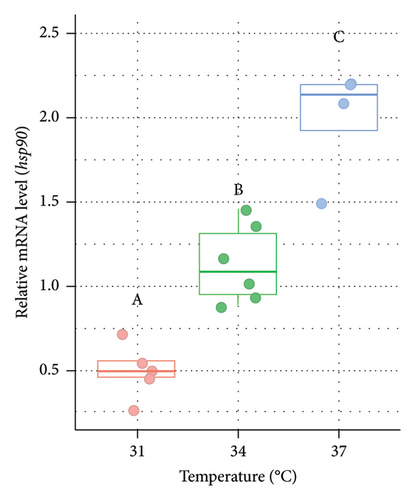
The relative expression of hsp90 mRNA was significantly (p < 0.05) higher at 34°C and 37°C compared to 31°C in the case of both males and females (Figure 2). In males, the relative expression of hsp90 was 2.29 fold higher at 34°C and 4.02 fold higher at 37°C compared to the control (Figure 2(a)). In the case of females, the fold increment was 1.99 and 3.86 times at 34°C and 37°C, respectively, compared to the control (Figure 2(b)).

3.3. Variations in the Blood Glucose Level of Nile Tilapia at Different Acclimation Temperatures
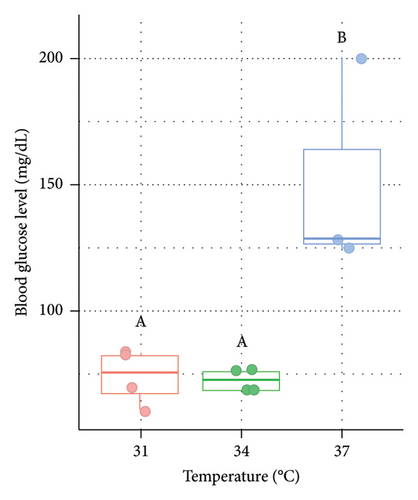
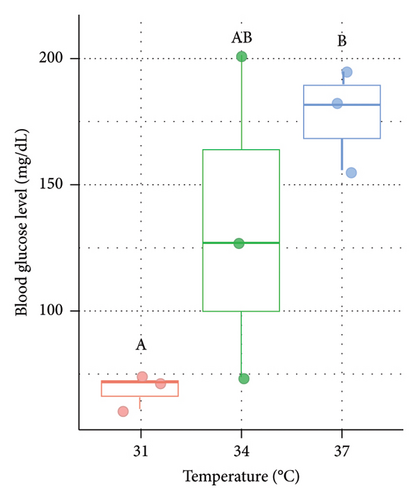
In the present study, blood glucose level was also measured to understand the level of stress response in Nile tilapia. In both males (Figure 3(a)) and females (Figure 3(b)), blood glucose level (mg/dL) was significantly (p < 0.05) higher at 37°C (73.5 ± 11.03 in male and 69 ± 7 in female) compared to 31°C (control) and 34°C (Figure 3).
3.4. Variations in the Expression of ghrelin in the Liver of Nile Tilapia at Different Acclimation Temperatures
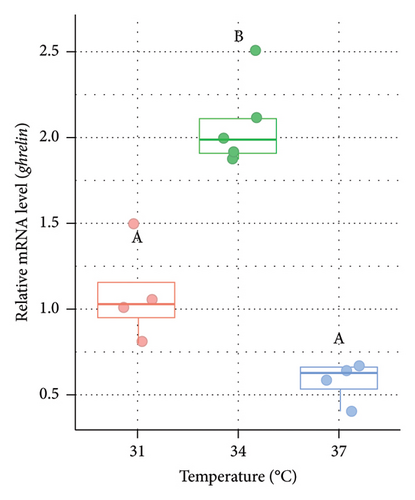
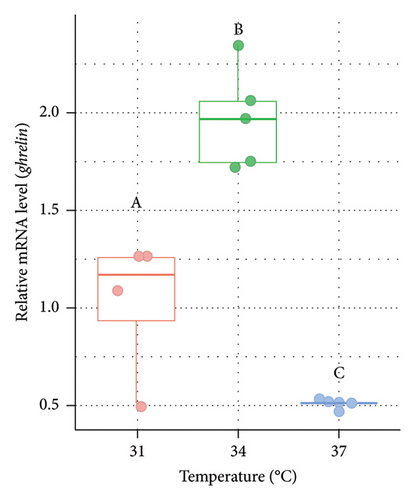
The relative mRNA level of ghrelin was also measured from the liver of Nile tilapia (Figure 4). The relative expression of ghrelin mRNA was significantly (p < 0.05) higher at 34°C (1.95 fold in males [Figure 4(a)] and 1.91 fold in females [Figure 4(b)], respectively) compared to the control group (31°C). However, the expression of ghrelin in males was relatively lower at 37°C but statistically nonsignificant (p > 0.05) between 31°C and 37°C (Figure 4(a)). In females, the ghrelin expression was significantly (p < 0.05) lower at 37°C compared to both 31°C and 34°C (Figure 4(b)).
3.5. Variations in the Expression of gh in the Pituitary of Nile Tilapia at Different Acclimation Temperatures
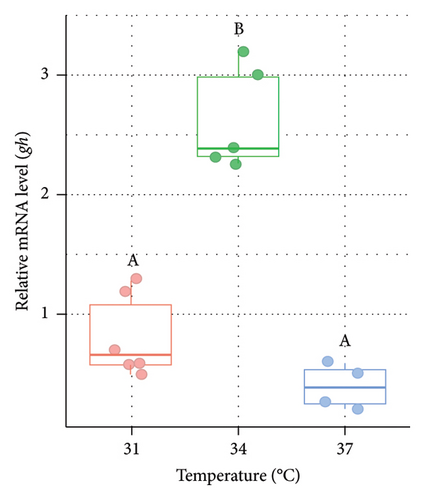
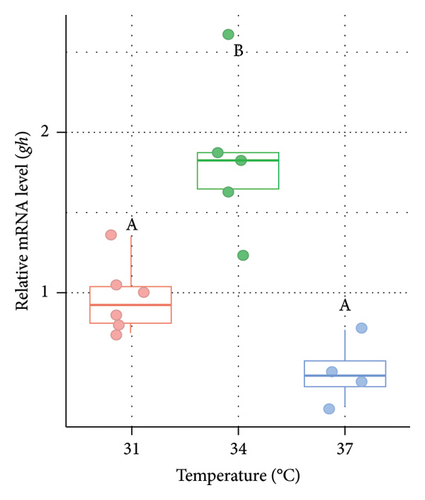
The relative mRNA level of gh was measured from the pituitary of O. niloticus after the rearing period of 14 days at three different temperature regimes (Figure 5). Significantly (p < 0.05) higher expression (3.27 fold in males [Figure 5(a)] and 2.85 fold in females [Figure 5(b)], respectively) of gh was observed at 34°C compared to 31°C (control group). However, the expression was relatively lower at higher acclimation temperatures (37°C) but did not differ significantly (p > 0.05) between 31°C (control group) and 37°C in both males and females.
3.6. Variations in the Expression of igf1 in the Liver of Nile Tilapia at Different Acclimation Temperatures
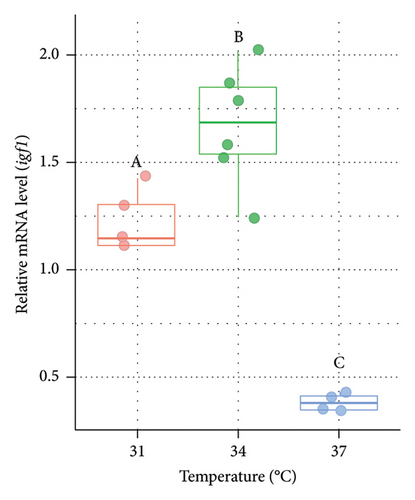
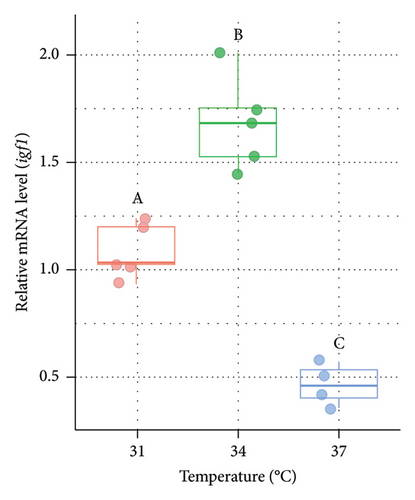
The mRNA level of igf1 was measured from the liver of O. niloticus at three different temperature regimes (Figure 6). The relative expression of igf1 was significantly (p < 0.05) lower at 37°C (higher acclimation temperature) than 31°C and 34°C in both males (Figure 6(a)) and females (Figure 6(b)). However, significantly (p < 0.05) higher igf1 expression (1.36 fold in males and 1.54 fold in females, respectively) was observed at 34°C compared to 31°C (control group).
3.7. Variations in the Expression of igf2 in the Liver of Nile Tilapia at Different Acclimation Temperatures
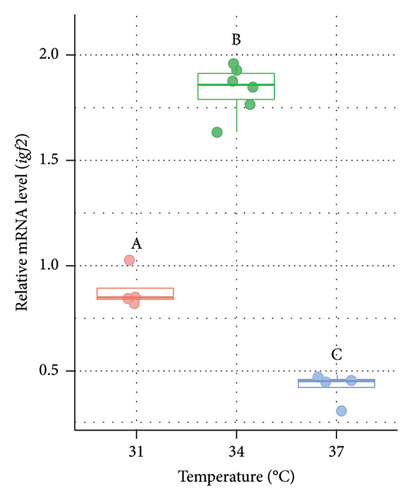
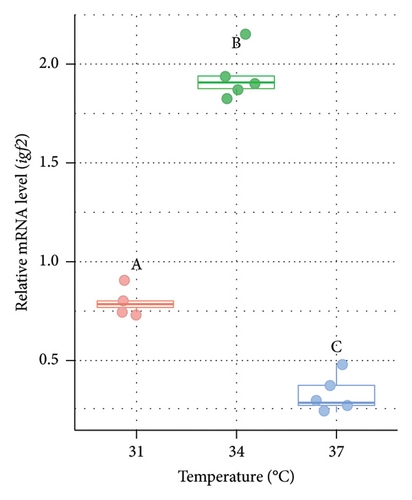
The relative mRNA level of igf2 was also measured from the liver of O. niloticus at varying temperatures (Figure 7). Significantly (p < 0.05) lower expression of igf2 (2.11 and 4.37 fold lower in males [Figure 7(a)] and 2.44 and 5.97 fold in females [Figure 7(b)] at 31°C and 34°C, respectively) was observed at 37°C compared to the 31°C and 34°C. However, the relative expression of igf2 was significantly (p < 0.05) higher (2.07 and 2.45 fold in males and females, respectively) at 34°C compared to 31°C (control).
3.8. Variations in the Water Quality Parameters of Rearing Tank at Different Temperature Exposures
The water quality parameters of the rearing tank such as DO (mg/L), pH, free CO2 (mg/L), total alkalinity (mg/L), and ammonia (NH3) (mg/L) at different acclimation temperatures are depicted in Table 2. As the water temperature increased over time, the DO (mg/L) was significantly decreased. Free CO2 (mg/L) level was increased with the increase of water temperature over time but no significant difference was observed. pH and total alkalinity remained relatively consistent regardless of temperature. Moreover, there was no variation in ammonia (mg/L) level among these three experimental temperatures (Table 2).
| Water quality parameters | Acclimation temperature (°C) | ||
|---|---|---|---|
| 31 | 34 | 37 | |
| Dissolved oxygen (mg/L) | 5.9 ± 0.12a | 5.25 ± 0.06b | 5.15 ± 0.06b |
| pH | 8.7 ± 0.12 | 8.6 ± 0.12 | 8.35 ± 0.06 |
| Free CO2 (mg/L) | 5 ± 1.15 | 9 ± 1.15 | 8 ± 2.31 |
| Total alkalinity (mg/L) | 209.5 ± 0.58 | 241 ± 35.80 | 213 ± 1.15 |
| Ammonia (mg/L) | 0.25 ± 0 | 0.25 ± 0 | 0.25 ± 0 |
- Note: Values are presented as mean ± SD. Different alphabetical superscripts indicate that the values of a single water quality parameter in a column are significantly (p < 0.05) different.
4. Discussion
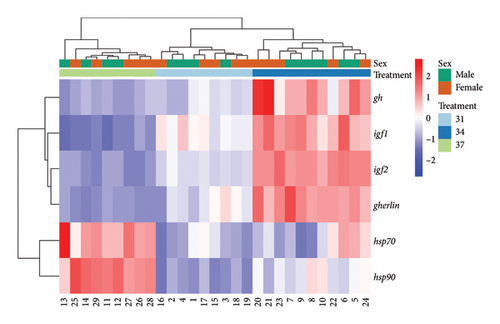
The temperature of the water surrounding fish plays a significant role in their physiological process, stress response, and growth performance. Each species of fish has a specific temperature range that allows them to tolerate their environment optimally. Any deviations from this range can induce stress, which disrupts their usual physiological and growth processes [62]. This study examined how elevated temperatures modulate stress response, appetite, and growth efficiency in juvenile Oreochromis niloticus. In addition, a heatmap was constructed to depict the expression profile and correlation of genes (hsp70, hsp90, gh, igf1, igf2, and ghrelin) across samples categorized by sex (male and female) and temperature-based treatments (31°C, 34°C, and 37°C) (Figure 8). The resulting heatmap reveals distinct expression patterns, suggesting potential influences of both temperature and sex on the expression of these genes. Samples appear to cluster somewhat according to treatments, particularly for the gh and igf1 genes, indicating a possible temperature-related effect on gene expression. In addition, there are indications of sex-related differences, most notably in the igf2 and ghrelin expressions, though these differences are less pronounced than those observed for temperature differences. The findings align with previous research, indicating that elevated temperatures trigger stress responses and affect the growth processes of O. niloticus by downregulating the GH/IGF system.
Studying the expression of HSPs demonstrates a baseline on how fish may respond to varied temperatures in their surroundings. In fish, HSPs serve as molecular chaperones, helping proteins to fold correctly and stabilize under stressful circumstances such as elevated temperatures. Due to the prominent role played by HSPs in cellular stress response, they are considered potential indicators in various vertebrates, especially in different fish species [45]. In this study, expression of hsp70 was significantly upregulated at 37°C compared to 31°C and 34°C in the liver of Nile tilapia. At 37°C, the fish might have become thermally stressed which eventually helped produce higher hsp70 to prevent protein denaturation and aggregation, ensuring proper protein folding and cellular stability. The findings of this study resemble the nature of findings of previously conducted studies on different fish, including Sparus auratus [63], Channa striatus [64], Oncorhynchus mykiss [65], Labeo rohita [43, 66], Channa punctata [67], and Catla catla [68], where these fish species possessed similar responses to counteract as a defense mechanism in various adverse conditions to improve their survival rate [69]. Moreover, the expression pattern of hsp90 was also found to be temperature-dependent, with higher levels observed at 34°C and 37°C compared to the control group at 31°C in the liver of both males and females of Nile tilapia. This advocates the known function of hsp90 in stabilizing and refolding denatured proteins under stress conditions [70]. The observed upregulation at 34°C and 37°C compared to 31°C in males and females further support the role of hsp90 as a critical component of the cellular stress response [71]. Similar findings were observed in other fishes, for example, Ctenopharyngodon idellus [72], Huso dauricus [73], Oncorhynchus mykiss [74], Catla catla [75], and Labeo rohita [43]. Thus, a rise in the expression of both hsp70 and hsp90 at elevated rearing temperature actuates stressful conditions compared to the other group reared at control temperature in Nile tilapia.
In the context of physiological stress in fish, blood parameters serve as crucial indicators for both internal and external alterations [76]. In our present study, a significantly higher blood glucose level was observed when fish was acclimatized at a higher acclimation temperature (37°C) compared to the 31°C and 34°C. This may occur due to increased glycogenolysis which helps to meet the higher energy requirements caused by stressful conditions [10, 77, 78]. The finding of the present study is supported by previous research where in Pangasianodon hypophthalmus reared at a high temperature (36°C), an elevated level of glucose was observed when compared to the control temperature (28°C) [78]. Moreover, temperature-induced increases in blood glucose levels were also noticed in Labeo rohita [79, 80] and Tor putitora [81] as a response to stress. Therefore, the elevation of glucose level found at 37°C in juvenile O. niloticus is clearly an indicator of thermal stress in fish raised at higher acclamation temperatures.
Ghrelin is a peptide hormone recognized as a potent appetite stimulant in fish [82], similar to its role in mammals. In fish, ghrelin has been implicated in promoting feeding behavior and growth [83, 84], making it a significant hormone in the context of aquaculture and understanding fish physiology. It acts by stimulating the release of GH from the pituitary gland and influencing food intake through interactions with the hypothalamus, where it enhances hunger signals [85]. Few research has been conducted on how ghrelin activity in teleost is regulated in regard to temperature. A study on goldfish (Carassius auratus) revealed that ghrelin production dropped in the intestine of fish reared at 35°C than at 15°C [86]. In our current study, higher expression of ghrelin was observed at 34°C and lower at 37°C compared to the control group at 31°C in the liver of both male and female Nile tilapia. Elevated expression of ghrelin in the studied fish denotes a significant physiological response that is associated with enhanced food intake and improved growth rates primarily due to elevated appetite or hunger factors. Lower expression of ghrelin at 37°C indicated that the fish might undergo thermal stress and exhibit decreased ghrelin production reducing the appetite or hunger factors. The impact of higher temperatures on the ghrelin was also demonstrated in earlier studies conducted on Atlantic salmon [35], Chinese perch [86], and Labeo rohita [20, 87] which is similar to the current findings. Hence, decreased ghrelin expression at higher acclimation temperatures in Nile tilapia reveals lower growth performance due to reduced appetite as a part of adaptive responses to conserve energy and prioritize survival over growth.
The interplay between GH and IGF hormones shaped by genetic and environmental conditions may act as a potential indicator during the investigations associated with growth and development [88]. GH is released by the pituitary gland and travels through the bloodstream and subsequently binds to the GH receptor in the liver, leading to the stimulation and release of igf1. Consequently, this plasma igf1 poses an inhibitory action in the secretion of pituitary GH [89]. In the present study, the expression of gh was significantly higher at 34°C compared to the control group at 31°C in both males and females, whereas relatively lower expression was observed at 37°C. The observed increase in gh mRNA levels at 34°C in both male and female tilapia is consistent with previous studies that have reported optimal temperature ranges for the enhanced expression of growth-related genes in fish. For instance, elevated temperatures within a species-specific optimal range have been shown to stimulate the endocrine system, leading to increased expression of gh genes, which in turn promotes somatic growth [32, 88]. However, the significant reduction in gh mRNA at 37°C suggests that temperatures beyond the optimal range may induce thermal stress, leading to a downregulation of growth-related genes which is concordant with studies that have revealed that heat stress can impair the function of the somatotropic axis, thereby reducing the expression of gh [90, 91]. Another study on Atlantic salmon (Salmo salar) [92] showed that moderate increases in temperature could lead to enhanced growth rates, but temperatures above a certain threshold resulted in reduced growth which is similar to the pattern observed in the current study with Nile tilapia. Therefore, alteration in temperature beyond its optimum range can be regarded as the potential reason for growth obstruction in our experimented fish.
Regarding IGFs, significantly higher expression of igf1 and igf2 were also found in the liver of O. niloticus juveniles at 34°C than at the control temperature (31°C). In contrast, at 37°C, there was a significantly lower expression of igf1 and igf2, which could be because of the inhibitory effect of the higher acclimation temperature. As ectothermic animals, fish rely on external temperatures to regulate their bodily functions, including digestion and nutrient absorption. Generally, an increase in water temperature accelerates metabolic rates, leading to higher energy demands and increased feeding activity [93]. Increased levels of IGFs eventually contribute to the somatic growth of fish [88], which was observed at 31°C and 34°C but not at 37°C. Fish with normal physiological functions consume a regular and exact amount of diet, and at the same time, the level of IGFs is also correlated with the appropriate amount of feed intake. Elevated temperatures typically reduce feed intake in fish, as metabolic rates increase, leading to higher oxygen demands and thermal stress. This decrease in feed intake is a common response to avoid feed overloading of fish, which can exacerbate stress and reduce overall growth performance [94]. Thus, in our present study, O. niloticus is able to express higher IGFs at 31°C and 34°C, which could be due to the adaptation of the fish up to 34°C temperature, likewise, the control group at 31°C, but not similar at 37°C; therefore, the expression level of IGFs were dropped at highest acclimation temperature. Studies conducted on other species such as Oncorhynchus mykiss [95], Sparus aurata [96], Labeo rohita [43], and Salmo salar [97] also exhibited similar expression patterns which are concomitant with our current findings. Taken together, the association between optimum environmental temperature and fish growth demonstrates a positive correlation, substantiated by the influence of the thermal growth coefficient [98]. So, this study may have concluded that elevation in temperature induces stress and reduces feed intake, which ultimately hinders growth in juvenile Nile tilapia.
5. Conclusion
Fish growth and development are key concerns in fisheries research, with temperature being a critical factor influencing metabolism and growth. Rising water temperatures due to climate change impact both natural ecosystems and aquaculture. Understanding fish responses to these shifts is essential for predicting climate change effects on populations and production. This study examined elevated temperature effects on stress, growth, and appetite-related gene expression in Nile tilapia. HSPs (hsp70 and hsp90) were significantly upregulated at 37°C, indicating stress and poor growth. However, gh, igf1, igf2, and ghrelin expression increased at 34°C, promoting growth and appetite. These findings enhance our understanding of temperature-driven gene expression and its implications for sustainable aquaculture practices in the changing climatic conditions.
Conflicts of Interest
The authors declare no conflicts of interest.
Author Contributions
Joya Chakrabarty: conceptualization, methodology, and original draft. S. M. Majharul Islam: investigation, methodology, and formal analysis. Md. Nayeem Hossain: investigation, visualization, and software. Azmaien Naziat: data curation, resources, and original draft. Md. Mahiuddin Zahangir: formal analysis, resources, validation, and final draft. Md. Shahjahan: conceptualization, fund acquisition, supervision, review, and editing.
Funding
The authors would like to extend their sincere appreciation to the Bangladesh Agriculture University Research System (BAURES) (Grant no. 2017/282/BAU, to Md Shahjahan) for supporting the research.
Acknowledgments
The authors would like to extend their sincere appreciation to the Bangladesh Agriculture University Research System (BAURES) for supporting the research. This work is based on research conducted for Master’s thesis at Chattogram Veterinary and Animal Sciences University.
Open Research
Data Availability Statement
The data that support the findings of this study are available from the corresponding author upon reasonable request.


