Comprehensive Network Analysis of Lung Cancer Biomarkers Identifying Key Genes Through RNA-Seq Data and PPI Networks
Abstract
This study addresses the pressing need for improved lung cancer diagnosis and treatment by leveraging computational methods and omics data analysis. Lung cancer remains a leading cause of cancer-related deaths globally, highlighting the urgency for more effective diagnostic and therapeutic approaches. Current diagnostic methods, such as imaging and biopsies, suffer from limitations in sensitivity, specificity, and accessibility, often due to factors such as poor data quality, small sample sizes, and variability in data sources. These limitations highlight the necessity for the development of advanced noninvasive techniques. Computational methods utilizing omics data have shown promise in overcoming these challenges by comprehensively understanding the molecular pathways involved in lung cancer. We propose a novel approach that utilizes RNA-Seq data and employs LASSO regression with attention mechanisms to identify lung cancer biomarkers. Our results demonstrate the effectiveness of this approach in identifying potential biomarkers for lung cancer, including well-known genes such as TP53, EGFR, KRAS, ALK, and PIK3CA, validating the model’s ability to uncover key genes associated with lung cancer development and progression. Gene Ontology (GO) and Kyoto Encyclopedia of Genes and Genomes (KEGG) pathway enrichment analyses revealed significant associations of the identified genes with critical biological processes and pathways, including protein synthesis, folding, cell adhesion, gene regulation, and immune responses. The PPI network analysis, constructed using the STRING database and Cytoscape application, highlighted a highly interconnected interaction landscape, with central hub genes playing pivotal roles in lung cancer progression. RPSA emerged as a crucial hub gene, consistently identified across different centrality measures. This study sheds light on the potential of computational methods and omics data analysis in improving lung cancer diagnosis and treatment, offering new insights for future research directions and personalized medicine strategies.
1. Introduction
According to the leading global mortality statistics of cancer, lung cancer is one of the most dangerous types of cancer [1]. Essentially, lung cancer can be described as a malignant neoplastic disease characterized by the process of growth of the detached lung cell mass into tumors [2]. Lung cancer comes in two primary forms: non-small cell lung cancer (NSCLC) and small cell lung cancer (SCLC). It is noted that the most common type of lung cancer is NSCLC [3]. Some of the causes of lung cancer include tobacco smoking, exposure to tobacco smoke, radon, asbestos in the environment, and genetic factors [4] As with most diseases, lung cancer symptoms might differ; however, several general signs are more evident and they include weight loss, wheezing, chest pain, and a cough that will not go away [5]. Morphological examinations such as computed tomography and ordinary radiography are often used as conventional diagnostic techniques in lung cancer, and biopsies are usually performed for confirmation [6]. Despite their effectiveness, these traditional methods have limitations that make them less effective. For example, they may fail to identify small or early-stage tumors, producing false negative results. Sputum cytology may be imprecise, particularly when obtaining a small or random sputum sample [7]. These methods also have limited screening capabilities, are often costly and inaccessible, time-consuming, and provide limited information. This highlights the need for more advanced and noninvasive diagnostic approaches, such as molecular biomarker testing and advanced imaging, to improve early detection and treatment outcomes in lung cancer. Compared to traditional techniques, computational methods utilizing omics data have demonstrated considerable promise in improving lung cancer detection and therapy [8]. These methods can potentially overcome traditional diagnostic methods’ drawbacks by offering a more thorough understanding of the molecular pathways underlying lung cancer by combining data from many omics layers [9].
Recent advances in high-throughput technologies such as genomic, imaging, proteomic, and gene expression data have paved the way for discovering biomarkers. These biomarkers are being utilized for early diagnosis and prognosis of lung cancer. Biomarkers play a vital role in lung cancer diagnosis prediction; among these are lung cancer micro-RNA (miRNAs); some potential miRNAs have also been extensively used for modeling [10]. Researchers have used lung ADC and LCSG-1 datasets focusing on Group 1 and Group 1 combined healthy controls, bronchial lung cancer datasets, LC–MS proteomics, and TCGA datasets for predicting and identifying lung cancer biomarkers. Xue JM et al. analyzed the genomes of lung, liver, kidney, cervical, and breast cancers to identify gene coexpression characteristics across various cancers [11]. They found that genes such as TOP2A, ECT2, RRM2, ANLN, NEK2, ASPM, BUB1B, CDK1, DTL, and PRC1 are linked to patient prognosis, with ASPM potentially associated with immune cell infiltration. These genes could serve as therapeutic targets, aiding personalized treatments and basket clinical trials. GO and Kyoto Encyclopedia of Genes and Genomes (KEGG) analyses indicated that these differentially expressed genes (DEGs) are involved in critical processes such as cell division and the cell cycle.
In addition, the study highlighted the importance of further research on the interplay between these genes and immune responses. Park et al. created an approach for early lung cancer diagnosis that addresses the critical need to improve the current low survival rate [12]. They integrated mRNA expression, DNA methylation, and DNA sequencing data to create a multiomics data-affinitive artificial intelligence algorithm based on a graph convolutional network. With a high macro F1-score of 93.7%, their prediction model demonstrated minimal rates of false positives and negatives. Both distinct and shared biological processes for lung adenocarcinoma and lung squamous cell carcinoma were identified using Gene Ontology (GO) enrichment and pathway analysis, which also improved the precision and accuracy of NSCLC diagnosis by identifying a large number of new and reliable biomarkers. Maharjan et al. developed a computational framework to identify lung cancer biomarker genes using gene expression data from the GEO database [13].
The researchers analyzed nontreatment and treatment studies and discovered 32 biomarker genes with different prognostic characteristics. Nontreatment biomarkers generally indicated better survival for low-expression groups, while treatment biomarkers showed better survival for high-expression groups. These biomarkers are linked to crucial processes such as tumor progression, cell cycle regulation, and ubiquitination, highlighting their potential for diagnosis and therapeutic development in lung cancer. Luo et al. [14] present an integrated approach to identifying plasma exosomal biomarkers for early detection and metastasis prediction in NSCLC. Two distinct panel biomarkers were identified by isolating and characterizing exosomes from NSCLC patients and healthy individuals and performing a comprehensive proteomics analysis. The first panel, including FGB, FGG, and VWF, shows potential for early diagnosis and correlates with patient survival. The second panel, featuring CFHR5, C9, and MBL2, is associated with metastasis, with CFHR5 notably linked to overall survival. These findings highlight the promise of exosomal biomarkers in improving NSCLC management, aiding in early detection, and monitoring metastasis, ultimately enhancing patient outcomes. Xie et al. introduced a novel interdisciplinary approach to the early detection of lung cancer by integrating metabolomics with machine learning methods [15]. Their research involves analyzing plasma metabolites from 110 lung cancer patients and 43 healthy individuals, identifying a combination of six metabolic biomarkers that can accurately discriminate between Stage I lung cancer patients and healthy individuals.
Previous lung cancer biomarker identification studies have typically focused on conventional methods, leading to insufficient prediction accuracy and a lack of advanced network analysis, which fails to capture complex protein–protein interactions [16]. In addition, these studies often blur the distinction between prognostic and predictive biomarkers and need help with clinical validation and translation. In contrast, the proposed approach offers a novel solution using RNA-Seq data and least absolute shrinkage and selection operator regression (LASSO) with an attention mechanism to identify potential lung cancer biomarkers. In this study, we identify key lung cancer biomarkers, including well-known oncogenes such as tumor protein p53 (TP53), epidermal growth factor receptor (EGFR), KRAS proto-oncogene (KRAS), anaplastic lymphoma kinase (ALK), and phosphatidylinositol-4, 5-bisphosphate 3-kinase catalytic subunit alpha (PIK3CA).
We compared the results with other biomarker identification studies to ensure clinical relevance. Our method is expected to improve the accuracy of biomarker identification and patient outcome predictions, facilitating personalized treatment strategies and bridging the gap between biomarker discovery and clinical application for better patient management and outcomes.
2. Materials and Methods
2.1. Dataset
The lung cancer gene expression dataset was obtained from the Pan-Cancer Atlas [17] using R Studio, with the query formulated through the GDCquery function of the TCGAbiolinks library [18]. The Genomic Data Commons (GDC), established by the NCI, provides a unified data storage for sharing data across cancer genomic studies. Various parameters are required for the GDCquery function, including project, legacy, data.category, data.type, platform, file.type, experimental.strategy, and sample.type. The project argument specifies the project to be downloaded from the Pan-Cancer Atlas, with “TCGA-LUAD” being the value for lung cancer. The legacy argument, set to true in this case, directs the query to the legacy repository for unmodified copies of previously stored TCGA Data Portal data. Each project has a specific data category; hence, the data.category is set to “Gene expression” for lung cancer. The data.type argument filters the files to download based on data type, set here as “Gene expression quantification” for RNA-Seq read counting per gene. The platform parameter allows the selection of platforms, with “Illumina HiSeq” chosen in this case. For file.type, “results” is used for the legacy database. Experimental.strategy offers various options such as RNA-Seq, miRNA-Seq, and genotyping array, with RNA-Seq selected for generating the gene expression profile. The sample type is set to “(“primary solid tumor” and “solid tissue normal”)” download gene expression data for normal and tumor cases only. The downloaded LUAD data are then transformed into a matrix format, where columns represent samples or cases, and rows represent genomic ranges of interest. The LUAD dataset comprises 598 clinical samples and 60,660 genes. To reduce the number of genes, preprocessing steps are applied to select genes that positively contribute to lung cancer development and progression.
2.2. DEGs
2.3. LASSO Regression
2.4. The Attention Mechanism
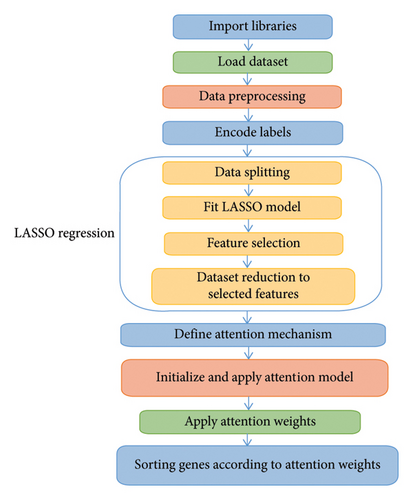
This mechanism allows the model to focus on the most relevant genes and sort them based on their importance, as determined by the attention weights, thereby enhancing the interpretability and performance of the downstream analysis or classification tasks. The workflow of the gene biomarkers’ identification method is depicted in Figure 1.
3. Experimental Results
3.1. The GO Term Analysis of the Top 500 Genes Identified by the Attention Mechanism
An OR greater than one indicates significant enrichment, with larger values suggesting a stronger association between the gene set and the GO term.
The enriched GO terms within the biological process category revealed significant associations of the top 500 genes with several critical biological processes. Specifically, the genes showed substantial enrichment in cytoplasmic translation (GO: 0002181, p value and adjusted p value of 6.35603E − 17 and 1.76761E − 13, respectively), peptide biosynthetic process (GO: 0043043, p value and adjusted p value of 2.68335E − 15 and 3.7312E − 12, respectively), and macromolecule biosynthetic process (GO: 0009059, p value and adjusted p value of 1.1148E − 13 and 1.03342E − 10, respectively). These terms also show large ORs and combined scores. For cytoplasmic translation (GO: 0002181)” with an OR of 13.38, this means that the genes in our dataset are over 13 times more likely to be involved in cytoplasmic translation compared to the background. Since the p value and the adjusted p value are statistically significant, then a large OR is desirable in enrichment analysis. A large combined score typically means that the GO term is both highly enriched and highly significant.
Other significant processes included translation (GO: 0006412, adjusted p value: 1.53145E − 07), gene expression (GO: 0010467, adjusted p value: 2.28563E − 07), and the regulation of programmed cell death, particularly negative regulation of programmed cell death (GO: 0043069, adjusted p value: 4.33769E − 06), negative regulation of the apoptotic process (GO: 0043066, adjusted p value: 7.59821E − 06), and regulation of the apoptotic process (GO: 0042981, adjusted p value: 6.91463E − 05). Additional processes of interest included the positive regulation of the protein metabolic process (GO: 0051247, adjusted p value: 0.000160396) and supramolecular fiber organization (GO: 0097435, adjusted p value: 0.001440254).
These enriched GO terms indicate that the identified genes play crucial roles in various fundamental biological processes, such as biosynthesis, translation, gene expression, cell death regulation, and protein metabolism. This enrichment analysis underscores the functional importance of the top genes selected by the attention mechanism, highlighting their potential involvement in essential cellular and molecular activities as presented in Table 1.
| Term | p value | Adjusted p value | Odds ratio | Combined score |
|---|---|---|---|---|
| Cytoplasmic translation (GO: 0002181) | 6.35603E − 17 | 1.76761E − 13 | 13.38394729 | 499.148189 |
| Peptide biosynthetic process (GO: 0043043) | 2.68335E − 15 | 3.7312E − 12 | 8.439923826 | 283.1738786 |
| Macromolecule biosynthetic process (GO: 0009059) | 1.1148E − 13 | 1.03342E − 10 | 7.078224101 | 211.107531 |
| Translation (GO: 0006412) | 2.20274E − 10 | 1.53145E − 07 | 5.087552743 | 113.1275861 |
| Gene expression (GO: 0010467) | 4.10936E − 10 | 2.28563E − 07 | 4.43519645 | 95.85605619 |
| Negative regulation of programmed cell death (GO: 0043069) | 9.35855E − 09 | 4.33769E − 06 | 3.61650929 | 66.85831883 |
| Negative regulation of the apoptotic process (GO: 0043066) | 1.91253E − 08 | 7.59821E − 06 | 3.208270188 | 57.01819089 |
| Regulation of the apoptotic process (GO: 0042981) | 1.98911E − 07 | 6.91463E − 05 | 2.605445672 | 40.20309494 |
| Positive regulation of the protein metabolic process (GO: 0051247) | 5.19081E − 07 | 0.000160396 | 4.312308397 | 62.4043037 |
| Supramolecular fiber organization (GO: 0097435) | 5.17891E − 06 | 0.001440254 | 3.160831706 | 38.47021962 |
We also examined the enriched GO term results within the cellular component category. The analysis revealed that the top genes obtained by the attention mechanism are significantly enriched and associated with several key cellular components. Specifically, the terms include cell–substrate junction (GO: 0030055, p value and adjusted p value of 8.9976E − 24 and 2.56406E − 21, respectively), focal adhesion (GO: 0005925, p value and adjusted p value of 1.51735E-22 2.16222E − 20, respectively), collagen-containing extracellular matrix (GO: 0062023, p value and adjusted p value of 3.21243E − 16 and), intracellular organelle lumen (GO: 0070013, p value and adjusted p value of 1.09265E − 15 and 7.78513E − 14, respectively), secretory granule lumen (GO: 0034774, p value and adjusted p value of 1.70095E − 13 and 9.69544E − 12, respectively), endoplasmic reticulum lumen (GO: 0005788, p value and adjusted p value of 1.19821E − 12 and 5.6915E − 11, respectively), cytosolic large ribosomal subunit (GO: 0022625, p value and adjusted p value of 2.30422E − 11 and 8.20879E − 10, respectively), large ribosomal subunit (GO: 0015934, p value and adjusted p value of 2.30422E-11 and 8.20879E-10, respectively), ficolin-1-rich granule (GO: 0101002, p value and adjusted p value of 2.35055E − 10 and 7.4434E − 09, respectively), and ficolin-1-rich granule lumen (GO: 1904813, p value and adjusted p value of 1.67074E − 09 4.76161E-08, respectively). These terms also show large OR and combined scores indicating that they are highly enriched and highly significant. This enrichment analysis highlights critical cellular components that the genes are significantly associated with, providing insights into the underlying biological processes and pathways involved as presented in Table 2.
| Term | p value | Adjusted p value | Odds ratio | Combined score |
|---|---|---|---|---|
| Cell–substrate junction (GO: 0030055) | 8.9967E − 24 | 2.56406E − 21 | 6.641901174 | 352.4537083 |
| Focal adhesion (GO: 0005925) | 1.51735E − 22 | 2.16222E − 20 | 6.478444162 | 325.4764267 |
| Collagen-containing extracellular matrix (GO: 0062023) | 3.21243E − 16 | 3.05181E − 14 | 5.310742886 | 189.4572068 |
| Intracellular organelle lumen (GO: 0070013) | 1.09265E − 15 | 7.78513E − 14 | 3.534257524 | 121.7557745 |
| Secretory granule lumen (GO: 0034774) | 1.70095E − 13 | 9.69544E − 12 | 5.148012092 | 151.3639974 |
| Endoplasmic reticulum lumen (GO: 0005788) | 1.19821E − 12 | 5.6915E − 11 | 5.222629223 | 143.3621776 |
| Cytosolic large ribosomal subunit (GO: 0022625) | 2.30422E − 11 | 8.20879E − 10 | 14.7535196 | 361.3681804 |
| Large ribosomal subunit (GO: 0015934) | 2.30422E − 11 | 8.20879E − 10 | 14.7535196 | 361.3681804 |
| Ficolin-1-rich granule (GO: 0101002) | 2.35055E − 10 | 7.4434E − 09 | 5.791853848 | 128.4123635 |
| Ficolin-1-rich granule lumen (GO: 1904813) | 1.67074E − 09 | 4.76161E − 08 | 6.898043865 | 139.4094596 |
Also, we investigated the enriched GO term results within the molecular function category, revealing that the top genes obtained are significantly enriched and associated with several crucial molecular functions. Notably, these include cadherin binding (GO: 0045296, p value and adjusted p value of 4.26636E − 14 and 2.06492E − 11, respectively), RNA binding (GO: 0003723, p value and adjusted p value of 3.70234E − 12 and 8.95967E − 10, respectively), MHC Class II protein complex binding (GO: 0023026, p value and adjusted p value of 5.08015E − 09 and 8.19597E − 07, respectively), actin binding (GO: 0003779, p value and adjusted p value of 5.92648E − 05 and 0.007171046, respectively), kinase binding (GO: 0019900, p value and adjusted p value of 0.000104042 and 0.0087715, respectively), WW domain binding (GO: 0050699, p value and adjusted p value of 0.000108738 and 0.0087715, respectively), peptidase inhibitor activity (GO: 0030414, p value and adjusted p value of 0.00028506), protease binding (GO: 0002020, p value and adjusted p value of 0.00035081 and 0.017020128, respectively), aldo–keto reductase (NADP) activity (GO: 0004033, p value and adjusted p value of 0.00031649 and 0.017020128, respectively), and ubiquitin-like protein ligase binding (GO: 0044389, p value and adjusted p value of 0.000379176 and 0.018352098, respectively). These terms also show large OR and combined scores. This enrichment analysis underscores critical molecular functions that the genes are significantly associated with, offering insights into the underlying biological mechanisms and pathways involved as shown in Table 3.
| Term | p value | Adjusted p value | Odds ratio | Combined score |
|---|---|---|---|---|
| Cadherin binding (GO: 0045296) | 4.26636E − 14 | 2.06492E − 11 | 5.268459851 | 162.1918067 |
| RNA binding (GO: 0003723) | 3.70234E − 12 | 8.95967E − 10 | 2.600121641 | 68.44054477 |
| MHC Class II protein complex binding (GO: 0023026) | 5.08015E − 09 | 8.19597E − 07 | 22.3212831 | 426.2902129 |
| Actin binding (GO: 0003779) | 5.92648E − 05 | 0.007171046 | 3.558910162 | 34.64063152 |
| Kinase binding (GO: 0019900) | 0.000104042 | 0.0087715 | 2.409710475 | 22.098775 |
| WW domain binding (GO: 0050699) | 0.000108738 | 0.0087715 | 13.12121212 | 119.7516991 |
| Peptidase inhibitor activity (GO: 0030414) | 0.00028506 | 0.017020128 | 7.627922163 | 62.26529151 |
| Protease binding (GO: 0002020) | 0.000305081 | 0.017020128 | 3.825314821 | 30.96566598 |
| Aldo–keto reductase (NADP) activity (GO: 0004033) | 0.00031649 | 0.017020128 | 15.71774194 | 126.6570058 |
| Ubiquitin-like protein ligase binding (GO: 0044389) | 0.000379176 | 0.018352098 | 2.649798656 | 20.87381857 |
3.2. KEGG Pathway Enrichment Analysis of the Top 500 Genes Identified by the Attention Mechanism
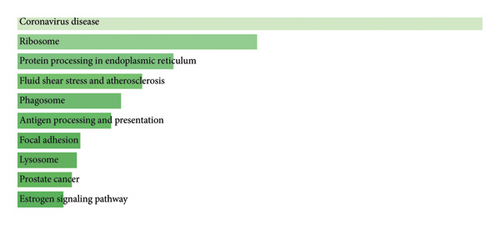
Figure 2 depicts a bar chart of the top 500 genes from which the attention mechanism for lung cancer RNA-Seq data was derived based on KEGG pathway analysis. This analysis based on the GO mental enrichment test showed that results were significantly associated with several major biological processes and pathways. For instance, most genes were associated with coronavirus disease, which would be important should studies involving the virus interaction or immunity be considered. Several terms with highly lifted values also marked significant volcano plots: ribosome; protein processing in the endoplasmic reticulum and their significance in lung cancer were also identified in this analysis. The pathways associated with genes such as fluid shear stress and atherosclerosis, phagosome, antigen processing, and presentation were significant in indicating pathways involved in cellular stress response, immune system, and inflammation. Other sources that showed statistically significant enrichments were focal adhesion, lysosome, prostate cancer, and estrogen signaling pathway, suggesting that lung cancer involves cell adhesion, intracellular degradation, cancer, and estrogen signaling, respectively. This highly integrated enrichment analysis offers in-depth insight into the molecular aspect of lung cancer and offers prospective development possibilities.
3.3. PPI Network Construction and Biomarkers’ Gene Selection
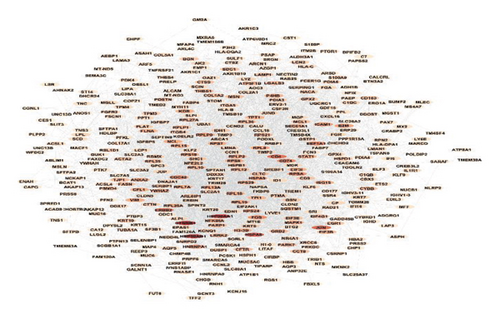
A deeper investigation was conducted to gain insights into our list of the top 500 genes by analyzing them through a PPI network. To achieve this, a PPI network was constructed using the STRING database and the Cytoscape application, incorporating an input of 500 genes. As presented in Figure 3, the PPI network analysis of the top 500 genes in lung cancer RNA-Seq data reveals a highly interconnected and complex interaction landscape. Central hub genes and gene clusters play pivotal roles in the network, representing critical biological processes and potential targets for therapeutic intervention. This analysis provides a comprehensive overview of the molecular interactions in lung cancer, offering valuable insights for future research and clinical applications.
Furthermore, 10 top biomarker genes from the PPI network were selected using maximal clique centrality (MCC), maximum neighborhood component (MNC), and degree methods. This selection was performed with the CytoHubba plugin in Cytoscape, employing the default parameters. The top 10 genes exhibiting the highest MNC, MCC, and node degree scores were identified as hub genes, as illustrated in Figures 4(a), 4(b), and 4(c).
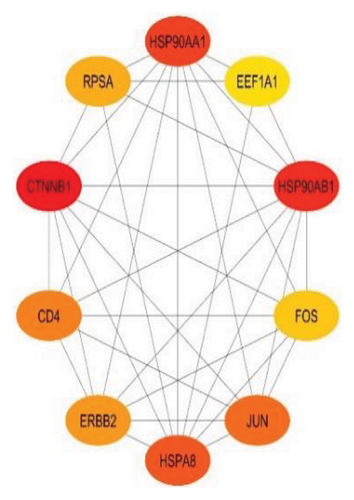
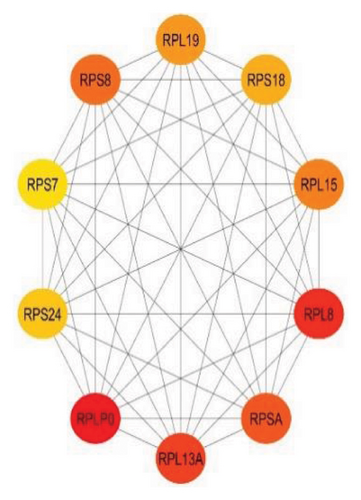
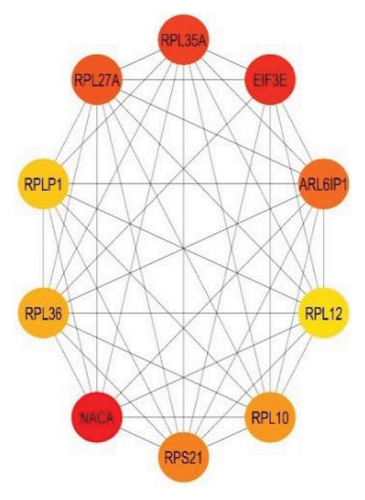
Figure 4 highlights the top 10 hub genes obtained by each method with nodes colored from red (higher significance) to yellow (lower significance). In the MCC subnetwork, genes such as HSP90AA1, HSP90AB1, CTNNB1, JUN, and FOS are prominent, highlighting their roles in protein folding, cell adhesion, and gene regulation. The MNC subnetwork emphasizes ribosomal proteins such as RPL19, RPS8, and RPL13A, indicating the importance of protein synthesis in lung cancer. Similarly, the node degree subnetwork also underscores the significance of ribosomal proteins and includes EIF3E, a translation initiation factor, and NACA, involved in protein folding. Notably, RPSA appears in all three subnetworks, marking it as a crucial hub gene with roles in protein synthesis and cell signaling. This consistent presence underscores its potential as a therapeutic target. Overall, the analysis reveals the complex interaction landscape in lung cancer, highlighting key biological processes such as protein synthesis, folding, and cell signaling, and identifies significant genes such as RPSA for further research and clinical applications.
4. Discussion
The top 10 hub genes by coessentiality are shown in Figure 4, where the nodes range from red representing high significance to yellow representing low significance. The MCC subnetwork contains the following genes of interest irrespective of higher connectivity: HSP90AA1, HSP90AB, CTNNB1, JUN, and FOS, involved in protein folding, cell adhesion, and others. The heat shock proteins HSP90AA1 and HSP90AB1 are already known in the cancer literature for their ability to stabilize almost all the known oncogenic proteins and, hence, are indispensable for the survival and proliferation of cancer cells [24, 25]. Quite recently, the inhibitors that target HSP90 have been reported to modulate these pathways to affect the growth and metastasis capabilities of lung cancer. CTNNB1 coding for beta-catenin represents an element of the Wnt signaling pathway and is often associated with cancer and therapy resistance mechanisms [26]. AP-1, composed of JUN and FOS proteins, is implicated in cell growth and apoptosis, and aberrant expression of JUN and FOS predicted poor survival in lung cancer patients [27, 28]. A notable finding is the consistent presence of RPSA across all three subnetworks, marking it a crucial hub gene with dual roles in protein synthesis and cell signaling. RPSA, also known as the 37/67 kDa laminin receptor, is involved in cell adhesion and migration, essential for cancer metastasis. Its dual functionality and central role in lung cancer biology make it a compelling target for therapeutic intervention [29, 30]. The intersection of these findings with existing literature highlights the importance of these hub genes in maintaining the malignant phenotype of lung cancer cells. This comprehensive analysis reveals the intricate interaction landscape in lung cancer, emphasizing key biological processes such as protein synthesis, folding, and cell signaling, and identifies significant genes such as RPSA for further research and clinical applications.
The MNC subnetwork emphasizes the importance of ribosomal proteins, such as RPL19, RPS8, and RPL13A, indicating the critical role of protein synthesis in lung cancer [31]. The upregulation of ribosomal biogenesis and protein synthesis machinery is a hallmark of cancer cells, supporting their rapid growth and proliferation [32]. Similarly, the node degree subnetwork also highlights ribosomal proteins and includes EIF3E, a translation initiation factor, and NACA, involved in protein folding [32, 33]. EIF3E is essential for the initiation phase of protein translation, and its involvement in cancer underscores the heightened need for efficient protein synthesis in tumor cells [33]. NACA, part of the nascent polypeptide–associated complex, aids in the proper folding and assembly of new proteins, ensuring cellular function and stability.
The GO analysis provided valuable insights into the biological processes enriched among the identified genes. Key processes included cytoplasmic translation, peptide biosynthetic process, cell-substrate junction, focal adhesion, cadherin binding, and RNA binding, which are central to cancer progression.
5. Conclusion
This study demonstrates the potential of using computational methods and omics data analysis to enhance lung cancer diagnosis and treatment. By leveraging RNA-Seq data and employing LASSO regression with attention mechanisms, we identified significant lung cancer biomarkers that align with known oncogenes such as TP53, EGFR, KRAS, ALK, and PIK3CA. Our GO and KEGG pathway enrichment analyses further highlighted the involvement of these biomarkers in critical biological processes and pathways, such as protein synthesis, folding, cell adhesion, gene regulation, and immune responses. The PPI network analysis revealed a highly interconnected interaction landscape, with central hub genes playing pivotal roles in lung cancer progression. RPSA emerged as a crucial hub gene, consistently identified across different centrality measures, emphasizing its dual role in protein synthesis and cell signaling. Integrating the STRING database and Cytoscape application for constructing the PPI network and the CytoHubba plugin for hub gene selection provided a robust framework for identifying potential therapeutic targets. Our findings underscore the importance of advanced computational techniques in uncovering the complex molecular mechanisms of lung cancer, paving the way for personalized treatment strategies and improved patient outcomes. Future research should focus on the clinical validation of these biomarkers to bridge the gap between discovery and application, ultimately enhancing the precision of lung cancer diagnostics and therapeutics.
Ethics Statement
The authors have nothing to report.
Consent
The authors have nothing to report.
Conflicts of Interest
The authors declare no conflicts of interest.
Author Contributions
Data curation: M.A. and M.K.E.; formal analysis: B.A., H.A., M.M., and A.M.M.; investigation: H.A., E.M., and A.M.M.; supervision: M.A., M.E., B.A., and M.A.A.; writing–original draft, A.M.M., H.A., and M.E.; writing–review and editing: M.A., M.E., B.A., and H.A. All authors have read and agreed to the published version of the manuscript.
Funding
The Deputyship of Research & Innovation, Ministry of Education in Saudi Arabia, funded this research through the project number: 223202.
Acknowledgments
The authors acknowledge the Deputyship of Research & Innovation, Ministry of Education in Saudi Arabia, for funding this research through the project number: 223202.
Open Research
Data Availability Statement
The experimental data and the simulation results that support the findings of this study are available at the following website: https://www.cancer.gov/ccg/research/genome-sequencing/tcga.


