Dual-View Deep Learning Model for Accurate Breast Cancer Detection in Mammograms
Abstract
Breast cancer (BC) remains a major global health problem designed for early diagnosis and requires innovative solutions. Mammography is the most common method of detecting breast abnormalities, but it is difficult to interpret the mammogram due to the complexities of the breast tissue and tumor characteristics. The EfficientViewNet model is designed to overcome false predictions of BC. The model consists of two pathways designed to analyze breast mass characteristics from craniocaudal (CC) and mediolateral oblique (MLO) views. These pathways comprehensively analyze the characteristics of breast tumors from each view. The proposed study possesses several significant strengths, with a high F1 score and recall of 0.99. It shows the robust discriminatory ability of the proposed model compared to other state-of-the-art models. The study also explored the effects of different learning rates on the model’s training dynamics. It showed that the widely used stepwise reduction strategy of the learning rate played a key role in the convergence and performance of the model. It enabled fast early progress and careful fine-tuning of the learning rate as the model nears optimum. The model opens the door to achieving a high level of patient outcomes through a very rigorous methodology.
1. Introduction
Breast cancer (BC), the most prevalent type of cancer worldwide, contributed to more than 6,85,000 deaths and more than 2.3 million people suffered from the disease in 2020 [1]. It is still true that it remains one of those forms of this disease today, especially among women, which has a significant impact on the total number of cancer deaths from cancer each year worldwide [2]. This deadly disease is caused by abnormal cell division in breast tissue, where tumors may develop. It usually feels like a painless lump or thickened area [3].
Mammogram analysis is critical for successful early detection and diagnosis of BC in women, one of the highest incidences of potentially life-threatening forms of cancer worldwide. Mammography is a highly specialized medical imaging technology. It uses a low-dose X-ray system to observe the interior of the female breast. A mammography examination called a mammogram assists in the early detection and diagnosis of diseases in women. This X-ray exam is a procedure that helps doctors diagnose and treat medical disorders in the breast. To take an image of the inside of the breast body, a small dose of ionizing radiation is used on the patient. X-rays are the oldest and most well-known form of medical imaging.
The utility of mammography for early detection of BC remains critical to reducing mortality rates. However, the interpretation of mammograms has faced great difficulties in recent years. This is because the nature of breast tissue is complex, and the characteristics of malignant tumors are complex and subtle in turn [4]. In the existing medical settings, the research unequivocally shows that successful treatment and improved patient outcomes are closely associated with early detection through mammography. However, there are several problems in the interpretation of mammograms.
Several researchers have reported several systems for the correct identification of BC, but there are still a reasonable number of false positives and false negatives. These results show that classification systems can be improved by further fine-tuning these models [5]. When a mammogram is flagged as cancer, but in fact there is no cancer, it is referred to as a false positive. In such situations, patients face unnecessary stress, additional examinations, and even surgery [6]. A false negative mammogram looks normal even though there is cancer and the cancerous tumor goes undetected. These errors lead to delayed treatment and lower survival rates [7]. Reduced false positives and false negatives in mammogram readings are very important, both for the individual patient seeking care and, in general, for health services. We need new ways to improve the accuracy and reliability of mammographic readings [4].
An effective classification technique for mammograms is a major challenge. If only one classifier is used, there are certain limitations, such as possible data duplication, which prevents us from being able to analyze new or unseen data [8] reliably. Possibly, a single classifier cannot truly understand the level of subtle shading that may be present in mammographic data [8]. A single classifier can find a situation where the data it uses is unbalanced, resulting in deviant predictions [9]. Every different design and initial setting can have a big impact on the performance of a single classifier. However, if the algorithm is caught in a local optimum or is poorly initialized, the result could well be unsatisfactory [10]. Furthermore, a single classifier in a given dataset may be more prone to noise or outliers than others and, therefore, be wrong [11]. The urgency to combat BC, a major health crisis globally, propels this research [12].
Globally, with the prevalence of BC escalating and its diagnosis presenting complexities, there is an imperative need for enhanced and early detection. In developing countries around the world, this need is even greater. Medical technology, particularly breast imaging, falls seriously short of meeting both of these challenges, as healthcare resources are extremely limited and unbalanced, particularly in rural areas or where there are not enough people to make such services viable [13].
BC needs efficient and accurate early detection methods [14]. Currently, mammograms, while important, have limitations such as high rates of false positives and false negatives. This can lead to unnecessary stress, extra tests, and treatment delays. These problems arise because breast tissue architecture is relatively intricate and tumors may be difficult to locate, making diagnostic errors possible.
Most of the existing mammography analysis systems target at analyzing one view of the breast. However, such systems may not understand some of the subtle characteristics of mammogram images. The most common issue with them is that they are limited by the data with which they work, which can have imbalances, variations in quality, and even differences in the quality of the annotations used for training. This can result in a problem where the performance of the model is not constant, and the accuracy and sensitivity of the model may differ between different datasets.
EfficientViewNet uses a dual-view analysis by using two different sets of convolutional layers. The proposed model has two distinct tracks. These tracks interpret the mammogram images from two different orientations. This allows the model to view more of the breast tissue, and identify irregularities that could only be viewed from a specific perspective [15]. Both paths employ specific methods of deep learning that are intended to identify significant features relevant to the chosen angle. The proposed model is very effective in minimizing the rate of false positives and false negatives. False positives and negatives are the main issues with the present day’s system which uses the standard view [16]. Thus, it also helps in the global fight against BC through such achievements. To this end, this study presents the EfficientViewNet model as an extension of the widely used EfficientNet family. The EfficientViewNet model is found to be superior to the conventional BC detection techniques since the proposed deep learning methods and the larger dataset with a greater variability of mammographic images are employed. This top-notch model can identify cancer by analyzing the smallest details of mammographic data. This is evident from the high accuracy scores it has achieved in F1 score, precision, and recall metrics which are crucial in identifying both normal and peculiar forms of BC.
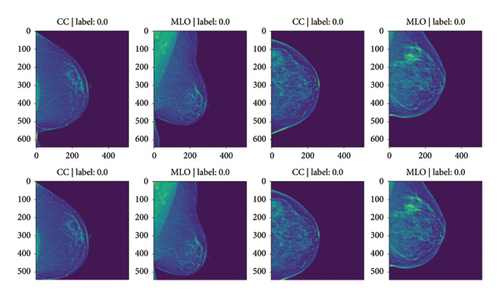
This is done by incorporating the feature of deep learning with a large database of benchmark mammogram images as seen in Figure 1.

These images are from the Radiological Society of North America (RSNA) Benchmark Dataset and show some sample mammograms. It shows the two primary views used in our EfficientViewNet model: The two models that are going to be compared and contrasted are the craniocaudal (CC) view and the mediolateral oblique (MLO) view [17]. The CC view is taken with the compression of the breast in the horizontal plane. This view offers excellent visualization of the central and outer breast tissues, being especially useful in identifying abnormalities in these areas. In contrast, the MLO view is obtained at an angle where the X-ray beam enters the chest wall tangentially, and the area of interest is the breast tissue from the outer top quadrant to the inner bottom quadrant. This view exposes a larger part of the pectoral muscle and the outer quadrants of the breast which are the areas where BC commonly develops. The main problem arises from the fact that in the CC view, it is difficult to differentiate the lesions within the dense tissues adjacent to the chest wall. On the other hand, the main issue that arises in the MLO view is the fact that breast tissue may be of uneven density and may contain the pectoral muscle which can hinder lesion visibility and cause artifacts.
1.1. Related Work
Numerous related studies have significantly advanced the field of BC detection. In earlier research, traditional machine learning and deep learning architectures have been studied to analyze mammography images. In addition, the research has concentrated on improving the classification performance of models on various mammographic benchmarks and other local datasets. Comparative studies have benchmarked multiple models against each other to assess their clinical viability.
Yu et al. [18] used deep neural network (DNN) models that had been taught to recognize breast lesions by looking at images. The Benchmark Breast Cancer Digital Repository (BCDR) with 406 lesions was used to measure diagnostic performance based on the precision of the predictions and the average area under the curve. Based on the results of experiments, GoogleNet performs the best, with an accuracy of 81% and an AUC of 88%. AlexNet comes second, with an accuracy of 79% and AUC of 83%, and CNN3 comes third, with an accuracy of 73% and AUC of 82%.
According to the BI-RADS classification method, Boumaraf et al. [19] presented a new computer-aided diagnosis (CAD) system to classify breast masses in mammograms. The project’s objective is to improve the selection of features using a modified genetic algorithm to increase the accuracy of the CAD system. The study examines 500 images from the Digital Mammography Screening Database (DDSM). Classification precision, positive predictive value, negative predictive value, and Matthew’s correlation coefficient as measured by the study were 84.5%, 84.4%, 94.8%, and 79.3%, respectively.
Farhan and Kamil [20] researched the benchmark dataset for feature extraction methods such as LBP, HOG, and GLCM to analyze bulk tissue and ROI characteristics. The classifiers with the best results used these characteristics with the highest accuracy (92.5%) using the LBP approach and the logistic regression classifier at ROI (30 × 30). The SVM classifier yielded the best results with the HOG technique, with 90% accuracy at ROI (30 × 30). The KNN classifier produced the most significant results with GLCM, achieving 89.3% accuracy at ROI (30 × 30).
Song et al. [21] created a deep learning-based mixed feature CAD approach to classify mammographic masses as normal, benign, or cancerous. The deep-convolution neural network (DCNN) feature extractors graded three breast masses. The SVM classification techniques performed worse than the XGBoost classifier. They conducted experiments on 11,562 ROIs from the DDSM dataset. Thus, when XGBoost was used as a classifier, the overall accuracy was identified as 92.80%, and for malignant tumors, 84%, with reasonable and best results. These results suggest that the proposed strategy can help diagnose instances that are hard to classify on mammographic images.
Zhang et al. [22] used the benchmark dataset CBIS-DDSM along with INbreast mammographic datasets to assess the effectiveness and robustness of their proposed model. In their experiments, the AdaBoost algorithm was applied to detect benign and malignant breast masses. The precision of the proposed model with the CBIS-DDSM dataset was 90.91%, while its sensitivity was 82.96%. For the INbreast dataset, its model achieved an accuracy of 87.93% and a sensitivity of 57.20%.
Patil and Biradar [23] used a deep-learning model for BC detection. They used CNN combined with RNN (rectified linear unit) to categorize masses into normal, benign, or malignant. They reported an accuracy rate of 90%, with sensitivity at 92%. Precision and F1 scores were 78% and 84%, respectively.
A detailed multifractal analysis study extracts texture information from mammography images for BI-RADS density classification [24]. The suggested approach is evaluated on 409 mammography images from the INBreast benchmark dataset. Experimental results reveal that multifractal analysis and LBP-based cascaded feature descriptors have higher classification accuracy than individual feature sets. The study reported an accuracy of 84.6% and an AUC of 95.3%.
Krishnakumar and Kousalya [25] developed deep learning–based segmentation and classification for BC detection. They used an ensemble model combining CNN, Deep Belief Network (DBN), and Bidirectional Gated Recurrent Unit (Bi-GRU) classifier. They used CAMELYON with 322 images. They reported an accuracy of 93.25%. Diwakaran and Surendran [26] developed a BC prognosis based on transfer learning techniques. They used the MIAS benchmark dataset in the experiments. They utilized to improve the model’s performance by leveraging pretrained CNN architectures. The average accuracy of the system is 93.52%. The study was conducted using a single dataset, which may limit the generalizability of the results to other datasets.
BCED-Net was developed by incorporating transfer learning with five pretrained models—Resnet50, EfficientnetB3, VGG19, Densenet121, and ConvNeXtTiny [27]. They used RSNA Breast Cancer dataset. BCED-Net achieved an accuracy of 0.89 with precision, recall, and F1 score at 0.86. The study results demonstrate a balanced trade-off between correctly identifying cancerous instances and ensuring minimal false negatives, highlighting the framework’s potential for real-world application.
Kunchapu et al. [28] conducted another study for enhancing BC detection accuracy using mammographic images from RSNA dataset. They integrated two powerful deep learning models, SEResNet and ConvNeXtV2. They replaced the ReLU activation function with GELU for better performance. They reported promising results with a low loss of 0.0445 and strong performance including F1 score of 0.96, recall 0.95, precision 0.97, and accuracy 92.5%.
Vattheuer et al. [29] proposed another study by employing multiple multimodal classification methods to analyze the RSNA Breast Cancer Dataset. The study focuses on preprocessing techniques and introduces novel architectures to classify raw mammogram data. A key contribution of this study is the comparison of methods for aggregating predictions from multiple scans to accurately determine whether a patient has cancer. The study concludes with a balanced accuracy score of 70.2% in classifying mammograms.
Many research works have been conducted on BC detection by analyzing single-view mammograms. However, this approach frequently faces problems like missing lesions in the single view and results in lower sensitivity and sometimes false negatives. Single-view models mainly consider images from a single viewpoint, which may be insufficient to capture all the lesions especially where the lesions are apparent or only visible from a particular view. This is a major limitation, especially in dense breast tissues where underlying structures may be obscured by other tissues. The issue is that the single-view approach used by previous studies may not capture all the relevant factors, which is why the dual-view approach proposed by our study is useful because it includes both CC and MLO views. As for the dual-view approaches, there are fewer investigations reported in the relevant literature, and thus, our proposed study aims to address this important research gap by implementing dual-view analysis in combination with deep learning.
- •
A novel EfficientViewNet architecture effectively tolerates modality shift by using two pathways. This unique architecture consistently improves the performance of the model.
- •
The model efficiently optimizes its learning rate for the respective views of the mammograms.
- •
The proposed architecture achieved superior results and reduced computational complexity compared to other variants of DNNs.
The methodology is discussed in Section 2. Experiments and results are discussed in Section 3. The conclusion is discussed in Section 4.
2. Methodology
This section explains how mammograms are classified using EfficientViewNet. The CC view from above and the MLO view from the side are the two joint angles from which mammographic images are typically taken from the same breast, as shown in Figure 2.

The essential steps are to prepare the data, create the model architecture, and fine-tune it. A pF1 score is used as a critical metric to assess the performance of the model in various thresholds. The key components of the proposed methodology, optimal threshold selection, learning rate analysis, and comparative evaluation with state-of-the-art techniques, allow for a thorough assessment of its effectiveness.
2.1. Dataset Description and Preprocessing
In this section, a brief explanation of the dataset is presented here. The study relies on a subset of the RSNA mammography dataset [30], a widely recognized collection of mammograms that includes diverse cases from various clinical settings. Thirty-one radiological subspecialties are represented by the RSNA nonprofit, which also represents 145 countries. It has radiographic breast images of approximately 20,000 female patients, with an average of four images per patient and two lateral (left and right) doubles per view. The raw dataset contains about 54,700 mammography images in the Digital Imaging and Communications in Medicine (DICOM) format. The dataset includes various complexity levels and instances with different breast densities, lesion types, and size distributions as shown in Table 1. In this dataset, each image is of size 640 × 512 as shown in Figure 3.
| SNo | Attribute | Data type | Description |
|---|---|---|---|
| 1 | Site_id | int64 | ID code for the source hospital |
| 2 | Machine_id | int64 | ID code for the imaging device |
| 3 | Patient_id | int64 | ID code for the patient |
| 4 | Image_id | int64 | ID code for the respective image |
| 5 | Laterality | Object | Indicates whether the image is of the left or right breast |
| 6 | View | Object | Orientation of the image |
| 7 | Age | float64 | Patient’s age in years |
| 8 | Implant | int64 | Indicates whether the patient had breast implants |
| 9 | Density | Object | Rating for how dense the breast tissue is, with A being the least dense and D the most dense breast |
| 10 | Biopsy | int64 | Indicates whether a follow-up biopsy was performed |
| 11 | Invasive | int64 | Indicates whether the cancer, if present, proved to be invasive |
| 12 | BIRADS | float64 | BIRADS score (0 if follow-up needed, 1 if negative, 2 if normal) |
| 13 | Difficult_negative_case | Bool | Indicates if the case was unusually difficult to diagnose. |
| 14 | Cancer | int64 | Indicates whether the breast was positive for malignant cancer |
The robustness of the model depends on this diversity to handle the real-world situations that arise in clinical practice. A series of preprocessing steps were executed on the dataset to ensure consistent and effective training.
EfficientNet architectures inherently require images of specific dimensions. Thus, all mammogram images were uniformly resized to match the input dimensions of the respective EfficientNet pathways dedicated to the CC and MLO views. This step ensures compatibility between the model architecture and the data.
Normalization is a crucial step in bringing the pixel values to a consistent scale. We divided the dataset into test, validation, and training sets. The validation set helps in a hyperparameter setting; the testing set is a truthful measure of how well a model performs, whereas, with a training set, one optimizes the model’s parameters. Techniques such as oversampling, undersampling, or a combination of the two were employed to correct this problem in machine learning models around class imbalance inside the dataset. The result is that it no longer leans in favor of any one category inappropriately over others. The dataset was divided into training and test sets, with 70:30 allocated for training and validation, respectively.
2.2. Architecture of the Proposed EfficientViewNet
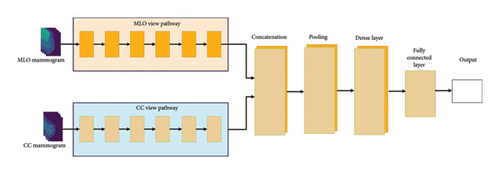
This section highlights the proposed architecture of the EfficientViewNet model and its suitability for the mammogram classification task. The EfficientViewNet architecture comprises two subnets, CC-EfficientNet and MLO-EfficientNet, presented in Figure 4. CC-EfficientNet and MLO-EfficientNet are specially designed for the detection of mammogram images from the CC and MLO views, respectively. These pathways utilize the EfficientNet family structure which is characterized by its ability to provide a good level of accuracy and at the same time keep the computational cost relatively low.
2.2.1. CC View Pathway
N is the total number of layers on the CC view path. Conv represents the convolutional operation. ReLU represents the rectified linear unit activation function. BN represents batch normalization. F represents the number of filters in the convolutional layer, whereas D represents the dropout rate.
The configuration parameters of the CC view pathway, such as learning rate, batch size, and optimizer, are tuned through preliminary experiments and validation. An overview of the significant configuration parameters used during training is provided in Table 2.
| Configuration parameter | Value |
|---|---|
| Learning rate | 0.001 |
| Batch size | 32 |
| Optimizer | Adam |
| Loss function | Cross-entropy |
| Dropout rate | 0.3 |
A multistep process is used to train the CC view pathway to improve the model’s ability to classify CC view mammograms accurately. The steps are described as follows:
Using the Adam optimizer to optimize the selected loss function (cross-entropy), the model iteratively modifies its weights during training. By causing some neurons to be randomly deactivated during training, dropout layers help to prevent overfitting. The model’s performance is monitored using a separate validation set that is not used during training. This allows us to assess the model’s generalization capabilities and make informed decisions regarding hyperparameter adjustments.
FCC and FMLO represent the CC and MLO pathways. xcc and XMLO are the input mammograms from each pathway. Wcc, WMLO, and Wfinal are the weights for the CC pathway, MLO pathway, and final classification system.
The training process is iterated until the model performs satisfactorily on the validation set. The resulting CC view pathway model is then added to the MLO view pathway to form a mammogram classification system.
2.2.2. MLO View Pathway
The convolutional operation is the subscript base , cap Conv, end base, sub cap M, and cap L cap O layers in MLO Pathway. ConvMLO represents the convolutional operation. ReLUMLO represents the Rectified Linear Unit activation function. BNMLO represents batch normalization, whereas FMLO represents the number of filters in the convolutional layer.
Key configuration parameters that govern the MLO view pathway, such as learning rate, batch size, and optimization algorithm, are determined through experimentation and validation. Table 3 outlines essential configuration parameters for the MLO view pathway.
| Configuration parameter | Value |
|---|---|
| Learning rate | 0.001 |
| Batch size | 32 |
| Optimizer | Adam |
| Loss function | Cross-entropy |
| Dropout rate | 0.2 |
The training procedure for the MLO view pathway mirrors that for the CC pathway, although with adaptations specific to the unique characteristics of the MLO mammogram images. The training process can be broken down into several steps:
The preprocessed MLO mammogram images and the corresponding labels are loaded for training.
FCC and FMLO represent the CC and MLO pathways. xcc and XMLO are the input mammograms from each pathway. Wcc, WMLO, and Wfinal are the weights for the CC pathway, MLO pathway, and final classification system.
2.2.3. Feature Interaction and Optimization
This dual-pathway design guarantees that the model can contain all of the characteristics from CC and MLO views because of the inherent synergy of these views. Each of these pathways generates features, and the features extracted from each of the pathways are then fused to provide a more comprehensive representation capable of providing better discrimination. This output is then concatenated to the output of the MLO pathway and passed through a final fully connected layer that performs the classification.
The learning rate in the model is gradually reduced based on the stepwise reduction approach. First, the learning rate is initially set to a higher value to help the network acquire more knowledge in the initial epochs. During the training, the learning rate decreases gradually to further refine the weights of the model to get better convergence without over-fitting. This has been found to enable quicker first approximation convergence together with improved model fine-tuning, which is evident in the high performance of an EfficientViewNet model.
A detailed algorithm of the proposed EfficientViewNet is given below (see Algorithm 1).
-
Algorithm 1: EfficientViewNet.
-
Input:
- 1.
D_train_CC, D_train_MLO, D_valid_CC, D_valid_MLO
-
Initialization:
- 2.
Load CC(x) & MLO(x)//CC and MLO Pathways
- 3.
Define F(x)//Fusion for Ensemble Pathway Outputs
- 4.
Define G(x)//Classification Layer for Predictions
- 5.
Define L(G(x), y)//Loss Function for Predictions and Labels
- 6.
Initialize weights w_CC, w_MLO
- 7.
Set learning rate eta
- 8.
Set convergence criteria and early stopping
- 9.
Set epochs E
-
Training Loop:
- 10.
For epoch ⟵ 1 to E do:
- 11.
For each mini batch (x_batch-CC, y_batch-CC), (x_batch-MLO, y_batch-MLO) in Zip(D_train_CC, D_train_MLO) do:
- 12.
Forward Pass:
- 13.
CC_batch ⟵ CC(x_batch-CC)//CC pathway Predictions
- 14.
MLO_batch ⟵ MLO(x_batch-MLO)//MLO pathway Predictions
- 15.
F_batch ⟵ F(CC_batch, MLO_batch)//Ensemble Predictions
- 16.
G_batch ⟵ G(F_batch)//Final Predictions
- 17.
Loss Computation:
- 18.
loss ⟵ L(G_batch, y_batch-CC) + L(G_batch, y_batch-MLO)//Same Labels for Both Views
- 19.
Backward Pass:
- 20.
Compute dL/(dw-CC), dL/(dw-MLO)//Gradients of loss w.r.t weights
- 21.
Update w_CC & w_MLO gradient descent:
- 22.
w_CC ⟵ w_CC − eta × dL/(dw − CC)
- 23.
w_MLO ⟵ w_MLO − eta × dL/(dw-MLO)
- 24.
Validation:
- 25.
Loss-valid, metric-valid ⟵ Validate(P_EVN(x), D_valid_CC, D_valid_MLO)//Function to be Defined Based on Metrics of Interest
- 26.
Convergence Check:
- 27.
If convergence_criteria_met or early_stopping_triggered(loss_valid, metric_valid) then
- 28.
Break
- 29.
Return P_EVN(x)
-
Output:
- 30.
P_EVN(x)
2.3. Evaluation Metrics
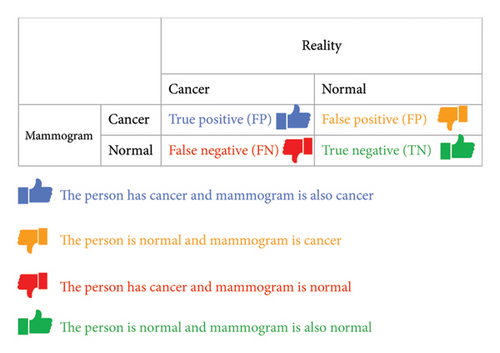
This subsection presents the evaluation metrics for the proposed EfficientViewNet model. Besides the accuracy that these metrics may provide, Precision, Recall, F1 score, and typical measures are all available in one place, offering us a deep view of how well it works overall. A range of complete evaluation metrics are used to evaluate the effectiveness of the proposed method. A confusion matrix is given in Figure 5 to measure the effectiveness of the model.
2.3.1. Accuracy
2.3.2. Precision
2.3.3. Recall
2.3.4. F-Measure
3. Experiments and Results
The RSNA benchmark dataset is used to train and analyze the EfficientViewNet model. To give a thorough overview of the training procedure, chart the development of various performance metrics and demonstrate the model’s convergence over several epochs.
3.1. Model Architecture and Training Setup
The EfficientViewNet architecture, a member of the EfficientNet family, is used for effective BC detection. Thanks to both its effectuality and its strong feature extraction abilities, it has become popular. Passing on from each of these improvements, in turn, a specialized classification head is added to enable that hand-carried black-box crossbreeding and the task still further. The binary cross-entropy loss function was applied next. Evaluation metrics, such as F1 score, precision, recall, and accuracy, were selected to evaluate the overall performance of the model.
Over multiple epochs of training, the model slowly adjusts its parameters to suit the patterns it learned from training data. During every epoch, the model cycles through batches of training data to figure out what is going wrong and back propagates its weight modifications iteratively for that batch. With code output graphs in the remaining chapters, the training output of key metrics can be visually monitored over its progress and gain some insight into how well your present machine learning systems run.
3.2. Evaluation Metrics and Parameter Tuning
Figure 6 illustrates the losses of the proposed EfficientViewNet model for mammogram classification. The training and validation loss graph shows a clear downward trend in the training loss, indicating effective learning and reduction in model error across 100 epochs. The validation loss, while fluctuating, gradually decreases, suggesting that the model is generalizing well and not overfitting significantly. These observations confirm that the chosen learning rate and batch size are appropriate for achieving a stable convergence.
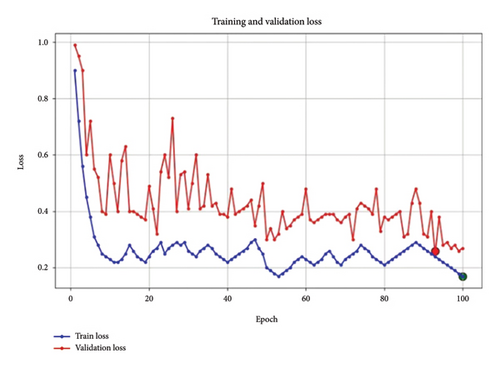
Figure 7 shows the accuracy of the proposed model. The accuracy graph indicates steady improvement in training and validation accuracy, with the lines converging toward the end of the training process. This is a positive indicator that the model is learning effectively without excessive overfitting, with validation accuracy closely following training accuracy. The final high accuracy values for both sets provide further confirmation that the model’s hyperparameters are appropriately set, supporting a strong generalization capability.
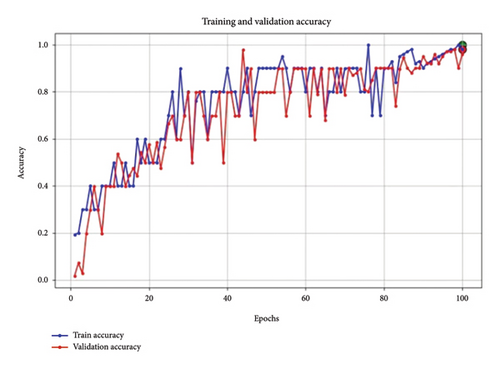
Figure 8 shows training recall. In the Recall graph, both training and validation recall improve consistently, with validation recall closely tracking training recall. This reflects the model’s increasing ability to correctly identify positive cases, which is essential in BC detection tasks where missing true positives can have significant consequences.
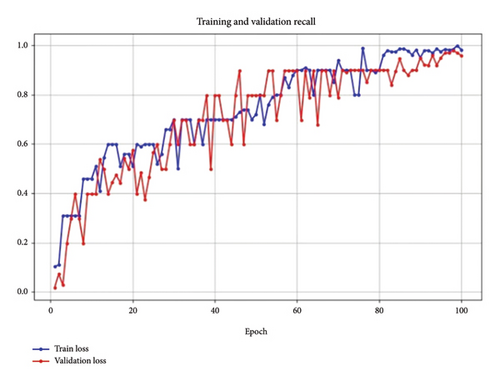
It may be noted that the convergence of recall values for both training and validation suggests that the model parameters, especially the learning rate and dropout rates, are well tuned for this metric.
Figure 9 shows the F1 score of the model. The F1 score for both training and validation exhibits a consistent upward trend, reaching a stable, high value by the end of training. This trend indicates that the model effectively balances precision and recall, reducing both false positives and false negatives.
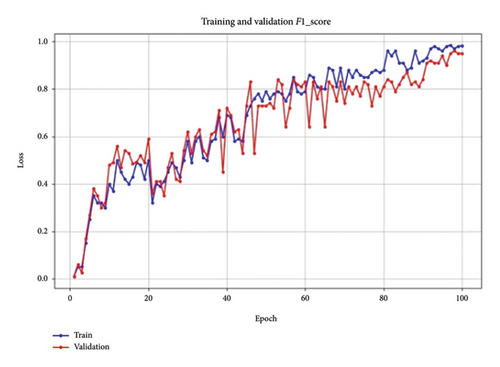
The stable F1 score toward the end suggests that the model’s parameters have been well tuned, supporting robust performance across the dataset.
The collective analysis of these metrics—loss, F1 score, recall, and accuracy—demonstrates that the parameter tuning, particularly in terms of learning rate, batch size, and dropout rate, has resulted in a well-balanced model. The close alignment between training and validation performance across all metrics suggests that the model is robust, achieving both high accuracy and reliability on unseen data. These results confirm the effectiveness of our parameter tuning strategy, leading to an optimized model suitable for reliable BC detection in mammographic images.
3.3. Impact of Learning Rate
Within the proposed architecture, a multipathway approach has been used to carefully optimize learning optimization for separate representations of mammogram images, as depicted in Figure 10. Within our proposed architecture, a multipathway approach was employed to optimize the learning rate for distinct representations of mammogram images, as shown in the updated learning rate schedule. This adaptive strategy allows the model to handle the complex and heterogeneous nature of breast imaging data, refining its learning process for each view-specific pathway. The learning rate schedule demonstrates a carefully structured progression. Starting with a rapid increase, the learning rate peaks early, providing the model with an initial burst to quickly capture fundamental patterns in the data. This peak is followed by a gradual reduction, aligning with the model’s transition from broad learning to fine-tuning. By steadily lowering the learning rate, we ensure that the model can focus on refining its understanding without destabilizing adjustments. This progressive decay approach allows EfficientViewNet to synchronize the convergence of each view to the specific characteristics presented by each mammogram view. The steady decline in learning rate around epoch 80, where it nearly flattens, indicates that the model has reached a stable learning phase. This modulation was crucial to fully exploit the network’s capacity to learn effectively at different stages, achieving a balanced convergence between rapid initial learning and controlled refinement in later stages.
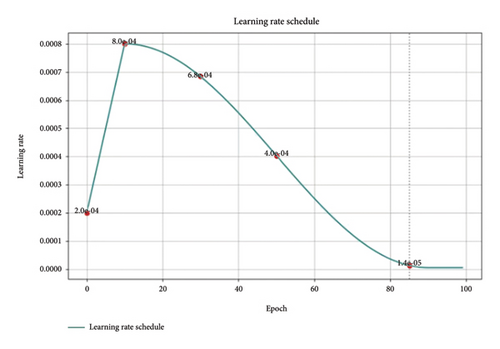
The effectiveness of this view-specific learning rate adaptation is reflected in the model’s strong performance metrics, validating the success of our tailored optimization strategy. This adaptive schedule supports EfficientViewNet’s ability to reach an optimal solution in the complex landscape of BC detection, reinforcing the efficacy of our approach.
3.4. Comparative Analysis and Discussion
As per the statistical analysis, the EfficientViewNet model is the best one. The threshold setting guarantees that the model’s classification decisions achieve a balance between minimizing false positives and false negatives, which is crucial in BC detection. EfficientViewNet performance is compared with state-of-the-art models as shown in Table 4.
The EfficientViewNet model demonstrates superior performance compared to other state-of-the-art techniques on key metrics such as accuracy, F1 score, and recall. EfficientViewNet achieved an accuracy, F1 score, and recall of 0.99 across all three metrics, surpassing other models in the comparison. When comparing EfficientViewNet with ResNet, which has an accuracy of 0.92 and an F1 score of 0.90, it is clear that EfficientViewNet offers a substantial improvement in classification effectiveness. The Ensemble DenseNet model reported an accuracy of 0.90 but a significantly lower F1 score of 0.76, indicating potential limitations in balancing precision and recall. CNN-GRU also underperformed compared to EfficientViewNet, with an accuracy of 0.85 and an F1 score of 0.88.
Recent models like SEResNet combined with ConvNeXtV2 achieved an accuracy of 0.93 and an F1 score of 0.96, closely approaching EfficientViewNet’s performance. However, EfficientViewNet still provides a marginally higher overall effectiveness, particularly in recall, which is crucial in reducing false negatives in BC detection.
Another model, BCED-Net, attained an accuracy of 0.89 and an F1 score of 0.86, demonstrating decent performance but still lagging behind EfficientViewNet in all aspects. Additionally, the model by Vattheuer et al. achieved only a 0.72 accuracy, which further underscores the advancements presented by EfficientViewNet.
EfficientViewNet’s dual-view approach, combined with optimized learning strategies, results in consistently high metrics across all evaluation measures. This model’s superior performance is attributed to its ability to integrate information from both CC and MLO views, enhancing its discriminatory power and reliability in BC detection. These results highlight EfficientViewNet’s potential as a leading model in diagnostic accuracy, contributing meaningfully to advancements in the field.
3.5. Clinical Implications and Future Directions
The proposed model holds great promise in increasing the BC detection rate. It could be seamlessly integrated into the current diagnostic system, providing radiologists with advanced tools to determine malignancies. By boosting the sensitivity of the current model, we could significantly reduce the number of false negatives, potentially leading to improved patients’ survival rates. Moreover, its enactment could also increase the number of cases that could be assessed in a shorter period without compromising the quality of diagnosis.
As we look to the future, our collective efforts can enrich the dataset by including more samples from diverse populations. This collaborative approach will help us overcome the limitations and make the model more accurate for various populations. Exploring ways to explain the model’s decision-making process through methods such as class activation maps may help clinicians better understand the model, subsequently promoting its implementation in clinical practice.
4. Conclusion
This study aims to address the problem of BC, emphasizing the need for effective ways to detect it early. Mammography is still an indispensable and key tool in early diagnosis. Due to the complex nature of breast tissue and the diverse characteristics of tumors, accurate interpretation has become more difficult. In this study, the EfficientViewNet architecture is proposed to take advantage of deep learning models to improve diagnostic precision. The proposed method makes use of the complementary data offered by the CC and the MLO perspectives of the mammograms. The proposed model incorporates specialized subnetworks, CC-EfficientNet and MLO-EfficientNet, for a fully orchestrated approach to exploring these transformative features of a breast mass. The findings of this study show that EfficientViewNet is better by a variety of important metrics. The proposed study possesses several significant strengths, with a high F1 and recall score of 0.99. Its adoption is expected to improve patient outcomes and will be an important tool in the ongoing fight against BC due to its ability to significantly improve diagnostic accuracy. It also represents a key step toward bringing deep learning and complementary mammographic views into play in clinical diagnoses.
Conflicts of Interest
The authors declare no conflicts of interest.
Funding
This research received no specific grant from funding agencies in the public, commercial, or not-for-profit sectors.
Open Research
Data Availability Statement
The data supporting the findings of this study are openly available. The benchmark dataset RSNA Breast Cancer Detection Screening Mammography is available at https://kaggle.com/competitions/rsna-breast-cancer-detection.


