An Evolutionary Game Model for Green Production Decisions of Supply Chain Enterprises Considering Supply Chain Break Risk
Abstract
The problem of environmental pollution has been extensively discussed, especially in the production phase of the supply chain. Many enterprises seek innovation and strive to achieve a win-win situation of economic and environmental benefits. However, the cooperation and competition between enterprises are likely to cause the interruption of the supply chain. Therefore, by combining the green production strategy with supply chain risk management, this paper builds an evolutionary game model between suppliers and manufacturers, to deeply understand the impact of supply chain disruption on the choice of the green production strategy by suppliers and manufacturers and reveal the conditions under which the system evolves into different stability strategies. The results show that (1) under different conditions, the system will have an evolutionarily stable strategy. When the total revenue of green production alone by the supplier or manufacturer is greater than the expenditure and the cost of supply chain disruption is greater than the difference between the investment cost of green production and the total revenue of green production alone, the system will produce two different evolution results. (2) The cooperation willingness of the supplier and manufacturer, the investment cost of green production, and the risk coefficient of supply chain break will all affect the evolution trajectory of the system, and the greater the absolute difference between these factors and the threshold, the faster the system convergence speed. By formulating relevant policies, the system can meet the conditions of evolutionary stability strategy (1, 1), which can promote the upstream and downstream enterprises of the supply chain to realize cooperative green production faster. This paper contributes to the understanding of green supply chain management and evolutionary game theory, while providing insights into how companies along the supply chain can achieve cooperative green production for the benefit of society and the environment.
1. Introduction
The salience of global environmental challenges has intensified, prompting sustainable development to emerge as a pivotal concern shared by governments, businesses, and the public. With the continuous acceleration of the industrial process, pollution has increasingly become a key issue affecting the earth’s ecological environment, threatening the survival and health of human beings, and is a major obstacle to sustainable development. In each stage of the supply chain, especially in the production process, it is inevitable to involve environmental pollution and other problems. First of all, the production process will produce a lot of waste gas, wastewater, and waste residue, and these untreated emissions directly discharged will cause serious harm to water, air, and soil. Second, in the production process, some enterprises need to exploit a large number of resources to obtain raw materials, and excessive exploitation will lead to the depletion of resources and seriously damage the ecological environment. Meanwhile, energy consumption in the production process, such as gas and electricity, will produce a large number of greenhouse gases, such as carbon dioxide. The excessive emission of carbon dioxide not only directly intensifies the “greenhouse effect” but also indirectly leads to the production of some extreme climate, which poses a serious threat and challenge to the sustainable development of human society. Based on this, green production, as a sustainable production mode, has gradually become an important strategy for enterprises to cope with environmental challenges and achieve long-term development.
Green production is a production mode that fully considers resource conservation, environmental protection, and human health in the production process. It controls and regulates all aspects of the supply chain by adopting clean technology, optimizing the production process, and reducing waste discharge and other means to implement a mutually beneficial outcome in terms of both economic prosperity and environmental sustainability. Green production is a key driver of sustainable development [1]. In addition, through the study of the member countries of the Organization for Economic Cooperation and Development, it is found that the continuous improvement and innovation of green production technology will foster the improvement of the national economic development level [2]. Based on the growing awareness of environmental protection issues and sustainable development, governments and social organizations are putting pressure on supply chain members to adopt green production methods [3]. Therefore, the transformation of enterprises to sustainable models through green production has become a popular trend in business practice [3]. At the same time, with the improvement of consumer awareness of environmental protection, people’s consumption of environmentally friendly products is increasing due to the consideration of the environment and human health [4]. Based on a worldwide survey conducted by Accenture, over 80% of respondents take into account the greenness of a product while making a purchase decision [5]. It can be seen that people’s lifestyles are changing to a green lifestyle, and they prefer to buy green products rather than the usual products [6]. Therefore, consumers’ low-carbon preferences will also force companies to embrace eco-friendly manufacturing and sell sustainable products. While firms in the supply chain are faced with many difficulties and challenges when choosing production strategies, they need to game different strategies to get the best choice.
In reality, no matter what kind of business enterprises are engaged in, they will inevitably face various risks. The size and type of risks are different, but they all cause uncertainty in business operations. During the collaboration of enterprises within the supply chain, as well as throughout the operational process, various risks pose the potential for disruptions or interruptions in the smooth flow of supply chains. These risks may come from natural disasters, management errors, economic fluctuations, technical failures, and other factors, which will significantly impact the stability, reliability, and efficiency of supply chains, while the stability and reliability of the supply chain are directly related to the operation efficiency and economic benefits of the company. Once the supply chain is broken, enterprises will face a series of problems such as raw material shortage, production stagnation, and customer loss, which will not only lead to a decline in corporate profits but also may harm the reputation and long-term development of enterprises. Therefore, in the context of considering the risk of supply chain breakage, green production decisions of supply chain enterprises are particularly important. However, in previous studies, the risk of supply chain break has been largely ignored. Taking the risk of supply chain rupture into consideration, this paper studies the decision-making process of green production of supply chain enterprises, filling the gap in the existing literature on the complex interaction between green production and supply chain risk. At the same time, it enhances the understanding of how companies can balance economic prosperity with environmental sustainability amid potential supply chain risks. This paper mainly considers the implications of supply chain break risk on enterprises’ green production decisions when there is no collaboration between enterprises.
The game theory was initially introduced by Morgenstern and Von Neumann [7] and has been utilized across multiple domains and developed rapidly. In the process of studying the green production decision of supply chains, the evolutionary game can analyze the dynamic evolution process of strategy choice in repeated games, and at the same time, it emphasizes the limited rationality of participants, which is highly congruent with the practical state of supply chain firms. Using the framework of evolutionary game theory to analyze green production, decision-making behaviors of supply chain enterprises can not only help to understand the decision-making mechanism of enterprises in complex environments but also provide theoretical support for efficient supply chain management. As far as we know, although there are some research studies on supply chain production decision-making under the framework of game theory, most of them focus on the decision-making of both participants in the game under the background of government and economic policy. In addition, according to the survey, people’s perception of risk will enhance their willingness to green production [8]. However, most of the existing research studies have ignored the influence of supply chain disruption risk on the decision-making of both sides of the game. Consequently, this study holds tangible significance by taking into account the influence of supply chain disruptions on green production strategies of supply chain-affiliated enterprises, thus filling a gap in the existing literature.
- 1.
We build an evolutionary game model that examines the green production decision-making process between suppliers and manufacturers, uniquely incorporating the impact of supply chain disruption risks. This distinction sets our study apart from previous research that has primarily focused on either green production decisions or supply chain risks in isolation.
- 2.
We delve into the dynamic evolutionary trajectory and the evolutionary stability strategy of this game system, analyzing the effects of the initial willingness of suppliers and manufacturers to cooperate, investment cost of green production, and the risk coefficient of supply chain break on the evolutionary stability strategy. By identifying the threshold at which these factors alter a system’s stable state, our research contributes to a deeper understanding of the complex interactions involved in green production decisions.
- 3.
Our research has enriched the relevant research of green supply chain management and evolutionary game theory and provided a new direction for future research. At the same time, the research results of this paper will help enterprises and relevant policymakers to better cope with the risk of supply chain disruption and formulate more scientific and reasonable green production strategies, so as to achieve a win-win situation of economic and environmental benefits.
The subsequent sections of this paper are structured in the following manner. Section 2 presents a comprehensive review of the relevant literature. Section 3 describes an evolutionary game model of green production decisions between suppliers and manufacturers considering supply chain disruption risk. In Section 4, we verify the accuracy of the model’s evolutionary stability strategy through simulation and carry out sensitivity analysis. Finally, the concluding remarks of this paper are exhibited in Section 5.
2. Literature Review
According to the above analysis, the relevant literature mainly focuses on the following three categories: (1) research on green supply chains and green production, (2) research on supply chain risk and green supply chain under supply chain disruptions, and (3) supply chain decision-making based on game theory. In the following sections, three branches of the literature are reviewed in detail.
2.1. Research on Green Supply Chains and Green Production
The topic of green supply chains has attracted extensive attention from scholars. At present, the research on green supply chains primarily focuses on three aspects: green supply chain performance, green supply chain management ability, and innovation of green supply chain enterprises. Regarding green supply chain performance, scholars mainly concentrate on identifying the factors that influence the supply chain’s effectiveness during the implementation of green supply chain management across various industries, as well as exploring strategies to modify and enhance the performance of the green supply chain. For example, Ghaderi et al. analyzed the impact of internal and external strategies of green supply chain management on hotel environmental costs through structural equation modeling and how the reduction of environmental costs can improve supply chain performance through the intermediary function played by agility and elasticity of green supply chain [9]. Roh et al. investigated the effect of green management innovation and intellectual property rights on the environmental outcomes of green supply chains, emphasizing that strategies aimed at resource utilization within companies coupled with the recognition of the unintended benefits of green marketing innovation can contribute to enhancing the environmental performance of these supply chains [10]. Regarding green supply chain management ability, scholars mainly consider the positive role of green supply chain management ability and delve into the question of how to effectively implement and execute green supply chain management practices. For example, Yi et al. analyzed how intrinsic and extrinsic capabilities of green supply chain management influence an enterprise’s sales expansion and pointed out that the positive growth effect of internal green supply chain ability on enterprise sales is long-term [11]. Ye et al. took one of the largest electronics manufacturers in China as an example to explore how to effectively implement green supply chain management and pointed out that enterprises can establish different green emphases in green operation, green relationship management, and green product design elements of green supply chains to form diversified hybrid strategic solutions and to optimize supply chain management and enhance green competitiveness [12]. In terms of the innovation of green supply chain enterprises, scholars mainly study the influencing factors of enterprises’ innovation. For example, Qian et al. investigated the effect of government subsidies for technology on spurring technological advancements within green supply chains [13]. In terms of green production, most current research focuses on green production methods for agricultural by-products, with very few studies examining the factors influencing the green production of supply chains. For example, Lv et al. used the double difference model to explore how green credit policies affect the green production efficiency of enterprises [14]. Alhaddad et al. studied the impact of technological innovation on the spillover of productive capacity to the green sector [15].
To sum up, although the research on green supply chain has made remarkable progress, most of the research is focused on the whole supply chain, and there are few research studies on specific processes, especially the green production process, which is mostly in the agricultural field, and relatively few research studies on how to effectively implement green production strategy. In view of this gap, this paper will analyze the benefits of suppliers and manufacturers under different green production decisions and study how to effectively choose green production strategies.
2.2. Research on Supply Chain Risk and Green Supply Chain Under Supply Chain Disruptions
At present, the study on supply chain risk mainly focuses on the driving factors and impacts of supply chain risk, management and response to supply chain risk, and transmission of supply chain risk. In terms of the drivers and impacts of supply chain risks, scholars mainly classified supply chain risks according to different standards and studied the drivers of different risks and the impacts of risks. For instance, Parast et al. researched the drivers of supply chain disruption risk [16]. Sreedevi et al. examined the influence of macrologistic capabilities on actual and perceived supply chain risks [17]. In the realm of supply chain risk management and its subsequent responses, greater significance is attached to the elements that influence the capacity for managing risks, as well as the measures undertaken to address the encountered risks. For example, Yang et al. evaluated supply chain risk management ability grounded in information processing theory [18]. Song et al. pointed out that in a highly uncertain environment, digital supply chain’s direct impact on supply chain disruption risk is enhanced and at the same time verified the superiority of digital supply chain, providing a new strategic choice for supply chain risk management [19]. In terms of the transmission of supply chain risks, scholars mainly study the transmission path of supply chain risks and the transmission mechanism of risks. For example, Kang et al. constructed a multilayered network risk propagation model specific to copper cable supply chains, aiming to analyze the consequences of supply disruptions on the entire industrial chain and to map out the pathways through which risks are transmitted [20]. Wang et al. utilized epidemic models to investigate the transmission of supply chain risks, subsequently dissecting the mechanisms and evolutionary patterns governing the dissemination of risks within intricate supply chain networks [21].
Research on green supply chain under supply chain disruption is also increasing, mainly focusing on three aspects: the impact of policies and regulations on green supply chain under supply chain disruption risk, the design and optimization of green supply chain under supply chain disruption risk, and enterprises’ countermeasures under supply chain disruption. In terms of the impact of policies and regulations on green supply chain under the risk of supply chain disruption, Cheng et al. investigated the role of economic policy uncertainty and climate policy uncertainty in supply chain disruption, emphasizing the strong influence of these factors on the global supply chain [22]. Kong et al. analyzed the hedging ability of China’s green bonds to the global supply chain pressure and found that green bonds are an effective hedging tool when the global supply chain is highly strained [23]. Yavari et al. studied the impact of Cap-and-Trade regulations on dual-channel green supply chain performance during disruptions [24]. In terms of the design and optimization of green supply chain under supply chain disruption risk, Hasan et al. explored how to design a multiobjective closed-loop green supply chain to maximize the economic and environmental performance of the supply chain and reduce the disruption risk [25]. Mohammed et al. propose a hybrid integration model to seek the best compromise between resiliency and sustainability, providing an integrated approach to supply chain network design, particularly in the face of disruption risk [26]. In terms of enterprises’ countermeasures under supply chain disruption, Saputro et al. studied the selection methods and measures of green suppliers under the supply risk in an uncertain environment [27]. Junaid et al. explored how to improve the overall quality of healthcare services by improving the dynamic capabilities of the supply chain when it faces disruption and uncertainty risks [28].
To sum up, although the research on supply chain risk and green supply chain under disruption risk has achieved rich results, there are still relatively few studies on how to combine supply chain risk management with green production, especially in the context of supply chain disruption, how to effectively deal with risks and promote green production. This paper combines supply chain risk with green production strategy to explore the impact of supply chain disruption on the choice of green production strategy by suppliers and manufacturers.
2.3. Supply Chain Decision-Making Based on Game Theory
In the field of supply chain decision-making, scholars mainly use the Stackelberg game model and the evolutionary game model. The Stackelberg game model is a transformation and optimization of the traditional Cournot model. An important feature of the model that is different from the Cournot model is that it transforms the static game into a dynamic game, which is more realistic. In the present research, the Stackelberg game is mainly used to study product pricing and production decisions. First of all, in terms of product pricing decisions, the Stackelberg game model was constructed to formulate the optimal pricing of game players under different strategies to achieve the optimal overall profit. For example, Yang et al. utilize concepts from the Stackelberg game theories, delving into the analysis of pricing decisions and profit allocation [29]. Second, in terms of production decision-making, it mainly explores the production and manufacturing strategy selection of game players under the influence of different external factors. For instance, Chen et al. delved into the selection and adaptation of production strategies by supply chain enterprises, taking into account the dynamic and evolving consumer perceptions and preferences for the green quality of products [30].
The other part is to use the method of evolutionary game. The evolutionary game model is also the optimization and improvement of the traditional game model. The fundamental premise of classical game theory, assuming rational behavior among players, is anachronistic in the context of evolution [31]. Friedman and Daniel contended that evolutionary game theory offers an analytical framework for examining the interaction strategies among participants, considering their bounded rationality [32]. Therefore, in the realm of supply chain, the evolutionary game model presents a more pragmatic approach than the conventional game model. In current studies, there are more and more research studies on solving supply chain decision-making problems through evolutionary games, mainly focusing on the selection of a green innovation and sustainable development strategy by enterprises, the choice of management and operation strategy of supply chain enterprises under the influence of government and economic policies, and the strategic interplay between upstream and downstream enterprises. For example, Liu et al. applied the evolutionary game model to a two-level green supply chain composed of green suppliers and green manufacturers to analyze various internal and external factors that affect the behavior of both parties in the game [33]. Zhao et al. conducted an analysis of the evolutionary balance achieved among enterprises’ competitive strategies, outlining the prerequisites and approaches necessary for the transition of supply chains to sustainable development [34]. Guo et al. explored the choice of green production strategies for manufacturers under government subsidies [35].
In summary, while there is a growing body of research using game theory in supply chain decision-making, much research is needed specifically for green production decisions under supply chain disruptions, especially given the complexity and dynamics of this situation. In this paper, the dynamic evolution of green production decisions between suppliers and manufacturers is studied using the evolutionary game method.
3. Evolutionary Game Model
In this section, we present an evolutionary game model that uniquely captures the dynamic interactions of suppliers and manufacturers when making green production decisions, taking into account the risk of supply chain disruptions. This model differs from previous evolutionary game models in that it takes the risk of supply chain disruption as a key factor affecting the decision-making process.
3.1. Model Description
In this paper, we will make the following assumptions:
Assumption 1. There are two main players in green production systems. The first player is the supplier, referred to as (GS). The second player is the manufacturer, referred to as (GM). At the same time, we assume that the two players have limited rationality and incomplete information. In addition, we suppose that every participant possesses the capability to continually modify their strategy in order to accommodate alterations within their surrounding environment.
Assumption 2. Each participant has two strategies to select. They can choose to cooperate in green production, or refuse to cooperate in green production. We suppose that the probability of the supplier selecting to cooperate in green production is x, so the probability of the supplier selecting to refuse to cooperate in green production is 1 − x. Moreover, we assume that the probability of the manufacturer selecting to cooperate in green production is y, so the probability of the manufacturer selecting to refuse to cooperate in green production is 1 − y. It is obvious that x, y ∈ [0, 1], 1 − x, 1 − y ∈ [0, 1].
Assumption 3. In the process of green production, both the supplier and the manufacturer need to provide green technology to ensure the greening of raw materials and production processes. The cost represents the financial outlay required for a supplier or manufacturer to adopt environmentally friendly technologies and practices. We postulate that the supplier incurs an investment cost of C1 for green production, while the manufacturer bears an investment cost of C2 for the same purpose.
Assumption 4. If both the supplier and the manufacturer opt against the green production strategy, the usual revenue of the supplier and the manufacturer is R1 and R2, respectively. If both the supplier and the manufacturer opt the green production strategy, consumers will be more willing to buy green products due to their green preference. Therefore, high sales volume and high price lead to the incremental gains of R3 and R4 for both parties, respectively. Incremental gains are the additional revenue from the sale of green products.
Assumption 5. We assume that suppliers and manufacturers work together to complete green production, and the contribution coefficient of the supplier to green production, that is, the relative influence of suppliers on overall green production outcomes in the supply chain, is λ, and then, the contribution coefficient of the manufacturer to green production is 1 − λ. When suppliers and manufacturers work together, their incremental revenue has nothing to do with the contribution factor, but if just one of the two parties adopts the green production strategy, the incremental gains of the supplier and the manufacturer are determined according to the contribution of the party adopting the green production strategy [36]. When the supplier implements the green production strategy, both parties stand to gain additional profits resulting from consumers’ preference for green products as λR3 and λR4, separately. When the manufacturer implements the green production strategy, both parties can gain the additional profits as (1 − λ)R3 and (1 − λ)R4 resulting from consumers’ preference for green products, separately.
Assumption 6. The risk of supply chain disruption arises when either the supplier or the manufacturer chooses not to cooperate. We assume that the risk coefficient of supply chain break, that is, the probability of risk occurrence, is θ, θ ∈ [0, 1] and the cost of supply chain break risk for the supplier is M1 and the cost of supply chain break risk for the manufacturer is M2. If the supplier selects the cooperation strategy while the manufacturer opts for noncooperation, the supplier will have an additional loss of S1, and if the manufacturer chooses cooperation and the supplier decides against it, the manufacturer will have an additional loss of S2. Based on the research of relevant scholars, we stipulate M1 > M2, S1 < S2.
Assumption 7. When the supplier or the manufacturer chooses to carry out green production, they have made contributions to low-carbon environmental protection, fulfilled their social responsibilities, and established a good corporate image, so they will get additional earnings H1 and H2, respectively. Based on the research of relevant scholars, we stipulate H1 < H2.
Given the aforementioned assumptions, all relevant parameters are presented in Table 1. Also, the payoff matrix is presented in Table 2.
| Parameters | Definitions | Value range |
|---|---|---|
| GS | The supplier | — |
| GM | The manufacturer | — |
| x | Probability of the supplier selecting to cooperate in green production | 0 ≤ x ≤ 1 |
| y | Probability of the manufacturer selecting to refuse to cooperate in green production | 0 ≤ y ≤ 1 |
| C1 | The investment cost of green production for the supplier | C1 > 0 |
| C2 | The investment cost of green production for the manufacturer | C2 > 0 |
| R1 | The usual revenue of production for the supplier | R1 > 0 |
| R2 | The usual revenue of production for the manufacturer | R2 > 0 |
| R3 | The incremental gains of green production for the supplier | R3 > 0 |
| R4 | The incremental gains of green production for the manufacturer | R4 > 0 |
| S1 | Additional losses incurred by the supplier (the supplier cooperates and the manufacturer does not cooperate) | S1 > 0 |
| S2 | Additional losses incurred by manufacturer (the manufacturer cooperates and the supplier does not cooperate) | S2 > 0 |
| M1 | The cost of supply chain break risk for the supplier | M1 > 0 |
| M2 | The cost of supply chain break risk for the manufacturer | M2 > 0 |
| H1 | The reputation gains for the supplier | H1 > 0 |
| H2 | The reputation gains for the manufacturer | H2 > 0 |
| θ | The risk coefficient of supply chain break | 0 ≤ θ ≤ 1 |
| λ | The contribution coefficient of the supplier to green production | 0 ≤ λ ≤ 1 |
| 1 − λ | The contribution coefficient of the manufacturer to green production | 0 ≤ 1 − λ ≤ 1 |
| The supplier | The manufacturer | |
|---|---|---|
| Cooperation (y) | Noncooperation (1 − y) | |
| Cooperation (x) | (R1 + R3 + H1 − C1, R2 + R4 + H2 − C2) | (R1 + λR3 + H1 − S1 − C1, R2 + λR4 − θM2) |
| Noncooperation (1 − x) | (R1 + (1 − λ)R3 − θM1, R2 + (1 − λ)R4 + H2 − S2 − C2) | (R1, R2) |
3.2. Construction of the Model
In this segment, an evolutionary game-theoretic framework is constructed to analyze green production decisions within supply chain contexts.
3.3. The Discussion of the Model
Based on the dynamic system constructed above, we can come to the proposition as follows.
Proposition 1. Regarding the evolutionary game model that has been constructed for both the supplier and the manufacturer,
- i.
The points E1(0, 0), E2(0, 1), E3(1, 0), and E4(1, 1) are the fixed equilibrium points.
- ii.
If 0 ≤ (C2 + S2 − (1 − λ)R4 − H2)/(S2 + θM2) ≤ 1, 0 ≤ (C1 + S1 − λR3 − H1)/(S1 + θM1) ≤ 1, E5(x∗, y∗) emerges as an equilibrium point, where x∗, y∗ are specified as follows:
Proof 1. According to Weinstein [37], the equilibrium point needs to satisfy the above dynamic system V1 in which F(x) = 0 and F(y) = 0. The four fixed equilibrium points in Proposition 1 (i) are easily obtained. As 0 ≤ x ≤ 1, 0 ≤ y ≤ 1, E5(x∗, y∗) can be deduced.
While Proposition 1 identifies the equilibrium points within the evolutionary game model, determining whether these points constitute evolutionarily stable strategies (ESSs) necessitates additional analysis and evaluation.
Proposition 2. Regarding the equilibrium points mentioned above, the analysis of their stability within the framework of evolutionary game theory proceeds as follows:
- i.
None of the four fixed equilibrium points exhibit stability, and it is impossible for the evolutionary game to settle at any of these unstable points.
- ii.
The center point E5(x∗, y∗) is also unstable.
Proof 2. Employing the analytical approach proposed by Friedman, the stability of a game’s equilibrium point can be assessed through the local stability analysis of its Jacobian matrix. We suppose that the Jacobi matrix of system V1 to be denoted as J; thus, we derive the Jacobian matrix as detailed below:
Subsequently, Table 3 presents the values of the det J and trJ, obtained from the five strategies.
| Strategy | det J or trJ | Expression |
|---|---|---|
| E1(0, 0) | det J | (λR3 + H1 − S1 − C1)((1 − λ)R4 + H2 − S2 − C2) |
| trJ | (λR3 + H1 − S1 − C1) + ((1 − λ)R4 + H2 − S2 − C2) | |
| E2(0, 1) | det J | −(S1 + θM1 + λR3 + H1 − S1 − C1)((1 − λ)R4 + H2 − S2 − C2) |
| trJ | S1 + θM1 + λR3 + H1 − S1 − C1 − ((1 − λ)R4 + H2 − S2 − C2) | |
| E3(1, 0) | det J | −(λR3 + H1 − S1 − C1)(S2 + θM2 + (1 − λ)R4 + H2 − S2 − C2) |
| trJ | S2 + θM2 + (1 − λ)R4 + H2 − S2 − C2 − (λR3 + H1 − S1 − C1) | |
| E4(1, 1) | det J | (S1 + θM1 + λR3 + H1 − S1 − C1)(S2 + θM2 + (1 − λ)R4 + H2 − S2 − C2) |
| trJ | S1 + θM1 + λR3 + H1 − S1 − C1 + S2 + θM2 + (1 − λ)R4 + H2 − S2 − C2 | |
| E5(x∗, y∗) | det J | (ξ4ξ3(ξ2 + ξ4)(ξ1 + ξ3))/(ξ1ξ2) |
| trJ | 0 | |
Under the evolutionary game theory, if the Jacobian matrix fulfills the conditions of det J > 0 and trJ < 0, the respective equilibrium point is identified as a locally asymptotically stable fixed point, indicating that the associated evolutionary strategy possesses evolutionary stability. As shown in Table 3, it fails to provide conclusive evidence regarding whether the values of det J and trJ for the preceding four strategies are positive, negative, or zero. At the same time, the trace of the last strategy is always equal to 0, so none of the five strategies satisfy the condition of asymptotic stability, and Proposition 2 is proved.
According to Proposition 2, no ESS exists within the dynamic system, so any slight change can exert a substantial influence on the decision-making behavior of suppliers and manufacturers. Multiple ESSs of the model can be obtained only when the original state changes, as shown in Proposition 3.
Proposition 3. Upon variation in the initial conditions, the evolutionary game may yield multiple ESSs. From Section 3.1, we can obviously see that ξ1 > 0 and ξ2 > 0.
- i.
When E1(0, 0) is the ESS, the system must satisfy ξ3 < 0 and ξ4 < 0, and any of the following conditions must be satisfied:
() -
In addition, when the system satisfies ξ3 < 0, ξ4 < 0, ξ1 + ξ3 > 0 and ξ2 + ξ4 > 0, E1(0, 0) may be the ESS.
- ii.
When E2(0, 1) is the ESS, the system must satisfy ξ3 < 0, ξ4 > 0 and ξ1 + ξ3 < 0.
- iii.
When E3(1, 0) is the ESS, the system must satisfy ξ3 > 0, ξ4 < 0 and ξ2 + ξ4 < 0.
- iv.
When E4(1, 1) is the ESS, the system must satisfy one of the following conditions:
In addition, when the system satisfies ξ3 < 0, ξ4 < 0, ξ1 + ξ3 > 0 and ξ2 + ξ4 > 0, E4(1, 1) may be the ESS.
Proof 3. The expressions of the det J and trJ of the equilibrium points of the five strategies of system V1 are given in Table 3. Multiple ESSs can be obtained by adjusting the player’s original state. Figure 1 depicts the varying evolutionary trajectories of strategies adopted by the supplier and manufacturer, contingent upon different initial conditions.
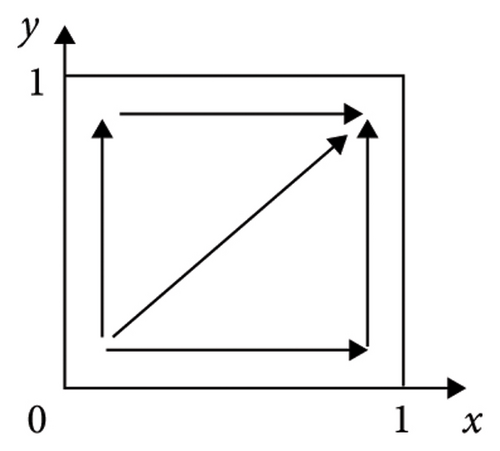
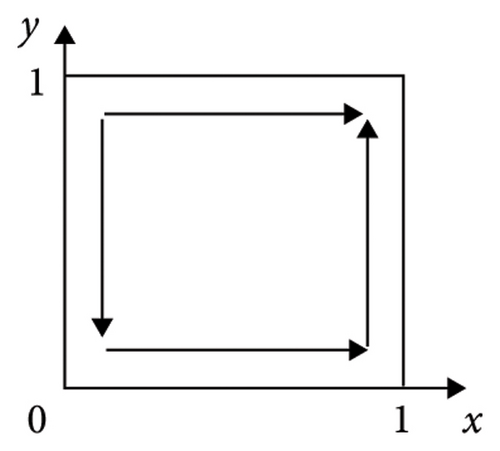
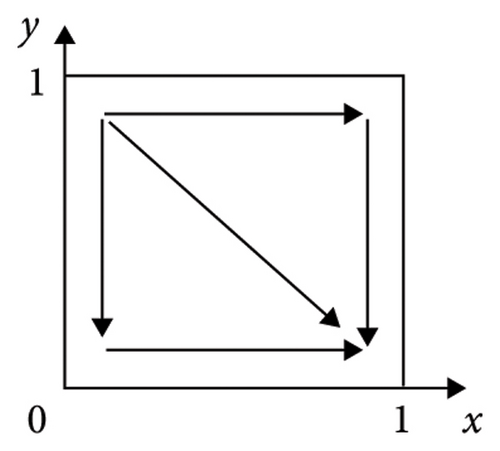
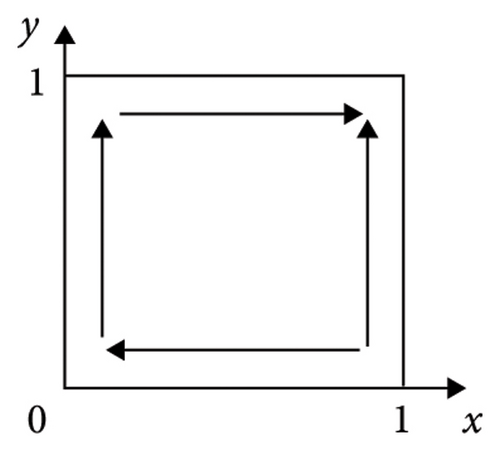
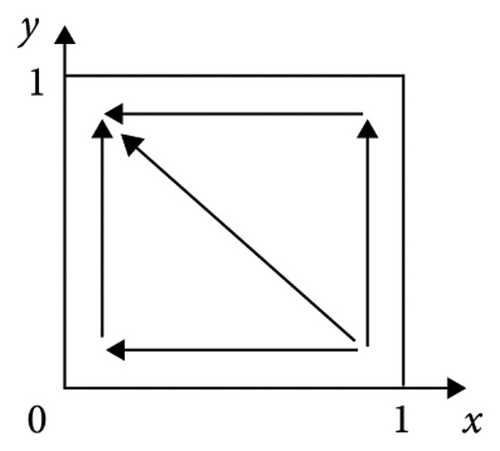
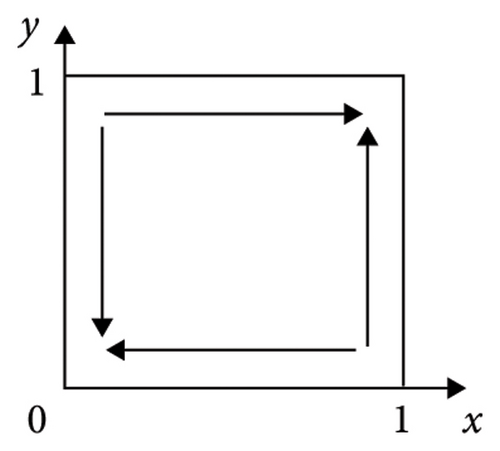
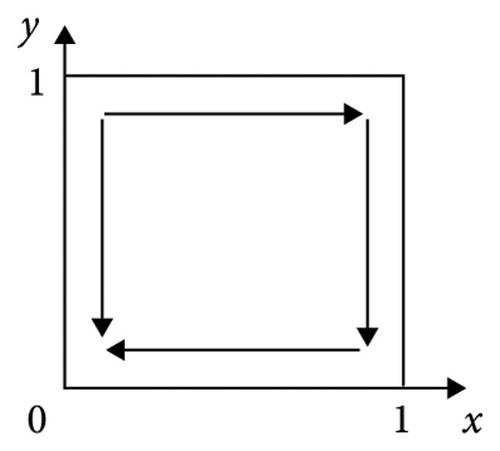
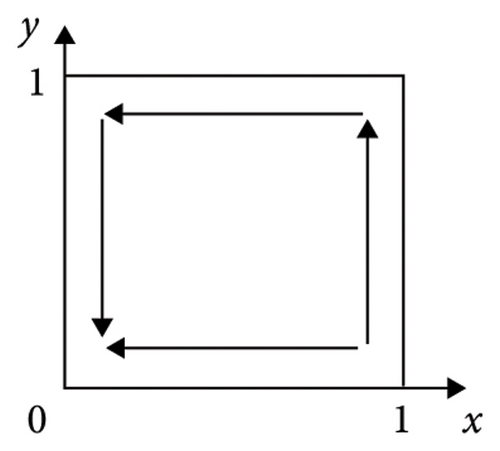
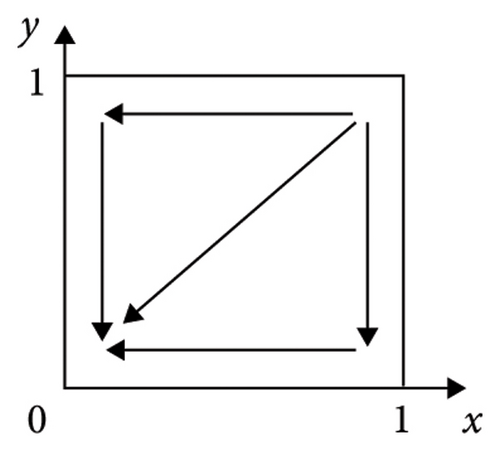
According to Table 3, we can learn that (1) if ξ3 > 0 and ξ4 > 0, we have ξ1 + ξ3 > 0 and ξ2 + ξ4 > 0, in other words, λR3 + H1 + θM1 > C1 and (1 − λ)R4 + H2 + θM2 > C2; the illustration of the evolutionary trajectory is displayed in Figure 1(a). At this time, by calculating the values of the det J and trJ of the equilibrium point, it can be found that the det J at E4(1, 1) is greater than 0 and the trJ is less than 0. In a similar way, (2) if ξ3 > 0 and ξ4 < 0, we have ξ1 + ξ3 > 0, and then, E3(1, 0) and E4(1, 1) are the ESS; the illustration of the evolutionary trajectory is displayed in Figures 1(b) and 1(c). This condition is divided into two situations. When ξ2 + ξ4 > 0, in other words, (1 − λ)R4 + H2 + θM2 > C2, E4(1, 1) is the ESS. When ξ2 + ξ4 < 0, E3(1, 0) is the ESS. (3) If ξ3 < 0 and ξ4 > 0, we have ξ2 + ξ4 > 0, and then, E2(0, 1) and E4(1, 1) are the ESS; the illustration of the evolutionary trajectory is displayed in Figures 1(d) and 1(e). This condition is divided into two situations. When ξ1 + ξ3 > 0, in other words, R3 + H1 + θM1 > C1, E4(1, 1) is the ESS. When ξ1 + ξ3 < 0, E2(0, 1) is the ESS. (4) If ξ3 < 0 and ξ4 < 0, then E1(0, 0) and E4(1, 1) are the ESSs; the illustration of the evolutionary trajectory is displayed in Figures 1(f), 1(g), 1(h), and 1(i). This condition is divided into four situations. When ξ1 + ξ3 > 0 and ξ2 + ξ4 > 0, E1(0, 0) and E4(1, 1) are the ESSs. When ξ1 + ξ3 > 0 and ξ2 + ξ4 < 0 or ξ1 + ξ3 < 0 and ξ2 + ξ4 > 0 or ξ1 + ξ3 < 0 and ξ2 + ξ4 < 0, E1(0, 0) is the ESS. Therefore, Proposition 3 is proved.
According to Proposition 3, we have the following corollaries.
Corollary 1. Both the supplier and manufacturer choose to refuse to cooperate in green production in the condition of (1) R1 + λR3 + H1 − S1 − C1 < R1; (2) R2 + (1 − λ)R4 + H2 − S2 − C2 < R2.
Proof 4. According to Proposition 3, we can easily infer that both the supplier and manufacturer choose to refuse to cooperate in the condition of λR3 + H1 − S1 − C1 < 0 and (1 − λ)R4 + H2 − S2 − C2 < 0, which can be converted into R1 + λR3 + H1 − S1 − C1 < R1 and R2 + (1 − λ)R4 + H2 − S2 − C2 < R2. Thus, Corollary 1 can be derived.
Corollary 2. The supplier chooses to refuse to cooperate in green production and the manufacturer chooses to cooperate in the condition of (1) R1 + R3 + H1 − C1 < R1 + (1 − λ)R3 − θM1; (2) R2 + (1 − λ)R4 + H2 − S2 − C2 > R2.
Proof 5. According to Proposition 3, we can easily infer that the supplier chooses to refuse to cooperate in green production and the manufacturer chooses to cooperate in the condition of λR3 + H1 − S1 − C1 < 0, (1 − λ)R4 + H2 − S2 − C2 > 0 and λR3 + H1 + θM1 − C1 < 0, which can be converted into R1 + R3 + H1 − C1 < R1 + (1 − λ)R3 − θM1 and R2 + (1 − λ)R4 + H2 − S2 − C2 > R2. Thus, Corollary 2 can be derived.
Corollary 3. The supplier chooses to cooperate in green production and the manufacturer chooses to refuse to cooperate in the condition of (1) R1 + λR3 + H1 − S1 − C1 > R1; (2) R2 + R4 + H2 − C2 < R2 + λR4 − θM2.
Proof 6. According to Proposition 3, we can easily infer that the supplier chooses to cooperate in green production and the manufacturer chooses to refuse to cooperate in the condition of λR3 + H1 − S1 − C1 > 0, (1 − λ)R4 + H2 − S2 − C2 < 0 and (1 − λ)R4 + H2 + θM2 − C2 < 0, which can be converted into R1 + λR3 + H1 − S1 − C1 > R1 and R2 + R4 + H2 − C2 < R2 + λR4 − θM2. Thus, Corollary 3 can be derived.
Corollary 4. Both the supplier and manufacturer choose to cooperate in green production in the condition of (1) R1 + R3 + H1 − C1 > R1 + (1 − λ)R3 − θM1; (2) R2 + R4 + H2 − C2 > R2 + λR4 − θM2.
Proof 7. According to Proposition 3, we can easily infer that both the supplier and manufacturer choose to cooperate in the condition of (1) λR3 + H1 − S1 − C1 > 0, and (1 − λ)R4 + H2 − S2 − C2 > 0; or (2) λR3 + H1 − S1 − C1 > 0, (1 − λ)R4 + H2 − S2 − C2 < 0 and (1 − λ)R4 + H2 + θM2 − C2 > 0, or (3) λR3 + H1 − S1 − C1 < 0, (1 − λ)R4 + H2 − S2 − C2 > 0 and λR3 + H1 + θM1 − C1 > 0, or (4) λR3 + H1 − S1 − C1 < 0, (1 − λ)R4 + H2 − S2 − C2 < 0, λR3 + H1 + θM1 − C1 > 0 and (1 − λ)R4 + H2 + θM2 − C2 > 0, which can be converted into R1 + R3 + H1 − C1 > R1 + (1 − λ)R3 − θM1 and R2 + R4 + H2 − C2 > R2 + λR4 − θM2. Thus, Corollary 4 can be derived.
4. Numerical Study
Within this segment, we will verify the accuracy of the model’s evolutionary stability strategy through simulation and conduct sensitivity analysis to analyze the influence of the initial cooperation willingness of the supplier and the manufacturer, green production investment cost, and supply chain disruption risk coefficient on the evolutionary stability strategy. Furthermore, the specific simulation and analysis are as follows:
4.1. Simulation Analysis of System Stability Results
To visually monitor the dynamic progression of strategy selection among enterprises, this paper uses the MATLAB system simulation tool to set 10 sets of values that meet the above different conditions. In the process of setting, reference is made to the research of Geng, Chen, and Shang et al., and the setting is combined with specific realities and scenarios [36, 38–40]. The hypothetical values assigned to these parameters are outlined in Table 4.
| Parameters | 1 | 2 | 3 | 4 | 5 | 6 | 7 | 8 | 9 | 10 |
|---|---|---|---|---|---|---|---|---|---|---|
| S1 | 3 | 3 | 3 | 3 | 3 | 3 | 3 | 3 | 3 | 3 |
| S2 | 4 | 4 | 4 | 4 | 4 | 4 | 4 | 4 | 4 | 4 |
| θ | 0.5 | 0.5 | 0.5 | 0.5 | 0.5 | 0.5 | 0.5 | 0.5 | 0.5 | 0.5 |
| M1 | 6 | 6 | 6 | 6 | 6 | 6 | 6 | 6 | 6 | 6 |
| M2 | 4 | 4 | 4 | 4 | 4 | 4 | 5 | 5 | 5 | 5 |
| λ | 0.6 | 0.6 | 0.6 | 0.6 | 0.6 | 0.6 | 0.6 | 0.6 | 0.6 | 0.6 |
| R3 | 20 | 20 | 20 | 14 | 14 | 14 | 14 | 14 | 14 | 14 |
| R4 | 22 | 10 | 10 | 22 | 22 | 10 | 10 | 10 | 10 | 10 |
| H1 | 2 | 2 | 2 | 2 | 2 | 2 | 2 | 2 | 2 | 2 |
| H2 | 4 | 4 | 4 | 4 | 4 | 4 | 4 | 4 | 4 | 4 |
| C1 | 10 | 10 | 10 | 10 | 14 | 10 | 9 | 10 | 14 | 14 |
| C2 | 8 | 8 | 12 | 8 | 8 | 8 | 7 | 12 | 8 | 12 |
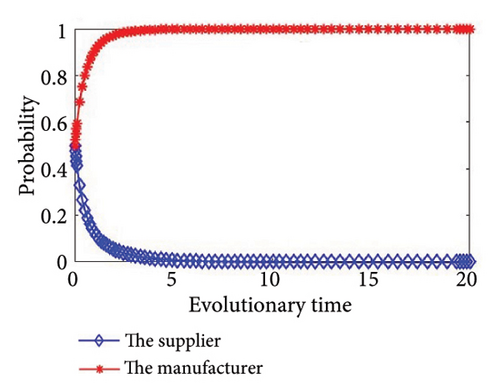
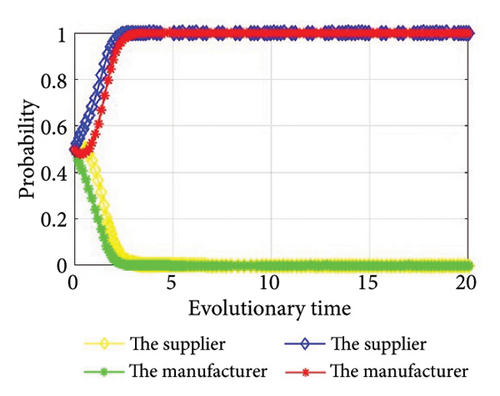
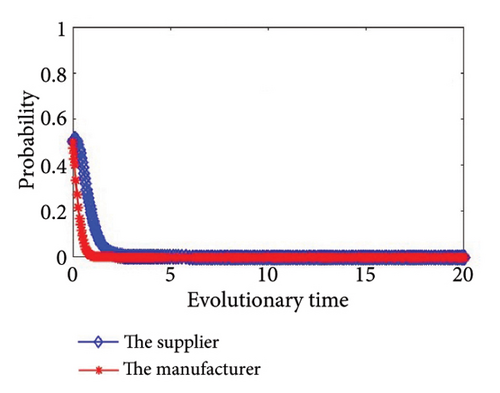
Then, we simulate the values in Table 4 to further determine the stability of the system and authenticate the accuracy of the game model. The outcomes of the simulation are illustrated in Figure 2. From Figure 2, we can see that the simulation results are completely consistent with the stability analysis results in Section 3, and no matter what the condition, the supplier and the manufacturer will eventually have a stable strategy. In addition, the values of Group 6 and Group 7 meet the same condition, as shown in Figure 2(f); there will be two stability strategies at (0, 0) and (1, 1). In other words, the supplier and the manufacturer will both choose to cooperate in green production, or they will both choose to refuse to cooperate in green production.
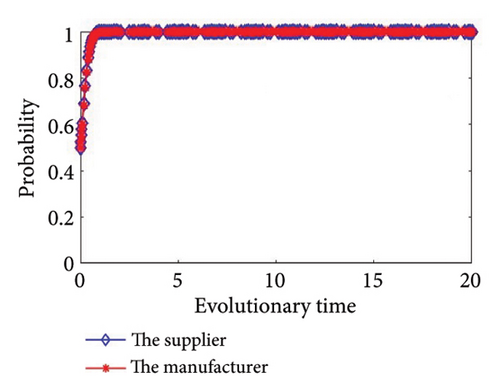
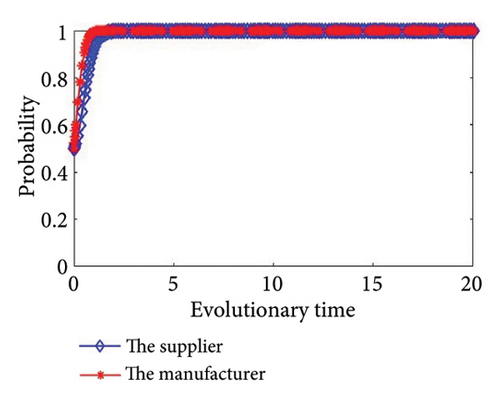
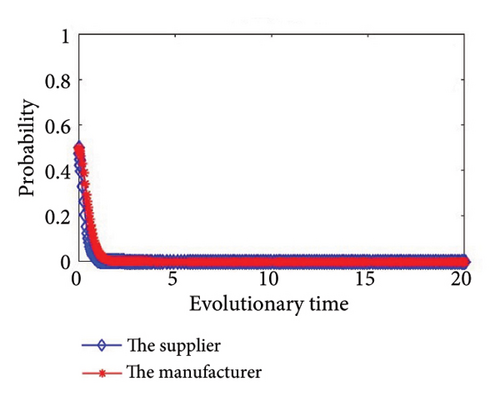
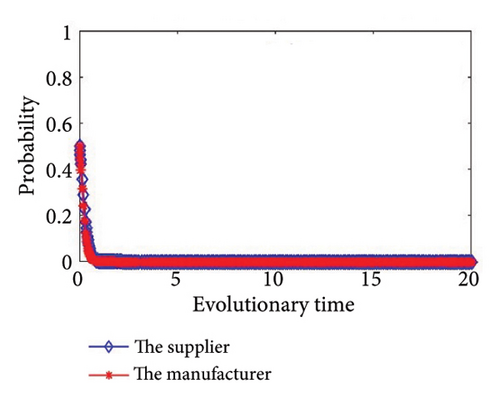
Based on the system stability analysis and simulation analysis of the above different conditions, we can see that when ξ3 > 0 and ξ4 > 0, there are two saddle points, one central point, one unstable point, and one equilibrium point. The outcome of the simulation is illustrated in Figure 2(a); both sides of the game reach a stable state at point (1, 1), that is, both the supplier and manufacturer will choose a cooperative green production strategy. At this time, λR3 + H1 > C1 + S1 and (1 − λ)R4 + H2 > C2 + S2, when the supplier or manufacturer conducts green production alone, the sum of the incremental revenue and the reputation gains is greater than the sum of the investment cost and additional loss of green production; in other words, the total revenue of green production by the supplier or the manufacturer alone is greater than the expenditure, so they will choose to carry out green production strategies.
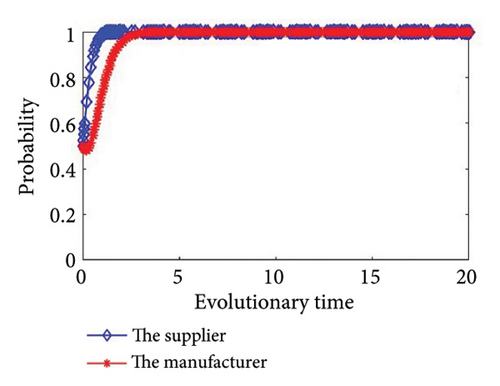
When ξ3 > 0 and ξ4 < 0, the outcomes of the simulation are illustrated in Figures 2(b) and 2(c). We can see that when ξ3 > 0, the total revenue of green production by the supplier alone is greater than the expenditure, cooperation in green production will increase the incremental revenue of the supplier and avoid additional losses in the green production process, so the supplier will choose to cooperate in green production. At the same time, when ξ4 < 0, the manufacturer’s total revenue from green production alone is less than the expenditure. At this time, it is imperative to take into account the expenditure that the manufacturer will incur due to potential disruptions in the supply chain. The cost of supply chain break mentioned in this article mainly refers to the losses caused by supply chain disruption when one party chooses to cooperate but the other party refuses to cooperate, that is, when upstream suppliers and downstream manufacturers fail to achieve synergy. This loss needs to be borne by the noncooperative party. The risk coefficient of chain break is the possibility of supply chain break. When C2 − ((1 − λ)R4 + H2) < θM2, the manufacturer will choose to cooperate. In essence, when the cost of supply chain break is greater than the difference between the manufacturer’s investment cost of green production and the total revenue of green production alone, the manufacturer will choose to cooperate; on the contrary, the manufacturer will choose to refuse to implement green production.
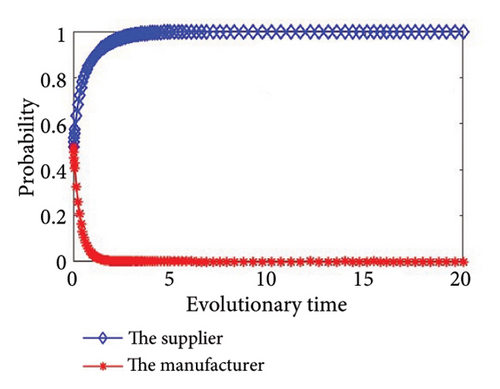
When ξ3 < 0 and ξ4 > 0, the outcomes of the simulation are illustrated in Figures 2(d) and 2(e). Similarly, when ξ4 > 0, the manufacturer will choose to cooperate in green production. At the same time, when C1 − (λR3 + H1) < θM1, the supplier will choose to cooperate. In essence, when the cost of supply chain break is greater than the difference between the supplier’s investment cost of green production and the total revenue of green production alone, the supplier will choose to cooperate; on the contrary, the supplier will choose to refuse to implement green production.
When ξ3 < 0 and ξ4 < 0, the outcomes of the simulation are illustrated in Figures 2(f), 2(g), 2(h), and 2(i). When C1 − (λR3 + H1) < θM1 and C2 − ((1 − λ)R4 + H2) < θM2, the supplier and the manufacturer will both choose to cooperate in green production, or they will both choose to refuse to cooperate in green production. Otherwise, the supplier and the manufacturer will choose to refuse to implement green production.
4.2. Sensitivity Analysis
To reinforce the validation of the evolutionary game model and elucidate the intricate interplay between various influencing factors and system stability, as so to simulate whether upstream suppliers and downstream manufacturers will converge toward cooperation in the evolution of green production strategies, this part will use MATLAB software to simulate and analyze the evolution trajectory of the equilibrium point under the condition of two ESS points. The sixth set of parameters is used in the following simulation.
4.2.1. The Influence of the Initial Willingness to Cooperate Among Supply Chain Members on the Final Result of the Evolutionary Game
According to the numerical simulation, we can get the following corollaries.
Corollary 5. The initial willingness of the supplier and the manufacturer, x and y, has an impact on evolutionary stability, and there are thresholds that can cause them to change their strategies.
Proof 8. In this part, we assume that the manufacturer’s initial willingness to cooperate remains constant at y = 0.5, whereas the supplier’s initial willingness to cooperate varies across the values of x, specifically 0.2, 0.4, 0.60, 0.61, 0.7, and 0.8. As shown in Figure 3, when x = 0.2, 0.4, 0.60, the evolutionary stability strategy is (0, 0), and both the supplier and the manufacturer opt for noncooperation. When x = 0.61, 0.7, 0.8, the evolutionary stability strategy is (1, 1), and both parties elect to collaborate in green production. Similarly, we assume that the supplier’s initial willingness to cooperate remains constant at x = 0.5, whereas the manufacturer’s initial willingness to cooperate varies across the values of y, specifically 0.2, 0.4, 0.60, 0.61, 0.7, and 0.8. As shown in Figure 4, when y = 0.2, 0.4, 0.60, the evolutionary stability strategy is (0, 0), and both the supplier and the manufacturer opt for noncooperation. When y = 0.61, 0.7, 0.8, the evolutionary stability strategy is (1, 1), and both parties elect to collaborate in green production.
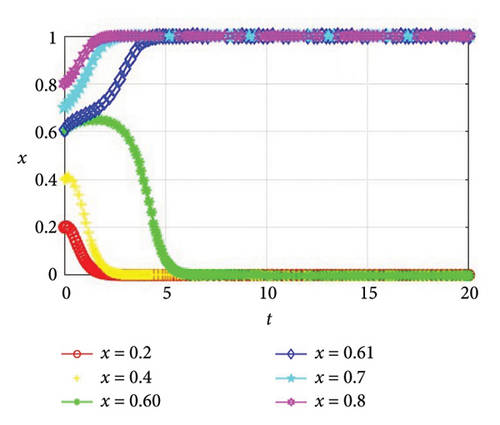
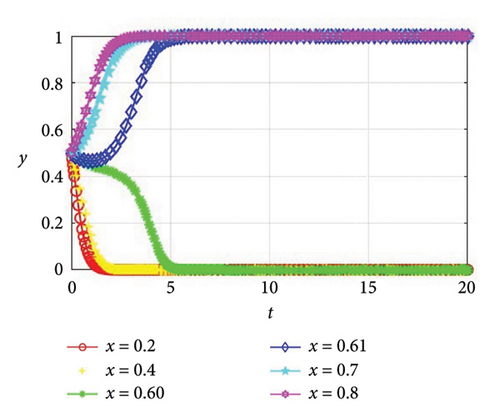
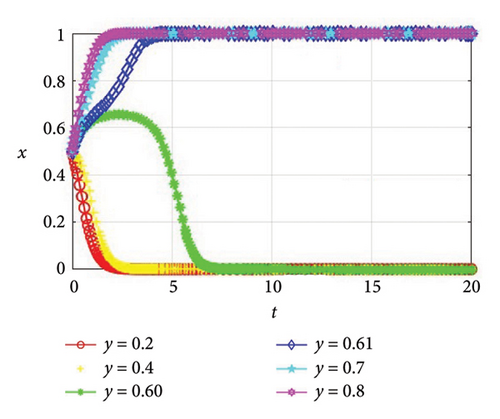
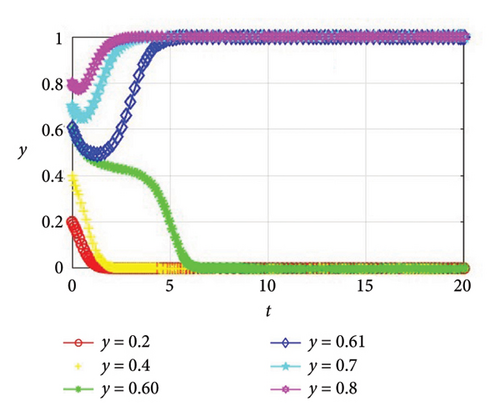
According to Figures 3 and 4, it can be found that with the initial willingness of 0.5 as the standard, the supplier will only choose cooperation when the initial disposition of the supplier toward cooperation is greater than 0.61. This is because the supplier needs to invest a certain amount of funds when choosing green production, and there is financial pressure. However, due to the further fierce market competition, enterprises need to introduce new technologies to improve their core competitiveness, so the initial disposition of the supplier toward cooperation in green production is high, and when the initial willingness is slightly higher than the standard, they are more inclined to improve their influence to obtain profits. The same can be said for the manufacturer. Thus, Corollary 5 can be attained.
4.2.2. The Influence of Investment Cost of the Enterprise on the Final Result of the Evolutionary Game
Corollary 6. The green production investment costs of the supplier and the manufacturer, C1 and C2, have an impact on evolutionary stability, and there are thresholds that can cause them to change their strategies.
Proof 9. In this part, we will delve into the influence of green production investment costs on the evolution outcomes of both the supplier and the manufacturer. First, we set the supplier’s investment cost C1 to be 7, 9.3, 9.4, 9.5, and 11, respectively, and other initial values remain unchanged. As shown in Figure 5(a), C1 = 9.4 is the critical condition for stable state (0, 0) to be transformed into stable state (1, 1). Although the willingness x of the supplier to cooperate in green production will remain stable, it will not reach the extreme values of 0 or 1. When C1 ≥ 9.5, as the investment cost increases, the supplier will be more cautious about investment, so they will opt against collaborating in green production, and the system will evolve in the direction of noncooperation. When the investment cost is within the threshold range, that is, C1 ≤ 9.3, since the investment cost is within the acceptable range of the supplier, in order to better adapt to the market development trend and improve the competitiveness of the enterprise, the enterprise will decide to engage in collaborative green production efforts, and the system will evolve in the direction of cooperation.
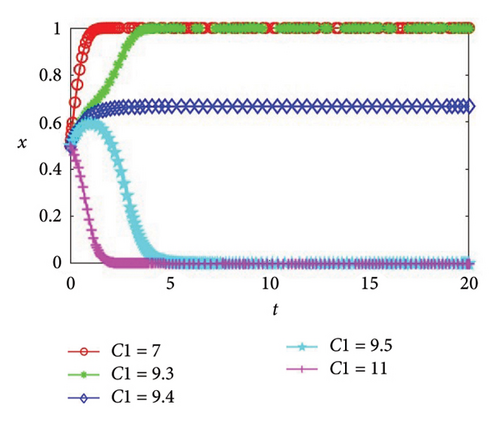
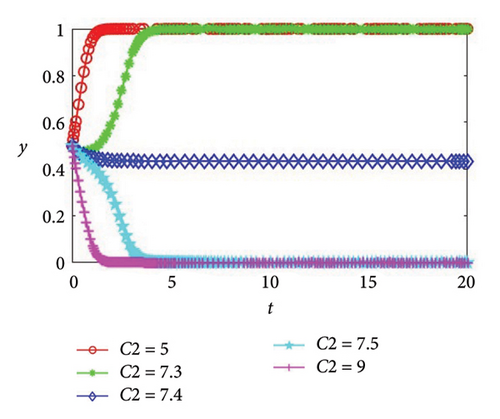
Then, we set the manufacturer’s investment cost C2 values of 5, 7.3, 7.4, 7.5, and 9, and other initial values remain unchanged. It can be seen from Figure 5(b) that C2 = 7.4 is the critical condition for the manufacturer’s investment cost to transform the stable state (0, 0) into the stable state (1, 1). At this time, although the willingness y of the manufacturer to cooperate in green production will remain stable, it will not reach the extreme values of 0 or 1. When C2 ≥ 7.5, the same as the supplier, with the increase of investment cost, the manufacturer will be more cautious than the supplier, so the manufacturer will opt against collaborating in green production, and the system will evolve in the direction of noncooperation. When the investment cost is within the threshold range, that is, C2 ≤ 7.3, since the investment cost is within the acceptable range of the manufacturer, in order to better meet the low-carbon preferences of consumers and expand the scope of sales, enterprises will decide to engage in collaborative green production efforts, and the system will evolve in the direction of cooperation. In addition, it can be found from Figure 5 that the greater the absolute value of the difference between the investment cost of the supplier or the manufacturer and the threshold value, the faster the system convergence speed. Thus, Corollary 6 can be attained.
4.2.3. The Influence of the Risk Coefficient of the Supply Chain Break on the Final Result of the Evolutionary Game
Corollary 7. The supply chain disruption risk coefficient of the supplier and the manufacturer, θ, has an impact on evolutionary stability, and there are thresholds that can cause them to change their strategies.
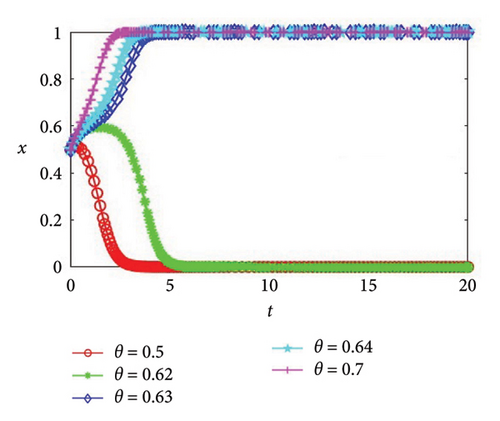
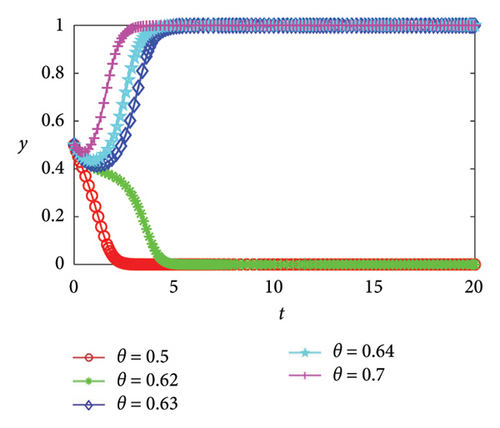
Proof 10. In this part, we set the risk coefficients of the supply chain break to values of 0.5, 0.62, 0.63, 0.64, and 0.7 respectively, with other initial values unchanged. As depicted in Figure 6, as the risk coefficient of chain break escalates, both parties in the game demonstrate a heightened willingness to collaborate on green production initiatives. The critical condition for the transformation from stable state (0, 0) to stable state (1, 1) is within the range of 0.62–0.63. When θ ≥ 0.63, enterprises of both sides tend to cooperate in green production; when θ ≤ 0.62, enterprises of both sides tend to refuse to cooperate in green production. When the risk coefficient of supply chain break is relatively small, the loss probability of enterprises not cooperating is relatively small, so the loss of enterprises not cooperating is less than the investment cost and additional loss during cooperation. Meanwhile, investment is risky. Faced with high expenditure and high risk, enterprises will adopt conservative strategies and finally choose not to cooperate. With the increasing risk coefficient of supply chain break, the loss probability of enterprises without cooperation is also increasing. At this time, cooperation requires high expenditure, and there is a great risk of loss if they do not cooperate. In addition, noncooperation will not bring additional benefits, so enterprises will choose cooperation to increase benefits. In addition, we can also find from Figure 6 that the larger the absolute difference between the risk coefficient of supply chain break and the threshold value, the quicker the convergence speed of the system. Thus, Corollary 7 can be attained.
5. Conclusions
The evolutionary game model proposed in this paper incorporates real-world complexities such as bounded rationality, incomplete information, and supply chain disruption risk into the supply chain environment, thus promoting the development of supply chain risk, green production, and evolutionary game theory. By analyzing the dynamic stability of supply chain interactions under green production scenarios, the model provides valuable insights into the decision-making process of supply chain partners. In effect, the model provides a reference for policymakers to design incentives and regulations that promote stable and sustainable supply chain relationships. For industry stakeholders, the model enables more informed decision-making by providing insights into the potential outcomes of various green production strategies. Ultimately, this research helps advance the broader goal of sustainable practices within the supply chain for the benefit of society and the environment.
- 1.
When the total revenue of green production alone by the supplier or manufacturer is greater than the expenditure, and the cost of supply chain disruption is greater than the difference between the investment costs of green production and the total revenue of green production alone, the system will evolve to either (0, 0) or (1, 1) equilibrium.
- 2.
The willingness of the supplier and manufacturer to cooperate in green production, the investment cost of green production, and the risk coefficient of supply chain disruption all affect the evolution of the system. In addition, each influence factor has a threshold for changing from a stable state (0, 0) to a stable state (1, 1).
- 3.
The increase of cooperation willingness and risk coefficient of supply chain break increases the possibility of system equilibrium toward (1, 1), while the increase of investment cost decreases the possibility of system equilibrium toward (1, 1). At the same time, the larger the difference between investment cost or risk coefficient and their respective thresholds, the faster the system convergence speed. By formulating relevant policies, the system can meet the conditions of evolutionary stability strategy (1, 1), which can promote enterprises of supply chains to realize cooperative green production faster.
From the above results, some recommendations are presented to the participants (the supplier and manufacturer) who implement green production. On the one hand, from the perspective of sustainable development of the whole society, suppliers and manufacturers should actively communicate, operate with integrity to avoid unnecessary risks caused by loss, and work together to promote green production, reduce the damage to the environment, and make contributions to society. On the other hand, from the perspective of sustainable development of enterprises themselves, suppliers and manufacturers should conform to the trend of green development, combine their advantages, and build strategic alliances to improve the overall profits of the supply chain and their core competitiveness. In addition, for the government, it is necessary to establish an incentive mechanism for green production and provide incentives such as financial subsidies and loan concessions to enterprises that actively participate in green production. At the same time, through policy guidance and publicity, enterprises should enhance their awareness of green production and cooperation, reduce their default behaviors, and thus reduce the risk of supply chain break.
This paper has some shortcomings, such as not considering the government’s role in promoting green production, the information interaction ability between suppliers and manufacturers, the market demand for eco-friendly products and other factors that affect the upstream and downstream cooperation in the supply chain to carry out green production. Future research endeavors will aim to address these shortcomings and further delve into the evolutionary game dynamics involving enterprises, governments, and consumers.
Conflicts of Interest
The authors declare no conflicts of interest.
Funding
This work was supported by the R&D Program of Beijing Municipal Education Commission (Grant No. KM202310038001) and Ministry of Education, Humanities and Social Sciences Project (Grant No. 23YJCZH182).
Acknowledgments
This work was supported by the R&D Program of Beijing Municipal Education Commission (Grant No. KM202310038001) and Ministry of Education, Humanities and Social Sciences project (Grant No. 23YJCZH182).
Open Research
Data Availability Statement
The data that the authors used in the manuscript are simulated data.


