Strategies to Mitigate Model Drift of a Machine Learning Prediction Model for Acute Kidney Injury in General Hospitalization
Abstract
Background: Model drift is a major challenge for applications of clinical prediction models. We aimed to investigate the effect of two strategies to mitigate model drift based on a previously reported prediction model for acute kidney injury (AKI).
Methods: Deidentified electronic medical data of inpatients in Sichuan Provincial People’s Hospital from January 1, 2019, to December 31, 2022, were collected. AKI was defined by the KDIGO criteria. The top 50 laboratory variables, alongside with sex, age, and the top 20 prescribed medicines were included as predictive variables. In model optimization, the convolution neural network module was replaced by a self-attention module. Periodical refitting with accumulative data was also conducted before temporally external validations. The performance of the innovated model (ATRN) was compared with the previous model (ATCN) and other four models.
Results: A total of 150,373 admissions were identified. The annual incidences of AKI varied between 5.57% and 5.8%. The performance of the models which had used temporal features profoundly declined over time. The ATRN model with module more suitable to capture short-term time dependencies outperformed the other five models both in C-statistics and recall rates perspectives. Periodic refitting the prediction model with accumulative data also helped to effectively mitigate the model drift, especially in models with time series data.
Conclusions: Enhancing the model’s ability to capture short-term time dependencies in time series data and periodic refitting with accumulative data were both capable of mitigating the model drift. The best improvement of model performance was observed in the combination of these two strategies.
1. Introduction
Acute kidney injury (AKI) is a major clinical problem and heavy health burden globally [1]. The lack of specific and effective treatments for AKI has spawned research on AKI prediction models [2]. In recent years, the wide application of electronic health record (EHR) systems has greatly facilitated clinical use of automatic prediction models, especially for diseases with unequivocal diagnostic criteria such as AKI with KDIGO criteria [3–5]. The rapid advances of machine learning algorithms also accelerated research on prediction models in biomedicine field due to their outstanding abilities to process feature interactions [6–8], among which the recurrent neural network algorithm has been mostly reported [9–11]. We had previously reported a machine learning prediction model for AKI in general hospitalization which was based on the attention convolution network (ATCN) algorithm [10]. This model demonstrated higher prediction accuracy compared with models based on conventional regressions.
Despite of the enormous number of publications, prediction models still face the dilemma of high heterogeneities [2], thus rarely have wide-ranging applications [12, 13]. One of the central challenges for prospective and long-term applications of such models is model drift [11, 14–18], which is defined as deterioration in performance of a well-trained model over time due to changes in the environment or evolving data [16] and can be divided into two categories. One category is concept drift, occurring when the statistical features of predicted outcomes unexpectedly change over time [16, 19]. The other category is called data drift, which occurs when the changed distribution of data renders the already learned features in the model obsolete and invalid, inevitably resulting in decreased predictive performance [20]. The latter one is the main reason of model drift, particularly seen in prediction models with unbalanced data. In this case, low incidence of the predicted outcome leads to increased learning difficulty and prevents the model from timely updating learned features which easily changed over time.
In prediction models with time features, especially high-order time features, model drift is a pronounced phenomenon and has been reported in literature [19–21]. A number of studies have investigated the impact of model drift and proposed solutions to address this problem [22, 23]. Xu et al. proposed a method for anomaly detecting model drift that could effectively managing model drift; however, it cannot handle models with temporal features [22]. Similarly, Song et al. designed a novel drift adaptation regression (DAR) framework to predict the label variable for data streams experiencing model drift and temporal dependency; however, their work still did not take into account the impact of temporal features on model drift [24]. There is still a lack of research investigating the relationship between model drift and time features, as well as effective strategies to mitigate model drift. Ongoing research efforts are necessary to further advance understanding and develop robust solutions to mitigate model drift.
Although strategies that can mitigate model drift may contribute to real applications of prediction models, there is yet no good way to completely eliminate model drift. The most common resolution to mitigate the impact of model drift is to refit the models over time [19, 21]. However, it is not well reported how often the models should be refitted or how to make the models more resistant to model drift. In addition, considering the influence of time features on model drift, algorithms that can better capture short-term time dependency in time series data might also help to diminish the impact of model drift.
In this study, we investigated the effect to mitigate model drift of two strategies. First, we developed a novel model based on attention recurrent network (ATRN) algorithm, which could improve capturing of short-term time dependency in time series data and compared it with the previous ATCN model and four models developed using conventional algorithms. Second, we fitted these models with accumulated data to update the learned features and examined the changes of model performance. The results indicated the best improvement of model performance and resilience against model drift derived from a combination of these two strategies. We hope our findings could help future applicability of such clinical prediction models.
2. Methods
2.1. Data Resources
Deidentified electronic medical data of all patients admitted in Sichuan Provincial People’s Hospital from January 1, 2019, to December 31, 2022 were retrospectively collected from the hospital’s local electronic health record (EHR) system. Patients who had been hospitalized for at least 3 days and had creatinine tested at least twice during the index hospitalization were included in the study population. Hospitalized patients who had been in the hospital during the study period but discharged after December 31, 2022, were excluded. Data from obstetrics department and pediatric department were also excluded. The requirement for informed consent from participants was waived by the Institutional Review Board of Sichuan Provincial People’s Hospital as this was a retrospective investigation of deidentified data (no. 2017.124).
2.2. Outcome Definition
AKI was defined according to the serum component in kidney disease: Improving Global Outcomes (KDIGO) criteria, that is, serum creatinine (Cr) increased by ≥ 26.5 μmol/L or 1.5 times compared with the baseline serum Cr during hospitalization [25]. Baseline serum Cr was the first test result after admission or the last test value in the electronic information system within 7 days prior to admission, whichever occurred first. Each admission was considered independent and had AKI labeled only once if multiple episodes of AKI had occurred during the index admission.
2.3. Algorithm Optimization
The previous ATCN model had utilized an attention model and a convolution neural network (CNN) module to capture hidden high-order features and short-term dependency, respectively [10]. In the new ATRN model in the present study, the CNN module was replaced by a self-attention module to better capture short-term time dependency in time series data [26] (see details of the ATRN model in Supporting Figure 1). As in the ATRN model, the dynamic prediction paradigm in the ATRN model utilized features within a 3 day time interval to predict the occurrence of AKI within the next 24 h. In other words, the feature extraction window and prediction window were 3 days and 1 day, respectively.
2.4. Data Processing
Data processing followed the same procedure as published before [10]. In brief, four categories of variables were extracted from the EHR system, including demographic variables, admission variables, laboratory variables, and prescription variables (see details in Supporting Table 1). To facilitate data collection, we used variables that could be automatically extracted from the hospital’s EHR system; thus, most of the collected variables were laboratory test results. All laboratory variables were sorted in descending order based on the detection frequency. Among the 1280 laboratory test variables collected in the dataset, the top 50 variables alongside sex, ethnicity, age at admission, and the top 20 prescribed medicines were included as predictive variables in the prediction model to reduce the impact of missing data values. XGBoost was used to measure the importance of the included features (see Supporting Figure 2).
Statistics, including mean, median, standard deviation, and interquartile range, were calculated for each continuous variable using a one-day window. Categorical variables including ethnicity, sex, and the 20 most prescribed medicines in the prescription records were converted into digital features using one-hot coding during modeling. Age at admission was transferred to a categorical variable represented as ≥ 65 years versus younger than 65 years. For time variables, missing data were imputed with the most recent value for the index patient. For nontime variables, missing values were filled with the mean value of the overall study population in the most recently previous feature extraction window.
It should be noted in this study, data imbalance was a remarkable issue as the incidence of AKI was less than 10%. To solve this problem, we first resampled using oversampling method and then trained the model with sigmoid cross entropy loss which would assign higher training weights to samples with low occurrence probability [27].
2.5. Performance Assessment
Discrimination and calibration abilities were assessed using the area under the ROC curve (AUC, referred as C-statistics hereafter) and recall rate, respectively. The Kolmogorov–Smirnov value derived from the ROC curve was used to determine the threshold for calculation of recall rates. Internal validations were conducted using five-fold cross validation. External validations were conducted using data of different time periods. To compare with other commonly used algorithms, we also developed four models using logistic regression (LR), recurrent neural network (RNN), convolutional neural network (CNN), and deep neural network (DNN) algorithms.
To investigate the robustness of model performance over time, we used quarterly data of 2020 and 2021 to externally validate all six models that had been trained with the data of 2019. C-statistics and recall rates of the six models in each quarter were compared. Next, we retrained the six models with accumulative data, adding data of the next half year after the training time period each time, and compared the performance of these six models in both internal and external validations. Sensitivity analysis was planned if necessary.
2.6. Statistical Analysis and Software
Descriptive statistics were generated. Categorical data were expressed as number and percentage, and continuous data were expressed as mean (standard deviation) or median (interquartile range). Normality was determined by the Shapiro–Wilk test.
The experimental platform was built using a 64 bit Ubuntu 16.04 LTS operating system and a 4-core Intel i77700K with 16 G memory. The GPU was an Nvidia GTX 1070 with 8 GB video RAM. Python Version 3.7 (Python Software Foundation, Scotts Valley, USA) [28] and R Version 4.2.2 (R Foundation, Vienna, Austria) [29] via PROC, POCR, and ggplot2 packages were used. A simplified flowchart of this study is shown in Figure 1.

3. Results
3.1. Characteristics of the Study Population
A total of 150,373 admissions that met the inclusion criteria were identified, involving 88,265,321 pieces of data. The annual incidences of AKI in 2019, 2020, and 2021 were 5.57%, 5.76%, and 5.8%, respectively. No remarkable differences were found with respect to age, ethnicity, or gender between AKI and non-AKI patients. Patients admitted into internal medicine departments accounted for the highest proportion of total number of diagnosed AKI patients in each year. The incidences of AKI in patients admitted into surgical departments and intensive care units (ICUs) were approximately equal. AKI patients had higher rate of interdepartmental transfer during hospitalization than non-AKI patients. Patients who had presented to emergency departments had higher incidence of AKI. The hospitalization cost of AKI patients was significantly higher than that of non-AKI patients. Basic characteristics of the study population by year are reported in Table 1 (see semiannual characteristics in 2020 and 2021 in Supporting Tables 2–4).
| Basic characteristics | 2019 (n = 48,135) | 2020 (n = 48,239) | 2021 (n = 53,999) | ||||
|---|---|---|---|---|---|---|---|
| AKI (n = 2683) | Non-AKI (n = 45,452) | AKI (n = 2779) | Non-AKI (n = 45,460) | AKI (n = 3156) | Non-AKI (n = 50,843) | ||
| Age (y) | ≤ 60, n (%) | 1389 (51.77) | 26,725 (58.80) | 1199 (43.15) | 23,621 (51.96) | 1377 (43.63) | 27,008 (53.12) |
| > 60, n (%) | 1294 (48.23) | 18,727 (41.20) | 1580 (56.85) | 21,839 (48.04) | 1779 (56.37) | 23,833 (46.88) | |
| Gender | Male, n (%) | 1526 (56.88) | 24,839 (54.65) | 1631 (58.69) | 25,048 (55.10) | 1781 (56.43) | 27,654 (54.39) |
| Female, n (%) | 1157 (43.12) | 20,613 (45.35) | 1148 (41.31) | 20,412 (44.90) | 1375 (43.57) | 23,187 (45.61) | |
| Ethnicity | Han, n (%) | 2506 (93.40) | 42,130 (92.69) | 2557 (92.01) | 41,276 (90.80) | 2903 (91.98) | 46,368 (91.20) |
| Others, n (%) | 177 (6.60) | 3322 (7.31) | 222 (7.99) | 4184 (9.20) | 253 (8.02) | 4473 (8.80) | |
| Interdepartmental transfer | Yes, n (%) | 681 (25.38) | 3309 (7.28) | 779 (28.03) | 4765 (10.48) | 980 (31.05) | 5626 (11.07) |
| No, n (%) | 2002 (74.62) | 42,143 (92.72) | 2000 (72.97) | 40,695 (89.52) | 2176 (68.95) | 45,215 (88.93) | |
| Admission route | Emergency, n (%) | 734 (27.36) | 7225 (15.90) | 1192 (42.89) | 10,882 (23.94) | 1655 (52.44) | 10,575 (20.80) |
| Clinics, n (%) | 1949 (72.64) | 38,227 (84.10) | 1587 (57.11) | 34,578 (76.06) | 1501 (47.56) | 40,266 (79.20) | |
| Admission department | Internal medicine, n (%) | 1125 (41.93) | 23,946 (52.68) | 1034 (37.21) | 23,025 (50.65) | 1307 (41.41) | 24,886 (48.95) |
| Surgery, n (%) | 838 (31.23) | 16,956 (37.31) | 864 (31.09) | 17,568 (38.64) | 869 (27.53) | 20,552 (40.45) | |
| ICU, n (%) | 697 (25.98) | 2818 (6.20) | 849 (30.55) | 3680 (8.10) | 952 (30.16) | 3835 (7.54) | |
| Genecology, n (%) | 23 (0.86) | 1732 (3.81) | 31 (1.15) | 1189 (2.61) | 26 (0.90) | 1568 (3.06) | |
| Billing (yuan) | Total, median (IQR) | 69,402.34 (97,339.03) | 23,896.22 (33,413.35) | 72,634.47 (102,027.29) | 25,904.23 (39,095.00) | 70,467.04 (116,376.31) | 25,720.51 (39,749.49) |
| Medications, median (IQR) | 19,854.38 (35,569.17) | 5561.02 (6779.43) | 22,037.22 (39,177.91) | 5758.16 (8139.69) | 21,221.64 (46,776.29) | 5130.93 (7752.43) | |
| Operations, median (IQR) | 10,997.25 (15,765.96) | 4300.00 (7929.53) | 10,975.50 (16,479.59) | 4901.02 (8402.19) | 9855.95 (17,727.55) | 5054 (8297.30) | |
| Examinations, median (IQR) | 16,287.00 (18,157.50) | 6662.00 (5607.50) | 16,679.00 (18,819.50) | 6928.00 (6273.12) | 17,161.00 (22,571.50) | 6603.00 (6399.00) | |
- Abbreviations: AKI, acute kidney injury; ICU, intensive care unit; IQR, interquartile range; n, number; y, year.
3.2. Effects of Model Drift
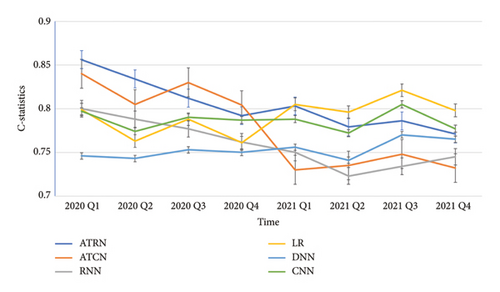
In the external validations using quarterly data (Figure 2 and Supporting Tables 5 and 6) as well as semiannual data of 2020 and 2021 (Table 2), the discrimination capabilities of the ATRN, ATCN, and RNN models trained with 2019 data gradually decreased over time. It is worth noting that the ATRN and ATCN models, which heavily relied on temporal features, exhibited a more pronounced decline in performance compared to the CNN, DNN, and LR models, which remained relatively stable. These findings indicate that model drift is common, especially in models that are heavily dependent on time features.
| Model | Internal validation | External validation | ||||||||
|---|---|---|---|---|---|---|---|---|---|---|
| 2020 Q1–2 | 2020 Q3–4 | 2021 Q1–2 | 2021 Q3–4 | |||||||
| C-statistics (95% CI) | Recall rates (95% CI) | C-statistics (95% CI) | Recall rates (95% CI) | C-statistics (95% CI) | Recall rates (95% CI) | C-statistics (95% CI) | Recall rates (95% CI) | C-statistics (95% CI) | Recall rates (95% CI) | |
| ATRN | 0.928 (0.911–0.935) | 0.943 (0.937–0.950) | 0.856 (0.850–0.862) | 0.792 (0.780–0.805) | 0.822 (0.812–0.833) | 0.778 (0.775–0.780) | 0.795 (0.786–0.803) | 0.717 (0.710–0.724) | 0.776 (0.766–0.785) | 0.686 (0.678–0.694) |
| ATCN | 0.919 (0.913–0.925) | 0.927 (0.916–0.935) | 0.832 (0.829–0.843) | 0.784 (0.779–0.796) | 0.815 (0.810–0.823) | 0.768 (0.760–0.770) | 0.785 (0.780–0.793) | 0.727 (0.710–0.724) | 0.796 (0.786–0.795) | 0.706 (0.698–0.714) |
| RNN | 0.945 (0.934–0.955) | 0.898 (0.888–0.909) | 0.758 (0.747–0.769) | 0.633 (0.627–0.639) | 0.764 (0.758–0.769) | 0.612 (0.609–0.614) | 0.767 (0.763–0.771) | 0.638 (0.632–0.644) | 0.761 (0.754–0.768) | 0.635 (0.621–0.649) |
| DNN | 0.921 (0.907–0.937) | 0.876 (0.865–0.887) | 0.752 (0.744–0.759) | 0.662 (0.655–0.669) | 0.752 (0.747–0.757) | 0.612 (0.608–0.616) | 0.749 (0.745–0.753) | 0.640 (0.636–0.644) | 0.743 (0.739–0.747) | 0.547 (0.536–0.558) |
| CNN | 0.824 (0.820–0.829) | 0.733 (0.727–0.739) | 0.794 (0.789–0.799) | 0.691 (0.685–0.697) | 0.779 (0.776–0.782) | 0.670 (0.664–0.676) | 0.768 (0.756–0.780) | 0.669 (0.658–0.680) | 0.773 (0.765–0.781) | 0.659 (0.654–0.664) |
| LR | 0.822 (0.817–0.828) | 0.740 (0.725–0.755) | 0.791 (0.785–0.797) | 0.657 (0.648–0.666) | 0.780 (0.773–0.786) | 0.669 (0.663–0.675) | 0.796 (0.792–0.800) | 0.689 (0.681–0.698) | 0.828 (0.814–0.841) | 0.660 (0.646–0.674) |
- Abbreviations: ATCN, attention convolution network; ATRN, attention recurrent network; CI, confidence interval; CNN, convolution neural network; DNN, deep neural network; LR, logistic regression; Q, quarter; RNN, recurrent neural network.
3.3. Diminishing Model Drift by Algorithm Optimization
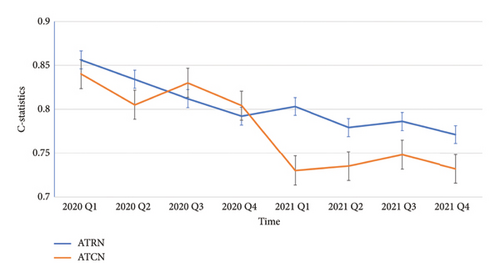
All models were first trained using data from 2019 and externally validated using quarterly data from different time periods afterward. Compared with ATCN, ATRN demonstrated a noticeably smoother transition, confirming the effects of mitigating model drift via algorithm optimization (Figure 3 and Supporting Tables 5 and 6).
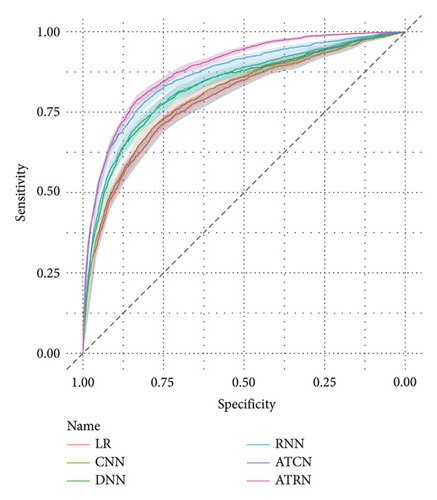
The external validation results also showed the advantages of the ATRN model over the other four models in terms of both C-statistics and recall rates, particularly in short prediction periods (Figure 4 and Supporting Tables 5 and 6).
3.4. Diminishing Model Drift by Periodic Refitting
After refitting with accumulative data, the performance of the ATRN model was still the best among the six prediction models in the four internal validations with different training populations (Table 3). Generally, models that had considered time series, including the ATRN, ATCN, and RNN models, performed better than those that had not—primarily the CNN and LR models—showing that time features are essential for the performance of the prediction model.
| Model | Training population | |||||||
|---|---|---|---|---|---|---|---|---|
| 2019 | 2019 + 2020 Q1–2 | 2019 + 2020 | 2019 + 2020 + 2021 Q1–2 | |||||
| C-statistics (95% CI) | Recall rates (95% CI) | C-statistics (95% CI) | Recall rates (95% CI) | C-statistics (95% CI) | Recall rates (95% CI) | C-statistics (95% CI) | Recall rates (95% CI) | |
| ATRN | 0.928 (0.911–0.945) | 0.943 (0.937–0.949) | 0.916 (0.906–0.925) | 0.893 (0.881–0.905) | 0.910 (0.904–0.916) | 0.873 (0.862–0.883) | 0.901 (0.896–0.906) | 0.861 (0.857–0.864) |
| ATCN | 0.919 (0.913–0.925) | 0.927 (0.916–0.938) | 0.910 (0.906–0.914) | 0.901 (0.896–0.906) | 0.894 (0.888–0.900) | 0.883 (0.862–0.883) | 0.895 (0.886–0.904) | 0.872 (0.869–0.875) |
| RNN | 0.945 (0.934–0.955) | 0.898 (0.888–0.908) | 0.929 (0.927–0.931) | 0.877 (0.868–0.886) | 0.900 (0.896–0.904) | 0.859 (0.853–0.864) | 0.893 (0.888–0.898) | 0.833 (0.828–0.838) |
| DNN | 0.922 (0.907–0.937) | 0.876 (0.865–0.887) | 0.962 (0.956–0.968) | 0.900 (0.898–0.902) | 0.969 (0.964–0.973) | 0.953 (0.949–0.957) | 0.956 (0.951–0.961) | 0.917 (0.908–0.925) |
| CNN | 0.824 (0.819–0.829) | 0.733 (0.726–0.739) | 0.853 (0.850–0.856) | 0.783 (0.778–0.788) | 0.829 (0.827–0.831) | 0.735 (0.729–0.741) | 0.842 (0.834–0.850) | 0.731 (0.718–0.744) |
| LR | 0.822 (0.817–0.827) | 0.740 (0.725–0.755) | 0.847 (0.846–0.848) | 0.758 (0.745–0.770) | 0.840 (0.839–0.840) | 0.767 (0.761–0.773) | 0.845 (0.843–0.847) | 0.780 (0.774–0.786) |
- Abbreviations: ATCN, attention convolution network; ATRN, attention recurrent network; CI, confidence interval; CNN, convolution neural network; DNN, deep neural network; LR, logistic regression; Q, quarter; RNN, recurrent neural network.
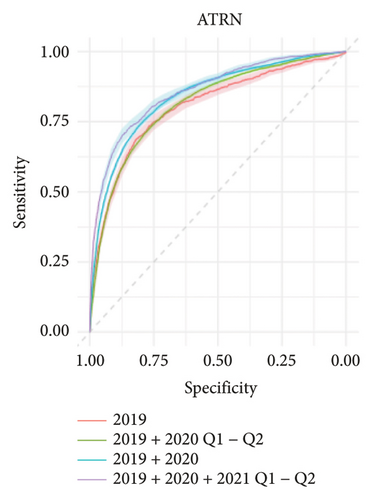
External validations with data of the second half of 2021 of all six prediction models that had been trained with different populations demonstrated periodic training with cumulative data did help to enhance the performance of all six prediction models, both in discrimination and accuracy (Table 4). Again, the most prominent improvement effect was observed in the models that had considered time series, including the ATRN, ATCN, and RNN models, as reflected by the gaps between ROC curves (Figure 5).
| Model | Training population | |||||||
|---|---|---|---|---|---|---|---|---|
| 2019 | 2019 + 2020 Q1–2 | 2019 + 2020 | 2019 + 2020 + 2021 Q1–2 | |||||
| C-statistics (95% CI) | Recall rates (95% CI) | C-statistics (95% CI) | Recall rates (95% CI) | C-statistics (95% CI) | Recall rates (95% CI) | C-statistics (95% CI) | Recall rates (95% CI) | |
| ATRN | 0.775 (0.766–0.784) | 0.686 (0.677–0.694) | 0.835 (0.824–0.846) | 0.741 (0.736–0.746) | 0.864 (0.857–0.872) | 0.849 (0.844–0.855) | 0.885 (0.879–0.8926\) | 0.851 (0.848–0.854) |
| ATCN | 0.795 (0.786–0.804) | 0.705 (0.697–0.713) | 0.815 (0.810–0.820) | 0.744 (0.736–0.752) | 0.848 (0.841–0.855) | 0.842 (0.836–0.849) | 0.864 (0.853–0.875) | 0.822 (0.819–0.825) |
| RNN | 0.761 (0.754–0.768) | 0.635 (0.621–0.648) | 0.801 (0.794–0.807) | 0.739 (0.735–0.743) | 0.805 (0.799–0.811) | 0.741 (0.735–0.747) | 0.834 (0.825–0.843) | 0.755 (0.746–0.764) |
| DNN | 0.743 (0.739–0.747) | 0.547 (0.536–0.557) | 0.811 (0.808–0.815) | 0.762 (0.754–0.770) | 0.811 (0.808–0.814) | 0.757 (0.754–0.760) | 0.827 (0.817–0.837) | 0.795 (0.783–0.807) |
| CNN | 0.773 (0.765–0.781) | 0.659 (0.654–0.664) | 0.834 (0.829–0.839) | 0.742 (0.732–0.752) | 0.849 (0.843–0.855) | 0.781 (0.773–0.789) | 0.850 (0.847–0.853) | 0.746 (0.735–0.756) |
| LR | 0.828 (0.814–0.840) | 0.660 (0.646–0.674) | 0.830 (0.824–0.835) | 0.700 (0.695–0.705) | 0.857 (0.853–0.861) | 0.803 (0.799–0.807) | 0.853 (0.843–0.863) | 0.811 (0.808–0.815) |
- Abbreviations: ATCN, attention convolution network; ATRN, attention recurrent network; CI, confidence interval; CNN, convolution neural network; DNN, deep neural network; LR, logistic regression; Q, quarter; RNN, recurrent neural network.
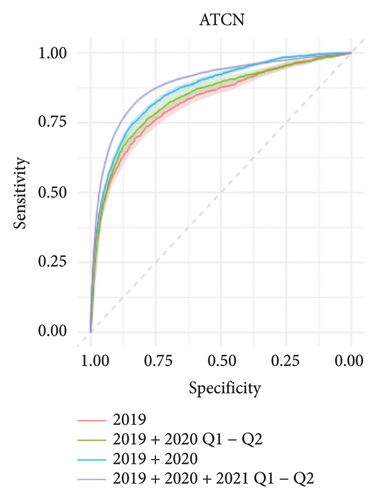
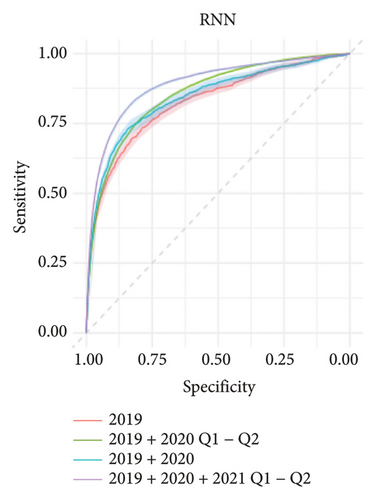
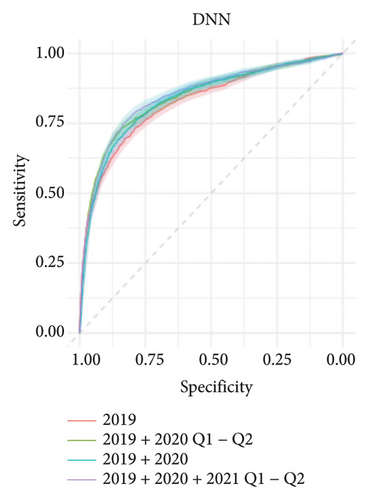
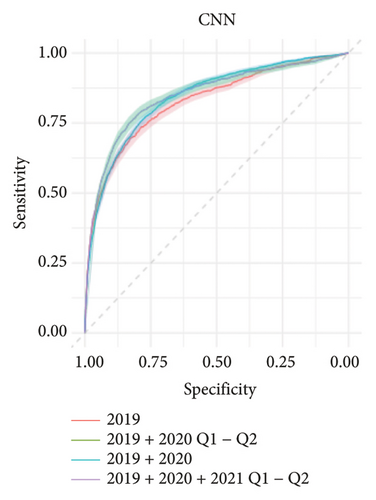
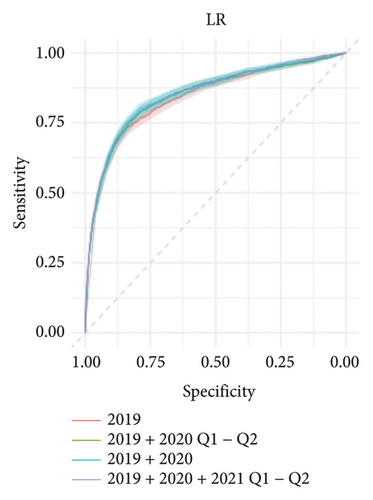
As the performance of the ATRN prediction model gradually decreased over time, we conducted a sensitivity analysis that used the data of the next half year after each individual training time period to externally validate the performance of the six prediction models. The findings again confirmed that the models that had considered time series, including the ATRN, ATCN, and RNN models, benefited most from the training with cumulative data (Supporting Table 7 and Supporting Figure 3). Taken together, these results supported the benefits of periodic refitting for long-term application of the prediction models.
4. Discussion
The findings of this study demonstrated that model drift is a common phenomenon in clinical prediction models, especially models that heavily reliant on time features. We investigated the effects of two strategies to mitigate the model drift. One strategy was model optimization via using self-attention module, which could improve capturing of short-term time dependency in time series data. The other strategy was periodically refitting with accumulative data. Both strategies were capable of mitigating the model drift. The best improvement of model performance and resilience against model drift was observed in the combination of these two strategies.
Model drift, defined as defined as deteriorating performance of prediction models over time, has drawn significant attention from researchers in the field of deep learning. To address the issue of model drift, we proposed two strategies in this study. The first strategy is mode optimization by utilizing algorithms that are capable of better capturing short-term time dependencies in time series data. This replacement of CNN module by the self-attention module offers two advantages. First, compared with the CNN module, the self-attention module can simultaneously consider short-term time dependency and interactions among variables, making it better suited for capturing short-term dependencies. In addition, by using the self-attention module, we can avoid the complex operations associated with the effect of convolution sequence on feature orders without losing the interfeature dependencies. Second, the self-attention module in the ATRN model enables the assignment of weights to features within individual feature extraction windows during the dynamic process. This functionality is crucial as it assigns higher weights to features that are closer to the prediction window, enhancing the accuracy of prediction [10, 30]. Our findings have confirmed the benefit of this strategy and provided valuable inspiration for future model design.
The second strategy to mitigate model drift is periodic refitting with accumulative data. Periodic refitting involves continuously updating the learned features in the model, thus countering the consequences of data drift. This strategy is quite practical and easy to conduct in real-world applications. It could be implemented into the computer programs that run clinical prediction models and accomplished automatically inside the EHR. Our findings in this study proved the effectiveness of periodic refitting to mitigate model drift and suggested the potential promise of this methods for long-term application of clinical prediction models in real clinical scenarios.
There were some limitations in this study need to be mentioned. First, selection bias was unavoidable as this was a respective study of data from a single center. Our findings are expecting generalizations to other centers in Sichuan Province for external validations. This is our next step of work and the data collection project has already been initiated. Second, the imbalanced data posed difficulty for data process; however, we have conducted oversampling and sigmoid cross entropy loss training to reduce the influence of imbalanced data on the prediction performance. With the advances of machine learning algorithm, new modules that can better extract and utilize short-term time dependencies might further enhance our abilities to mitigate model drift.
5. Conclusions
The findings of this study demonstrated that model drift is a common phenomenon in clinical prediction models, especially models that heavily reliant on time features. Two strategies, namely, enhancing the model’s ability by algorithm modification to capture short-term time dependencies in time series data and periodic refitting with accumulative data, were both capable of mitigating the model drift. The combination of these two strategies resulted in better improvement in model performance and resilience against model drift than each strategy alone. Both strategies may be considered in the future development and implementation of clinical prediction models to mitigate model drift. This approach will enhance the stability and predictive accuracy of these models, ultimately aiding in the effective management of diseases and the delivery of healthcare services to the community.
Ethics Statement
The study was approved by the institutional Review Board of Sichuan Provincial People’s Hospital (no. 2017.124). Written consent was waived since this was a retrospective study of deidentified data.
Conflicts of Interest
The authors declare no conflicts of interest.
Author Contributions
Jie Xu: conceptualization, methodology, formal analysis, and writing the original draft.
Heng Liu: data curation, formal analysis, methodology, software, and writing the original draft.
Wenjun Mi: data curation and reviewing and editing.
Guisen Li: supervision and reviewing and editing.
Martin Gallagher: supervision and reviewing editing.
Yunlin Feng: conceptualization, methodology, formal analysis, project administration, reviewing and editing, and funding.
Funding
This work was partly supported by the National Natural Science Foundation of China (nos. 81800613 and 62071098) and Sichuan Province Science and Technology Support Program (nos. 2023YFSY0027, 2021YFG0307, and 2022YFG0319). Yunlin Feng was also supported in part by an Australian Government Research Training Program Scholarship (RTP) for study toward a PhD in the Faculty of Medicine.
Acknowledgments
This work was partly supported by the National Natural Science Foundation of China (nos. 81800613 and 62071098) and Sichuan Province Science and Technology Support Program (nos. 2023YFSY0027, 2021YFG0307, and 2022YFG0319). Yunlin Feng was supported in part by an Australian Government Research Training Program Scholarship (RTP) for study toward a PhD in the Faculty of Medicine.
Supporting Information
Supporting Table 1: Four categories of extracted variables.
Supporting Table 2: Basic characteristics of the study population in 2019.
Supporting Table 3: Basic characteristics of the study population in 2020.
Supporting Table 4: Basic characteristics of the study population in 2021.
Supporting Table 5: Performance of the six prediction models trained with data of 2019 in the external validation using quarterly data of 2020.
Supporting Table 6: Performance of the six prediction models trained with data of 2019 in the external validation using quarterly data of 2021.
Supporting Table 7: Performance of the six prediction models trained with different training populations in external validation with data of the next half year right after the training population.
Supporting Figure 1: A diagram of the innovated ATRN model.
Supporting Figure 2: The top 50 laboratory variables included as predictive variables in the prediction model.
Supporting Figure 3: Discrimination performance of the six prediction models trained with different populations in the external validations with data of the next half year right after the training population.
Open Research
Data Availability Statement
The data used and generated in this study are available from the corresponding author upon reasonable request.


