Min–Max Filtering and Exponential Fossa Optimization Algorithm–Based Parallel Convolutional Neural Network for Heart Disease Detection
Abstract
Heart disease is a leading cause of death worldwide, affecting millions of lives each year. Earlier and more accurate heart disease detection helps people to save their valuable lives. Many existing systems remain costly and inaccurate. To overcome these issues, an exponential fossa optimization algorithm–based parallel convolutional neural network (EFOA-PCNN) is proposed in this paper for efficient heart disease detection. Initially, the heart disease data are allowed for data normalization, which is performed by min–max normalization. These normalized data are forwarded to the feature selection phase, which is conducted based on chord distance. Finally, heart disease detection is performed using a parallel convolutional neural network (PCNN) that is trained using the EFOA. Here, the EFOA is developed by the combination of the fossa optimization algorithm (FOA) and exponentially weighted moving average (EWMA). The performance of the proposed EFOA-PCNN is analysed by three metrics, such as specificity, sensitivity, and accuracy, and the F1 score that gained superior values of 91.95%, 91.76%, 91.86%, and 92.39%. These results highlight the robustness and reliability of the proposed method in comparison to traditional approaches.
1. Introduction
The heart is the most important organ in the human body. The functioning of the heart is affected by the damage in vessels and the way it pumps blood to other organs [1]. Heart disease is of various types, including congenital, rheumatic, and coronary heart diseases. Among these heart conditions, the most common type is coronary heart disease, which causes more deaths because of heart attacks. Coronary heart disease [2] risk factors are due to higher blood pressure, smoking, history of family, higher low-density lipoprotein (LDL) cholesterol levels, and age, as well as uncontrolled diabetes. Medical factors and lifestyle leading to a greater risk of heart disease are caused by unhealthy diet, sedentary lifestyle, more alcohol consumption, and obesity. The symptoms of coronary heart disease are pressure, chest pain, shortness of breath, heart palpitations, sweating, dizziness, nausea, and weakness [3]. Nowadays, heart disease is the main cause of death, and the disorder types are classified in multiple ways [4]. Globally, cardiovascular disease is accounting for the leading cause of mortality in every country [5]. The occurrence of heart diseases in patients around the world is affecting hospitals worldwide with more management of immediate medicines [6]. The daily bad life routine affects the healthy heart in people [1].
Predicting disease in the heart is challenging because the medical datasets available are highly imbalanced with more complications [1]. Many traditional methods were available for heart disease diagnosis, such as reports based on medical histories, physical laboratory, and expert symptom analysis. But this diagnosis remains imperfect, expensive, and computationally intensive [7]. Deep learning (DL) is the subset of machine learning (ML). ML is one of the methods utilized for analyzing medical data, processing it, and providing better diagnoses. But the ML model is outdated because of its complexity and lower accuracy [3]. DL shows many applications in speech recognition and medical image diagnosis as they have more added layers. In diagnosis, heart sound forms the early screening, which is very effective [8]. Worldwide, the DL model has various applications in multiple domains. Predictive modelling in medical evaluation is better for treating patients in the healthcare system [9]. Hence, diagnoses with high accuracy and earlier detection help to lower the mortality rate, which is performed only by the DL model [3].
- •
To develop an efficient and accurate system, named the exponential fossa optimization algorithm–based parallel convolutional neural network (EFOA-PCNN) framework for heart disease detection.
- •
To enhance the optimization process through the novel EFOA algorithm.
- •
To evaluate the robustness of the proposed method against traditional approaches using key performance metrics.
- •
In this research, an EFOA-PCNN model is developed for the detection of heart disease, which saves the lives of people.
- •
The feature selection process is performed based on chord distance.
- •
The parallel convolutional neural network (PCNN) is tuned by EFOA, which is formed by the combination of exponentially weighted moving average (EWMA) with fossa optimization algorithm (FOA).
The remaining sections that follow are as follows: Section 2 includes motivation along with various existing literature and challenges; Section 3 covers the proposed EFOA-PCNN for heart disease prediction; Section 4 includes results with comparative discussions; and Section 5 concludes the work.
2. Motivation
Proactive detection and management of heart disease reduce the overall impact of healthcare burden by improving quality of life. However, this is achieved only if the identification methodology is advanced with earlier prediction capability. Even though the method followed for disease prediction is advanced, the challenge remains in its cost and training time. These challenges are eliminated by utilizing the DL model with fine-tuning parameters.
2.1. Literature Survey
Mohialdin et al. [9] modelled principal component analysis (PCA) along with feature selection methods for improvizing heart disease detection. Although this model reduced the overfitting issues by utilizing k-fold cross-validation, this model failed to overcome the limitations on bias issues and data fusion. Khan et al. [1] used the blending-based cardiovascular disease detection network (BlCVDD-Net) for heart disease prediction. This model reduced the error rate with reasonable execution time. However, the BlCVDD-Net model was not implemented on multiple healthcare datasets to improve the generalizability. Rao et al. [7] utilized attention-based gated recurrent unit network–based hybrid mutation–based swarm intelligence (AttGRU-HMSI) for enhancement of heart disease diagnosis. This model managed and integrated the diverse range of input data by ensuring better performance on complex datasets. However, this technique required the collection of more observational data with extensive follow-ups to solve all the issues of the prediction model. Kiruthiga et al. [10] devised extreme gradient boosting-logistic regression (EGBLR) for enhanced detection of heart disease. Even though this method was more flexible and robust, the drawback remained in its tuning process, as it required the best hyperparameters for enhancing the optimal performance. Kilicarslan [11] established a hybrid model by combining particle swarm optimization (PSO) and grey wolf optimization (GWO) to tune the 1D-VGG-16 for heart disease detection. Here, the fine-tuning of control parameters and hyperparameters ensures that the 1D-VGG-16 model is optimized effectively, leading to more accurate predictions. However, this model required more computational resources and time, especially for large datasets. Kumar Dubey, Kumar Sinhal, and Sharma [12] established a DL model by the combination of the crow search optimization algorithm (CSOA) for heart disease detection. Here, the convolutional neural network (CNN) and deep neural network (DNN) were utilized for the classification. It offered a well-balanced performance in terms of minimizing false positives and false negatives. However, the processing time and computational complexity were increased.
Table 1 shows a review of the existing heart disease detection approaches.
| Reference | Method | Advantages | Disadvantages |
|---|---|---|---|
| Mohialdin et al. [9] | PCA | Reduced the overfitting issues. | Failed to overcome the limitations on bias issues and data fusion. |
| Khan et al. [1] | BlCVDD-Net | Reduced the error rate with reasonable execution time. | Not implemented on multiple healthcare datasets. |
| Rao et al. [7] | AttGRU-HMSI | Ensured better performance on complex datasets. | Required collection of more observational data. |
| Kiruthiga et al. [10] | EGBLR | More flexible and robust. | It required best hyperparameters for enhancing the optimal performance. |
| Kilicarslan [11] | PSO + GWO | More accurate predictions. | Required more computational resources and time. |
| Kumar Dubey, Kumar Sinhal, and Sharma [12] | CSOA + DL | Well-balanced performance in terms of minimising false positives and false negatives. | Processing time and computational complexity were increased. |
2.2. Challenges
- •
PCA in [9] mitigated the multicollinearity issues by the generation of uncorrelated principal components. This helped in enhancing the generalizability of the model. However, this model failed to utilize large clinical datasets to improve the reliability and applicability of the model.
- •
BlCVDD-Net in [7] was more robust across different patient groups with reduced overfitting issues. However, this model failed to combine the quantitative attention network architecture (QANA) with other medical imaging analysis for early detection of heart disease.
- •
Doctors require more practical experience and specialized knowledge to identify heart disease. Also, this prediction utilized more time with various tests that remained costly. Despite this long process, the diagnostic results may be unreliable and wrong. Hence, the DL model helps to resolve this improper prediction issue.
3. Proposed Exponential FOA-Based Parallel CNN for Heart Disease Prediction
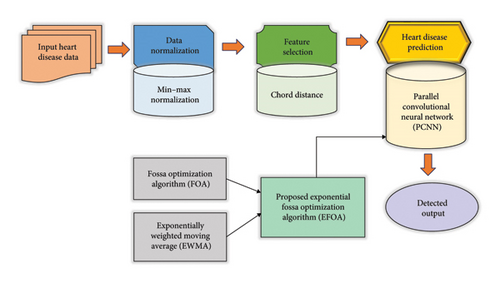
Heart disease prediction accurately identifies the risk of individuals from heart attacks, other chronic conditions, or strokes. In this paper, heart disease is accurately predicted by a DL model, PCNN [13, 14], that is trained by EFOA. At the initial stage, the acquired heart disease data from the dataset [15] are allowed for data normalization, which is performed by min–max normalization [16]. Then, feature selection is performed based on chord distance [17] for the normalized data. Finally, the prediction of heart disease is performed by the EFOA-PCNN. Here, EFOA is the hybridization of EWMA [18] and FOA [19]. The block diagram of the EFOA-PCNN for heart disease prediction is expressed in Figure 1.
3.1. Data Acquisition From the Heart Disease Dataset
3.2. Data Normalization by Min–Max Normalization
3.3. Feature Selection by Chord Distance
3.4. Heart Disease Prediction by the Proposed EFOA-PCNN
Heart disease is finally predicted from the selected features Rχ by the PCNN [13, 14], which is trained by EFOA. Here, EFOA is the hybridization of EWMA [18] with FOA [19].
3.4.1. PCNN Architecture
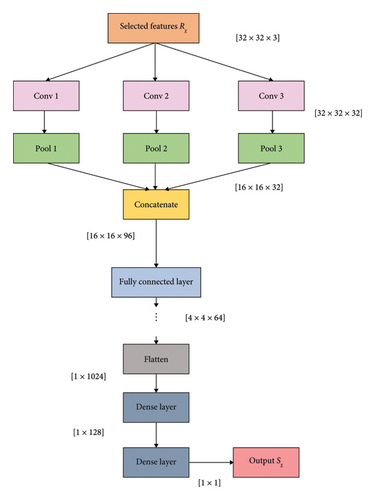
Each fully connected layer has a weight matrix, and all the activations from data are stored in contiguous memory space. Thus, the output from the PCNN is indicated as Sχ. Figure 2 indicates the architecture of the PCNN.
3.4.2. Training of the PCNN by EFOA
The PCNN used for heart disease prediction is trained by EFOA, which is formed by EWMA [18] and FOA [19]. Here, FOA is a population-enabled optimization based on fossa, which is a cat like mammal with intelligent strategies of attack toward observed lemur location and chasing activity with lemur on trees. This optimization tends to converge quickly to better solutions. Also, they are more flexible and robust toward optimization issues. Moreover, EWMA is based on a log of sample variance to monitor the standard deviation process. This helps even in identifying small variations in standard deviation, which is easy for implementation. Thus, the combination of FOA and EWMA forms EFOA, which is highly flexible in detection and is computationally efficient.
3.4.2.1. Step 1: Initialization
3.4.2.2. Step 2: Fitness Function
3.4.2.3. Step 3: Exploration Stage
This is the updated equation for EFOA for training the PCNN.
3.4.2.4. Step 4: Exploitation Stage
3.4.2.5. Step 5: Reevaluation of Fitness
The fitness term is evaluated again for attaining the best solution by equation (11) with various iterations.
3.4.2.6. Step 6: Termination
The procedure of iteration is stopped as the gained solution forms the best solution to resolve the prediction of heart disease. The pseudocode for EFOA is given in Algorithm 1 and is explained below:
-
Algorithm 1: Pseudocode for EFOA.
-
Initialization of parameters: Population size Ρ, Maximum iterations, Search space boundaries, Dimensionality of the problem
-
Population Initialization
-
Fitness evaluation using equation (11)
-
Identify the best solution
-
Stop until attaining the maximum iteration
-
For each fossa in the population
-
Update position using exploration or exploitation mechanisms
-
Check and handle boundary constraints
-
Evaluate the new fitness
-
If the current fitness is minimum than the existing fitness value then update the current position
-
End if
-
End for
-
Return best solution
-
Terminate
Thus, the PCNN trained by EFOA to predict heart disease is simple and accurate. This also exhibited better convergence with faster computation.
4. Results and Discussion
The results for the EFOA-PCNN for heart disease detection are explained in this scenario.
4.1. Experimental Setup
This model is experimented in the Python tool by utilizing a heart disease dataset.
4.2. Dataset Description
The heart disease dataset [15] includes 4 databases, such as Cleveland, Hungary, Switzerland, and VA Long Beach. In this paper, Cleveland and Hungary databases are utilized for data collection. Here, 76 attributes are present, where 14 attributes are included in Cleveland and 13 attributes are included in the Hungary dataset. The attributes involved in this dataset are age, sex, blood pressure, blood sugar, maximal heart rate, and chest pain type. The target variable is categorical.
4.3. Performance Metrics
The metrics used for analysis are accuracy, specificity, sensitivity, and F1 score.
4.3.1. Accuracy
4.3.2. Specificity
4.3.3. Sensitivity
4.3.4. F1 Score
4.4. Comparative Techniques
The proposed EFOA-PCNN is compared with many methods, such as PCA [9], BlCVDD-Net [1], AttGRU-HMSI [7], and EGBLR [10].
4.5. Comparative Analysis
The comparison for the EFOA-PCNN is performed on the basis of two datasets, such as the Cleveland database and the Hungary database, by varying training percentages with various metrics.
4.5.1. Comparative Analysis for the Cleveland Database
4.5.1.1. By Varying Training Data
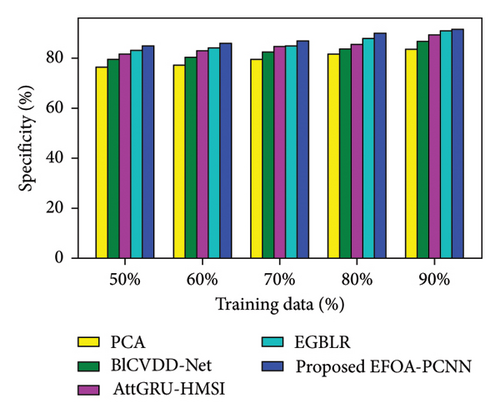
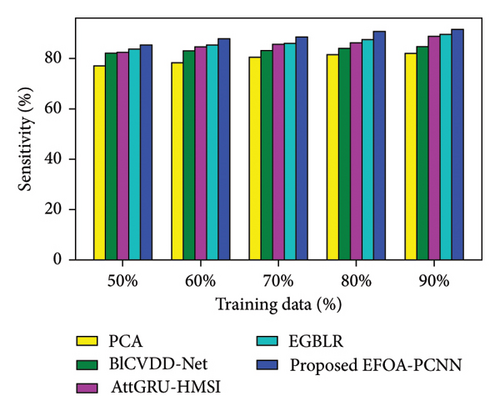
Figure 3 indicates the comparative analysis for the Cleveland database by varying training data. Figure 3(a) enumerates the comparison of the EFOA-PCNN with specificity. When training data are 50%, then specificity is 84.84% for the EFOA-PCNN, whereas other models attained lesser specificities of 76.42%, 79.44%, 81.56%, and 83.07%, with performance enhancement of 9.92%, 6.36%, 3.86%, and 2.09%. Figure 3(b) enumerates a comparison of the EFOA-PCNN with sensitivity. While 60 is the training percentage, then 87.85% is sensitivity attained by the EFOA-PCNN, wherein it is lesser for other models of 78.38%, 82.96%, 84.69%, and 85.45%. Here, performance enhancement is 10.77%, 5.57%, 3.59%, and 2.73%. Figure 3(c) enumerates a comparison of the EFOA-PCNN with accuracy. Accuracy for the EFOA-PCNN is 88.89%, wherein accuracy is 77.97%, 80.57%, 82.66%, and 85.69% for other conventional techniques with a training percentage of 70%. Here, performance improvement is 12.29%, 9.36%, 7.00%, and 3.60%. The F1 score evaluation is shown in Figure 3(d). The F1 score for the EFOA-PCNN is 89.63%, wherein the F1 score is 81.24%, 82.70%, 83.69%, and 85.37% for other conventional techniques, such as PCA, BlCVDD-Net, AttGRU-HMSI, and EGBLR, with a training percentage of 80%.


4.5.1.2. By Varying K-Fold
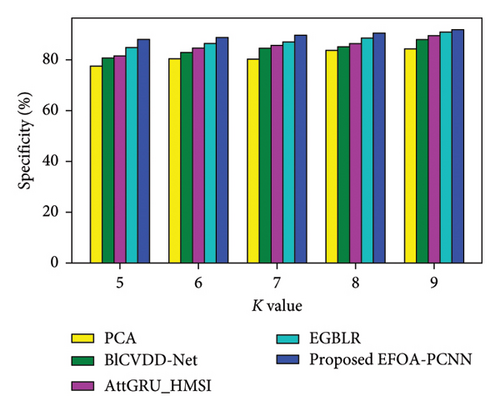
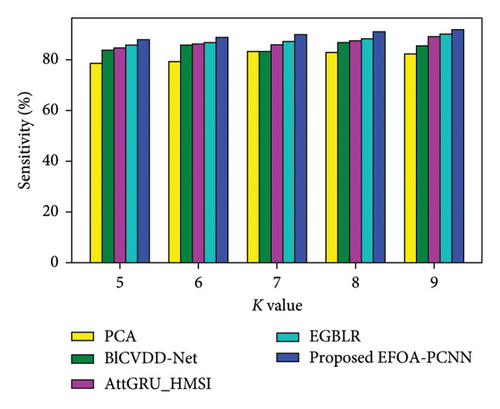
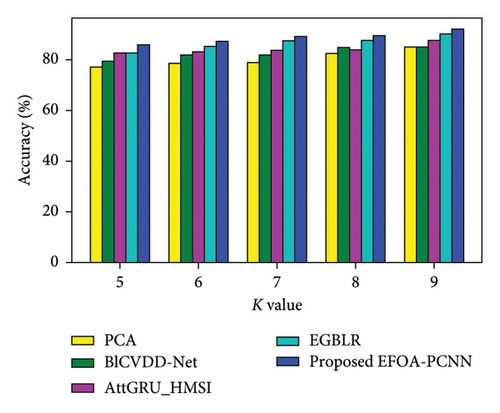
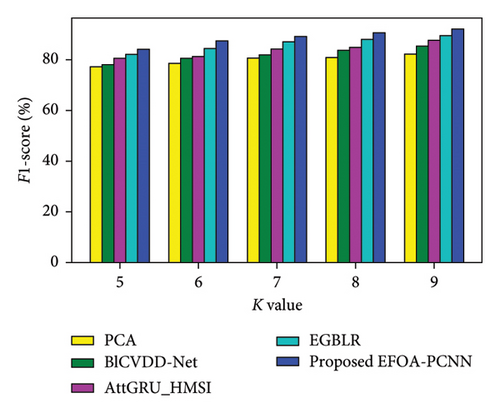
Figure 4 denotes the comparative analysis for the Cleveland database by varying K-Fold. Figure 4(a) enumerates the comparison with specificity. When K-Fold = 6, then specificity is 88.79% for the EFOA-PCNN, whereas PCA, BlCVDD-Net, AttGRU-HMSI, and EGBLR attained specificity of 80.30%, 82.79%, 84.54%, and 86.44%. Figure 4(b) enumerates a comparison with sensitivity. While K-Fold = 7, then 89.92% is sensitivity attained by the EFOA-PCNN, wherein the PCA, BlCVDD-Net, AttGRU-HMSI, and EGBLR models attain the sensitivity of 83.15%, 83.32%, 85.84%, and 87.13%. Figure 4(c) enumerates a comparison with accuracy. Accuracy for the EFOA-PCNN is 89.21%, wherein accuracy of PCA, BlCVDD-Net, AttGRU-HMSI, and EGBLR is 82.16%, 84.29%, 83.57%, and 87.22% with K-Fold = 8. The F1 score evaluation is shown in Figure 4(d). The F1 score for the EFOA-PCNN is 87.58%, wherein the F1 score is 78.54%, 80.52%, 81.32%, and 84.30% for other conventional techniques, such as PCA, BlCVDD-Net, AttGRU-HMSI, and EGBLR with K-Fold = 6.
4.5.2. Comparative Analysis for the Hungary Database
4.5.2.1. By Varying Training Data
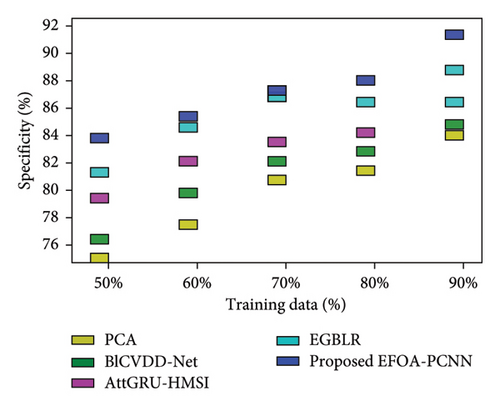
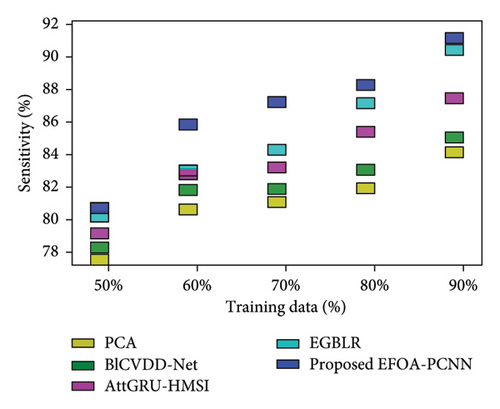
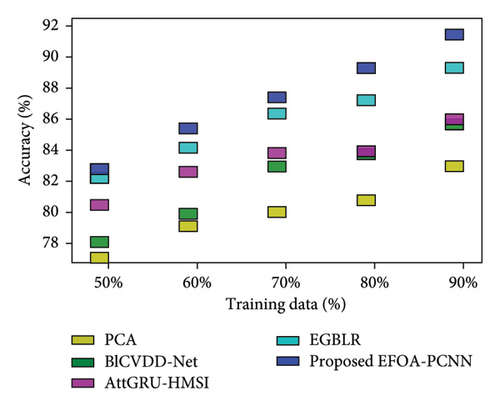
Figure 5 indicates the comparative analysis for the Hungary database by varying training data. Figure 5(a) enumerates the comparison of the EFOA-PCNN with specificity. Specificity for the EFOA-PCNN is 84.99%, wherein specificity is 76.59%, 79.97%, 82.25%, and 83.02% for other conventional techniques with a training percentage of 70. Here, performance improvement is 9.88%, 5.90%, 3.22%, and 2.31%. Figure 5(b) enumerates the comparison of the EFOA-PCNN with respect to sensitivity. When training data are 80%, then sensitivity is 90.59% for the EFOA-PCNN, wherein other models attained lesser sensitivities of 80.33%, 83.18%, 84.45%, and 87.30%, with performance enhancement of 11.33%, 8.18%, 6.77%, and 3.63%. Figure 5(c) enumerates the comparison of the EFOA-PCNN in terms of accuracy. While 90 is the training percentage, then 87.85% is the accuracy attained by the EFOA-PCNN, wherein it is lesser for other methods of 81.97%, 84.67%, 88.88%, and 89.66%. Here, the performance enhancement of the proposed scheme to that of prior models is 10.44%, 7.49%, 2.90%, and 2.04%. Figure 5(d) shows the comparison in terms of the F1 score. While 70% of training data and then 86.55% of the F1 score are attained by the EFOA-PCNN, the F1 scores of the PCA, BlCVDD-Net, AttGRU-HMSI, and EGBLR are 79.59%, 82.29%, 83.69%, and 84.36%.

4.5.2.2. By Varying K-Fold
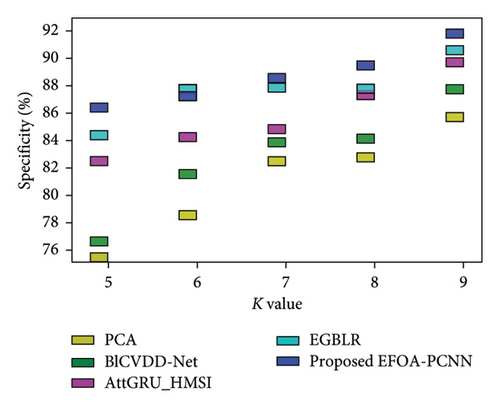
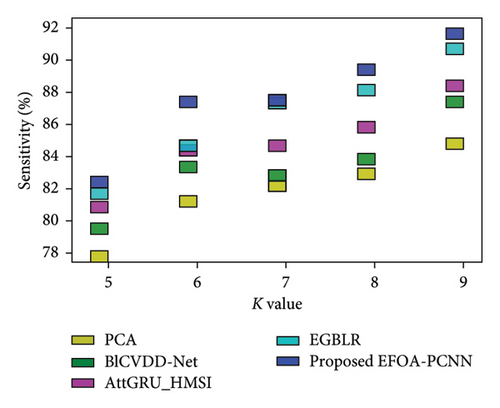
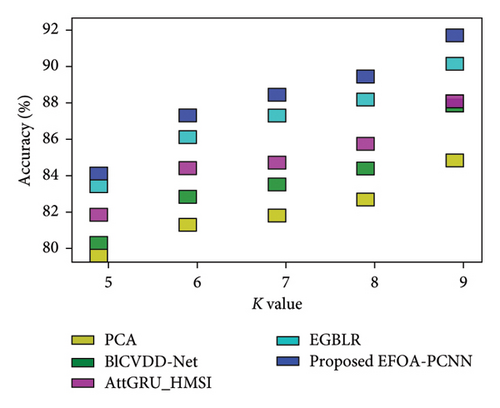
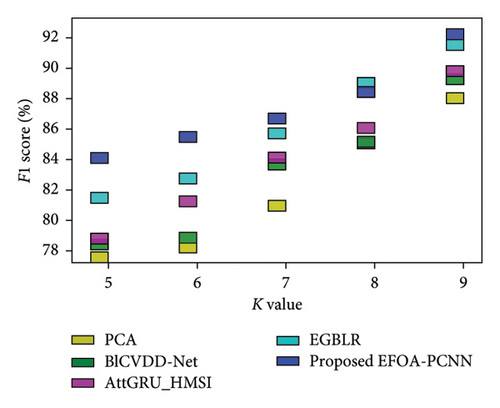
Figure 6 indicates the comparative analysis for the Hungary database by varying K-Fold. Figure 6(a) enumerates the comparison with specificity. Specificity for the EFOA-PCNN is 89.81%, wherein specificity is 82.62%, 84.42%, 84.97%, and 87.43% for PCA, BlCVDD-Net, AttGRU-HMSI, and EGBLR with K-Fold = 7. Figure 6(b) enumerates the comparison with respect to sensitivity. When K-Fold = 6, then sensitivity is 87.56% for the EFOA-PCNN, wherein PCA, BlCVDD-Net, AttGRU-HMSI, and EGBLR attained sensitivity of 79.69%, 83.50%, 82.99%, and 83.99%. Figure 6(c) enumerates the comparison in terms of accuracy. While K-Fold = 6, then 87.99% is the accuracy attained by the EFOA-PCNN, wherein accuracy of PCA, BlCVDD-Net, AttGRU-HMSI, and EGBLR is 80.44%, 82.98%, 83.66%, and 84.53%. Figure 6(d) shows the comparison in terms of the F1 score. While K-Fold = 7, then 89.97% is the F1 score attained by the EFOA-PCNN, and the F1 scores of the PCA, BlCVDD-Net, AttGRU-HMSI, and EGBLR are 78.97%, 81.43%, 84.24%, and 86.21%.
4.6. Comparative Discussion
Table 2 indicates the comparison of the proposed EFOA-PCNN with other models, such as PCA, BlCVDD-Net, AttGRU-HMSI, and EGBLR, with 90% training data and k-fold = 9. The higher performance is obtained at k-fold = 9 using the Hungary database with the values 91.95%, 91.76%, 91.86%, and 92.39% for specificity, sensitivity, accuracy, and F1 score, respectively.
| Variations | Metrics/methods | PCA | BlCVDD-Net | AttGRU-HMSI | EGBLR | Proposed EFOA-PCNN |
|---|---|---|---|---|---|---|
| Based on training data | ||||||
| Cleveland database | Specificity (%) | 83.58 | 86.67 | 89.29 | 90.91 | 91.48 |
| Sensitivity (%) | 81.97 | 84.67 | 88.88 | 89.66 | 91.53 | |
| Accuracy (%) | 81.53 | 83.67 | 85.87 | 89.00 | 91.33 | |
| F1 score (%) | 81.97 | 84.13 | 85.69 | 88.60 | 91.25 | |
| Hungary database | Specificity (%) | 83.95 | 85.56 | 87.43 | 88.17 | 91.50 |
| Sensitivity (%) | 80.85 | 86.00 | 87.39 | 88.43 | 91.31 | |
| Accuracy (%) | 81.97 | 84.67 | 88.88 | 89.66 | 91.53 | |
| F1 score (%) | 83.95 | 85.56 | 87.43 | 88.17 | 91.50 | |
| Based on k-fold | ||||||
| Cleveland database | Specificity (%) | 84.41 | 87.97 | 89.64 | 91.00 | 91.89 |
| Sensitivity (%) | 82.21 | 85.36 | 89.06 | 89.97 | 91.82 | |
| Accuracy (%) | 84.60 | 84.73 | 87.21 | 89.76 | 91.67 | |
| F1 score (%) | 82.22 | 85.41 | 87.79 | 89.54 | 92.15 | |
| Hungary database | Specificity (%) | 86.53 | 87.36 | 88.68 | 89.60 | 91.95 |
| Sensitivity (%) | 82.57 | 87.54 | 87.64 | 89.53 | 91.76 | |
| Accuracy (%) | 84.26 | 87.44 | 88.58 | 89.59 | 91.86 | |
| F1 score (%) | 84.28 | 85.62 | 86.87 | 88.60 | 92.39 | |
- Note: Bold values represent the proposed work results.
5. Conclusion
Heart attack is caused when heart disease progresses unknowingly. This causes a serious risk of death in patients. Hence, timely identification is necessary by the DL model, which is effective and accurate. In this work, the EFOA-PCNN is proposed for earlier heart disease prediction. The heart disease data are acquired initially from the dataset and fed for the process of normalization. Here, input data are normalized to the same range using min–max normalization. Next, the feature selection process is conducted in terms of chord distance. Lastly, prediction of heart disease is performed by the PCNN, where its hyperparameters are tuned using EFOA. Here, FOA and EWMA are combined to generate EFOA. Thus, the EFOA-PCNN is analysed for its performance of heart disease prediction by metrics, such as specificity, sensitivity, accuracy, and F1 score, that attained higher values of 91.95%, 91.76%, 91.86%, and 92.39%. However, this study has some limitations. The proposed model was evaluated only on heart disease data, limiting its generalizability to other medical conditions. Additionally, the tuning process of EFOA could be further refined to enhance performance under varying datasets. Future developments will focus on extending this model to other medical datasets and incorporating advanced optimization techniques for better hyperparameter tuning. Additionally, real-time applications and integration with IoT-based healthcare systems will be explored to facilitate early diagnosis and monitoring in practical scenarios.
Ethics Statement
The authors have nothing to report.
Consent
The authors have nothing to report.
Conflicts of Interest
The authors declare no conflicts of interest.
Author Contributions
Aathilakshmi S.: conceptualization, investigation, data curation, formal analysis, and writing–original draft. Balasubramaniam S.: investigation and data curation. Sivakumar T. A.:writing support. Lakshmi Chetana V.: review and editing.
Funding
This research received no specific grant from any funding agency in the public, commercial or not-for-profit sectors.
Open Research
Data Availability Statement
The data used to support the findings of this study are available from the corresponding author upon reasonable request.


