Spatial Distribution of Microbes in the Apartment Transition Spaces and Exposure Risks Along Resident Flow Paths
Abstract
The microbial contamination levels in the apartment transition spaces, frequently traversed by pedestrians, are closely related to resident health. This study analyzed the microbial distribution in these spaces and modeled and assessed the microbial exposure risk faced by residents following different flow paths. The results showed that the dominant genera of airborne microbes, settling microbes, wall microbes, and ground microbes were Staphylococcus, Bacillus, and Micrococcus, collectively accounting for over 70% of the total microbial population. The concentration of settling microbes in noncorridor spaces was 9.7 times higher than in corridor spaces, necessitating targeted disinfection of settling microbes in noncorridor spaces. The analysis of biodiversity indices elucidates the extent to which the biodiversity of different types of microbes is affected by variations in pedestrian flow, with airborne microbes being the most affected and ground microbes the least affected. This study also constructed a microbial exposure risk assessment model during residents’ mobility in the apartment transitional spaces. Based on this model, it was confirmed that nonfirst-floor residents using the elevator to enter and exit their homes face the highest exposure risk to airborne microbes and wall microbes, while those using the stairwell face the highest exposure risk to settling microbes and ground microbes. First-floor residents face the lowest microbial exposure risk when entering and exiting their homes. The research results not only establish a microbial exposure risk assessment system but also provide important theoretical reference for evaluating and improving the environmental quality of other similar scenarios.
1. Introduction
With the rapid advancement of urbanization and the influx of surrounding populations into cities, apartments have become the cost-effective primary choice for residents. Consequently, the issue of environmental pollution exposure in apartment settings has garnered increasing attention [1–3]. Compared to common physical and chemical pollutants, microbial contamination in apartment environments has a more direct impact on residents’ health [4–6]. Current research primarily focuses on the interiors of apartment residences [7, 8], while studies on the apartment transitional spaces—mandatory passage spaces including the apartment entrance to the elevator room and the corridors on each floor—are relatively scarce. Therefore, understanding the microbial distribution characteristics in the apartment transitional spaces and assessing the exposure risk residents face are vital for controlling microbial contamination levels in public spaces and ensuring residents’ health.
Currently, studies on the characteristics of microbial distribution mainly focus on sensitive medical environments such as intensive care units and operating rooms, providing a theoretical basis for effectively preventing secondary infections in patients and cross-infections between medical staff and patients [9, 10]. To better control the indoor microbial exposure risk, existing research has analyzed the correlation between air conditioning operation and indoor microbial exposure risk [11] and has employed methods such as UVC [12, 13], negative ion generators [14], and low-temperature plasma [15] to reduce indoor microbial contamination levels. Due to the frequent incidents of bacterial and fungal infections in recent years and the outbreak of pandemics such as COVID-19, more research has been conducted on public health in densely populated scenarios [16–18]. Among these scenarios, apartment environments, characterized by relatively high population density and complex compositions, are critical living spaces for residents. Consequently, numerous studies have focused on microbial contamination in apartments, including different apartment buildings [19, 20], different residences within the same building [21–23], and different functional rooms within residences [24, 25]. Additionally, research has identified the sources of microbes within apartment buildings, including outdoor environments and plumbing systems [26–28]. Although current studies have provided a relatively comprehensive understanding of microbial distribution characteristics at various scales within apartments, research on apartment transitional spaces, which serve as transitional spaces from indoors to outdoors, remains relatively scarce.
Additionally, existing research has confirmed that indoor microbial contamination levels are related to ventilation systems [29–31], building materials [32–34], building types [35, 36], and even external environments [37–39]. Factors such as resident activities [40, 41], seasonal changes [42], weather conditions [43], ventilation status [29, 44, 45], particulate matter concentrations [46, 47], temperature and humidity [48, 49], and cleaning habits [50, 51] also impact indoor microbial contamination levels. Studies have shown that humans are a significant source of indoor microbial contamination [52, 53] and that human activity promotes the spread of microbes [54, 55], further establishing a significant causal mechanism between residents and microbes [56]. In the transitional spaces of apartments, which are critical thoroughfares, there is an aggregation of pedestrian flow from different residences. Residents face exposure risks from airborne, settling, and surface microbes. Therefore, it is essential to clarify the microbial distribution characteristics in these transitional spaces and to elucidate the microbial exposure risks faced by residents in these spaces [57, 58]. This understanding is crucial for addressing current research gaps and for improving the environmental quality of apartment transitional spaces.
This study aims to elucidate the microbial distribution characteristics of apartment transitional spaces with pedestrian flow and assess the health risks to residents passing through these spaces. The research objectives include (1) identifying the dominant microbial genera in the apartment transitional spaces and the differences in their distribution across various spaces, (2) determining the changes in microbial diversity caused by variations of pedestrian flow, and (3) constructing a model to assess the microbial exposure risk of residents along different flow paths.
2. Materials and Methods
2.1. Experimental Process
In this study, pedestrian flow counters were installed at various locations to record the number of pedestrians and to identify peak periods of pedestrian flow. Given the broad-spectrum and nutrient-rich properties of TSA (tryptic soy agar), this medium was selected to prepare Petri dishes (Φ90 mm) and contact plates (Φ55 mm) for collecting airborne microbes, settling microbes, and surface microbes in different locations within the apartment transitional spaces. During microbial sampling, this study adhered to the sampling standards for airborne and settling microbes. An Andersen six-stage impact air sampler (FA-1, Soar, China) was used to collect airborne microbes at typical locations within the transitional spaces (each sample was collected for 5 min at a flow rate of 20 L/min, totaling 100 L). Similarly, Petri dishes were used to collect settling microbes at the same locations (collection time was 1 h). For surface microbe sampling, the lid of the contact plate was removed, and the convex surface of the TSA medium was pressed onto the sampling object’s surface for 5–10 s. The collected samples were then incubated in a constant temperature and humidity incubator (LHS-80HC-II, Yiheng, China) at 37°C for 48–72 h until growth reached a stable phase for observation and counting. The composition of the microbial community was analyzed using 16S rRNA gene sequencing (for bacteria) and ITS region sequencing (for fungi), and the microbial distribution characteristics within the transitional spaces were assessed based on counting and sequencing results.
2.2. Field Measurements Plan and Sampling Locations
This study conducted a feasibility investigation of apartment buildings in Northeast and North China. After considering efficient land use, lighting and ventilation conditions, economic cost-effectiveness, and applicability, high-rise corridor-style apartment buildings were chosen as the research subjects. Given that university apartments have a homogeneous resident composition and pedestrian flow constrained by apartment management regulations, university apartments were selected to ensure typical results by eliminating interfering factors. These apartment buildings generally consist of slab-type structures with single or multiple sides. Thus, field measurements were conducted in transitional spaces of a high-rise corridor-style apartment building at a university.
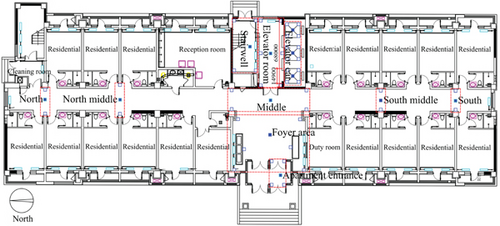
To cover all pedestrian flow as comprehensively as possible, monitoring devices were placed at the elevator lobby exits and the middle of the corridors on both sides to effectively evaluate the pedestrian flow distribution within the apartment building. The results indicated significant peak periods of pedestrian flow in the morning (7:00–9:00), midday (12:00–14:00), and evening (21:00–23:00). During these three peak periods in typical spaces, airborne, settling, and surface microbe samples were collected sequentially, taking the maximum value of the three sampling results to effectively elucidate the highest microbial exposure risk faced by residents in transitional spaces. This approach ensures that transient spikes in microbial concentrations are effectively represented. In comparison, average values, while useful for assessing overall trends, may obscure short-term variations and lead to an underestimation of peak exposure risks. By focusing on maximum values, the analysis provides a more detailed understanding of extreme conditions that could pose significant health risks. The five typical spaces of the apartment transitional spaces include apartment entrance–foyer area (I), 1st-floor corridor (II), 1st-floor elevator room (III), elevator car (IV), stairwell (V: 1st–6th floors, where pedestrian flow accounts for over 90% of total stairwell pedestrian flow), and non-1st-floor elevator room–corridor (VI: 7th floor and 14th floor). For surface microbe sampling, based on resident contact methods, samples were taken from the walls and floor. The wall sampling heights were set according to the hand functional height range (0.634–0.862 m) for 26–35-year-old adult males and females as specified in the “Human dimensions of Chinese adults” (GB/T 10000-2023), with samples taken at 0.6, 0.7, 0.8, and 0.9 m. Floor samples were taken at the junction of the wall, where cleaning is relatively insufficient. In addition, sampling locations on the 7th and 14th floors were consistent with those on the 1st floor except for the absence of the apartment entrance–elevator lobby area. The stairwell sampling location was at the worst location for ventilation. The distribution of sampling locations in the apartment transitional spaces is shown in Figure 1.
2.3. Statistical Analysis
When analyzing the distribution characteristics of microbial contamination in the apartment transitional spaces, detected microbes were classified and counted by genus. The units of airborne, settling, and surface microbes are CFU/m3, CFU/(m2·h), and CFU/25cm2, respectively.
To assess the microbial exposure risk faced by residents during the movement through apartment transition spaces, the process of residents entering and exiting their residences was divided into five stages (A, B, C, D, and E) according to common activity patterns. The flow paths of residents through different spaces were further divided into three routes: No. 1, No. 2, and No. 3. Based on monitoring the distribution patterns of pedestrian flow, the range of stop times in each area was calculated, as shown in Table 1.
| A | B | C | D | E | |
|---|---|---|---|---|---|
| No. 1 | Apartment entrance–foyer area (7–10 s) | 1st-floor corridor (6–15 s) | — | — | — |
| No. 2 | 1st-floor elevator room (12–43 s) | Elevator car (10–183 s) | Non-1st-floor elevator room (4–7 s) | Non-1st-floor corridor (5–17 s) | |
| No. 3 | Stairwell (21–227 s) |
| Area name | Area (m2) | Maximum pedestrian flow (persons/min) |
|---|---|---|
| Apartment entrance–foyer area | 61.4 | 16 |
| 1st-floor corridor | 459.7 | 8 |
| 1st-floor elevator room | 15.6 | 14 |
| Elevator car | 2.2 | 11 |
| Stairwell | 13.3 | 7 |
| Non-1st-floor elevator room | 15.6 | 2 |
| Non-1st-floor corridor | 459.7 | 4 |
3. Results
Microbes of the same genus typically exhibit high genetic correlation, similar morphological characteristics, physiological and metabolic capabilities, and similar ecological niches and disease associations, leading to relatively consistent distribution in indoor environments [62, 63].
3.1. Distribution Characteristics of Airborne and Settling Microbes in the Apartment Transitional Spaces
3.1.1. Distribution of Airborne Microbes in the Apartment Transitional Spaces
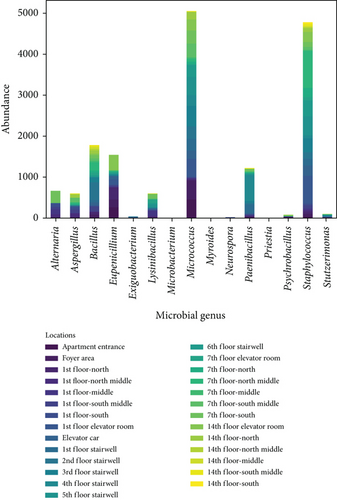
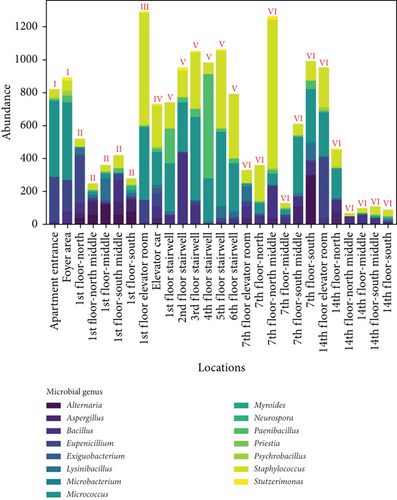
To clarify the distribution characteristics of airborne microbes in the apartment transitional spaces, stacked bar charts were plotted based on the genera of airborne microbes and sampling locations, as shown in Figure 2. Figure 2a shows the genus distribution of airborne microbes in the apartment transitional spaces, indicating that Staphylococcus, Micrococcus, and Bacillus are dominant genera, with average concentrations of 4720, 4590, and 1720 CFU/m3, respectively, accounting for 70.3% of all collected airborne microbe. Figure 2b shows the distribution of airborne microbes at different spaces (I–VI) in the apartment transitional spaces. Specifically, the average concentrations at the apartment entrance–foyer area (I), 1st-floor corridor (II), 1st-floor elevator room (III), elevator car (IV), stairwell (V: 1st–6th floors, where pedestrian flow accounts for over 90% of total stair pedestrian flow), and non-1st-floor elevator room–corridor (VI: 7th floor and 14th floor) were 855, 366, 1290, 730, 928, and 455 CFU/m3, respectively. The highest concentration of airborne microbes was observed in the 1st-floor elevator room, attributed to the high number of residents stopping there and poor ventilation. Additionally, the 1st-floor corridor, due to the presence of the reception room, handled a portion of the pedestrian flow for the entire apartment building, while other floors only managed the flow of their respective residents, resulting in significant differences in pedestrian flow. However, the 1st floor had relatively low airborne microbe concentrations due to good ventilation and timely maintenance. For the non-1st-floor spaces, the 7th-floor corridor and 14th-floor corridor had consistent maintenance frequencies, but their airborne microbes’ concentrations differed significantly due to floor differences and resident habits. The airborne microbes’ concentrations in the non-1st-floor elevator room–corridor on the 7th floor and 14th floor were 613 and 297 CFU/m3, respectively. Despite consistent maintenance frequencies, the difference in concentrations was not due to changes in open space height (which is unrelated to microbial concentration) but rather due to resident behavior.
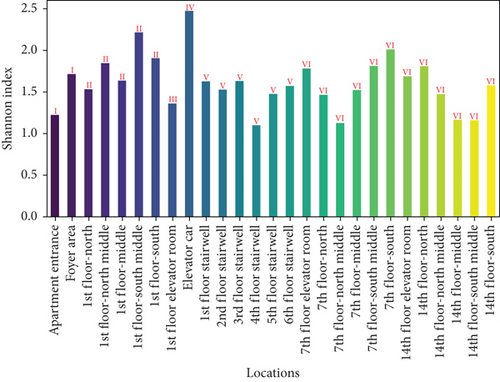
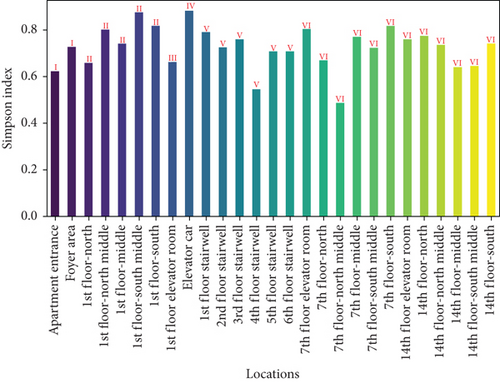
To further assess the biodiversity indices of airborne microbes in the apartment transition spaces, the Shannon index (representing species richness and evenness) and the Simpson index (representing dominance) were calculated for different locations. The results are shown in Figure 3. The figure indicates that both the Shannon and Simpson indices reached their maximum values in the elevator car (2.47 and 0.88, respectively). The standard deviations of the Shannon and Simpson indices in the apartment transition space, including and excluding the elevator car, differed by 105% and 60%, respectively.
3.1.2. Distribution of Settling Microbes in the Apartment Transitional Spaces
Figure 4 shows the distribution of settling microbes by genus and sampling locations. Figure 4a shows the genus distribution of settling microbes in transitional spaces, indicating that Staphylococcus, Bacillus, and Micrococcus are the dominant genera (consistent with the dominant genera of airborne microbe), with total average concentrations of 74,036; 42,441; and 29,866 CFU/(m2·h), respectively, accounting for 81.7% of all collected settling microbes. Figure 4b shows the distribution of settling microbes in different locations of the apartment transitional spaces. Among different spaces, the average concentrations for the apartment entrance–foyer area (I), 1st-floor corridor (II), 1st-floor elevator room (III), elevator car (IV), and stairwell (V) were 15,169; 1855; 21,849; 15,247; 12,418; and 2318 CFU/(m2·h), respectively, with the highest concentration still found in the 1st-floor elevator room. The reasons for this phenomenon have been relatively comprehensively discussed in the analysis of airborne microbes’ distribution. Additionally, judging from the characteristics of whether residents gather, the average concentration of settling microbes in noncorridor spaces (apartment entrance–foyer area, 1st-floor elevator room, elevator car, and stairwell) is 9.7 times higher than in corridor spaces, much greater than the difference in airborne microbes between noncorridor and corridor spaces (1.4 times). This indicates the necessity of controlling airborne microbes’ and settling microbes’ pollution in noncorridor spaces of apartment transitional spaces. Effective disinfection in these spaces will be an important approach to improving the environmental quality of apartment transitional spaces, thereby ensuring the health of residents passing through these spaces. Additionally, the intensity of disinfection for settling microbes should be strategically adjusted compared to airborne microbes to adapt to the significant fluctuations in settling microbes’ concentrations in different spaces.
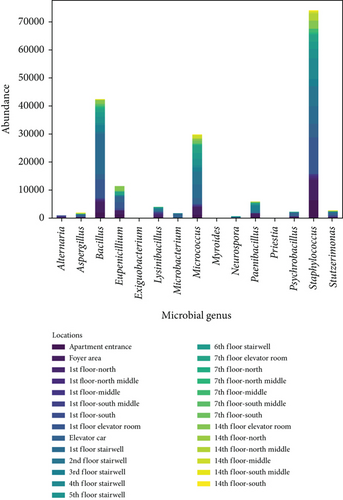
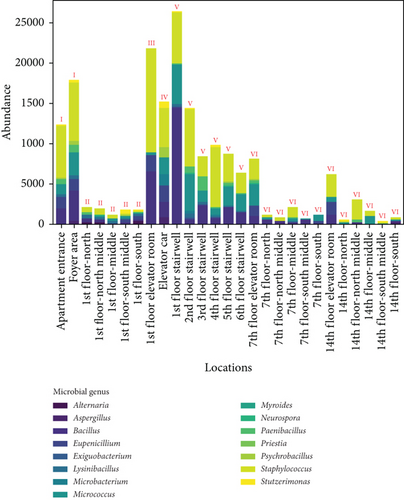
Figure 5 presents the Shannon and Simpson indices for settling microbes across different locations in the apartment transition spaces. The figure indicates that both the Shannon and Simpson indices also reached their maximum values in the elevator car (2.72 and 0.92, respectively). The standard deviations of the Shannon and Simpson indices in the apartment transition spaces, including and excluding the elevator car, differed by 41% and 38%, respectively.

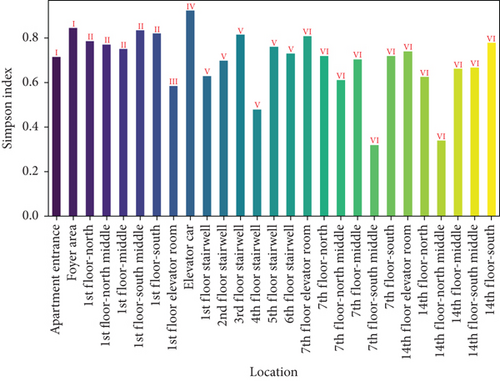
Both the Shannon and Simpson indices for airborne and settling microbes reached their maximum values in the elevator car due to the high pedestrian flow in this location, resulting in a greater variety and quantity of microbes carried by residents. Comparing the standard deviation analysis results of Figures 3 and 5 for spaces including and excluding the elevator car, it can be concluded that, except for the elevator car (an enclosed space), the differences in richness, evenness, and dominance of airborne and settling microbes in other spaces are not significant due to variations of pedestrian flow. The differences in the standard deviations of the Shannon and Simpson indices for settling microbes are much smaller than those for airborne microbes (41% and 38% compared to 105% and 60%), indicating that the distribution of airborne microbes is more susceptible to variations of pedestrian flow.
3.2. Distribution Characteristics of Surface Microbes in the Apartment Transitional Spaces
3.2.1. Distribution Characteristics of Wall Microbes in the Apartment Transitional Spaces
Figure 6 shows the distribution of wall microbes by genus and sampling locations. Figure 6a shows the distribution of microbial genera on the wall surfaces in the apartment transitional spaces, indicating that Staphylococcus, Micrococcus, and Bacillus are the dominant genera. The average concentrations across all locations were 481, 458, and 371 CFU/25 cm2, respectively, accounting for 83.3% of all collected surface microbes. Figure 6b shows the wall microbe distribution across different spaces (I–VI) in the transitional spaces, with the apartment entrance–foyer area (I), 1st-floor corridor (II), 1st-floor elevator room (III), elevator car (IV), stairwell (V: 1st–6th floors, with pedestrian flow on the first six floors accounting for over 90% of total stairwell pedestrian flow), and non-1st-floor elevator room–corridor (VI: 7th floor and 14th floor) having average concentrations of 55, 15, 153, 97, 59, and 66 CFU/25 cm2, respectively. The highest wall microbe concentrations were found in the 1st-floor elevator room and the elevator car, likely due to the high pedestrian flow in these spaces.
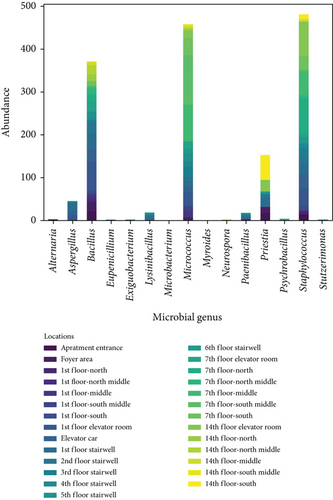
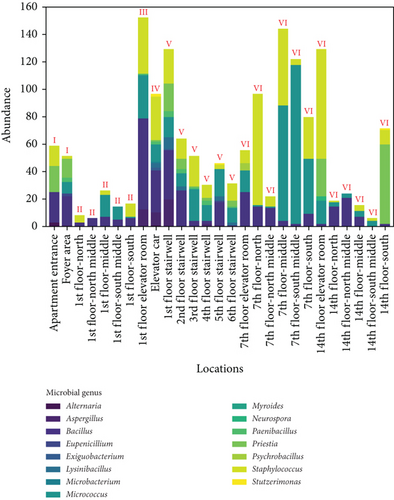
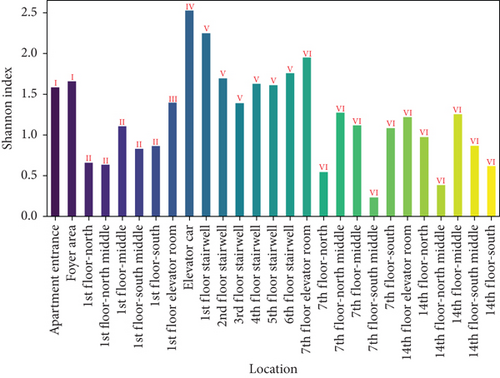
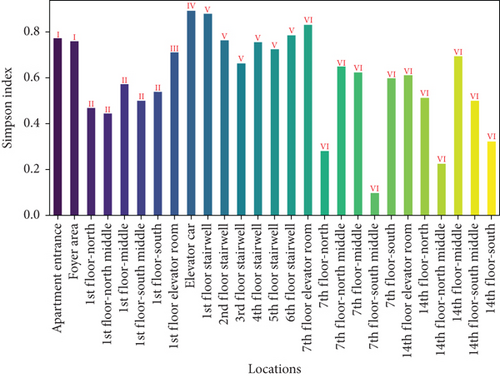
Figure 7 presents the Shannon and Simpson indices for wall microbes across different locations in the apartment transition spaces. The figure indicates that both the Shannon and Simpson indices reached their maximum values in the elevator car (2.52 and 0.89, respectively). The standard deviations of the Shannon and Simpson indices in the apartment transition space, including and excluding the elevator car, differed by 52% and 15%, respectively.
3.2.2. Distribution Characteristics of Ground Microbes in the Apartment Transitional Spaces
Figure 8 shows the distribution of ground microbes by genus and sampling location. Figure 8a shows the genus distribution of ground microbes in transitional spaces, indicating that Staphylococcus, Bacillus, and Micrococcus are the dominant genera (consistent with the dominant genera on walls). The total average concentrations at all locations were 549, 407, and 238 CFU/25 cm2, respectively, accounting for 90.4% of all collected ground microbes. Figure 8b shows the distribution of settling microbes in different locations of the transitional spaces, including the apartment entrance–foyer area (I), 1st-floor corridor (II), 1st-floor elevator room (III), elevator car (IV), stairwell (V), and non-1st-floor elevator room–corridor (VI). The average concentrations in these spaces were 137, 28, 39, 40, 25, and 57 CFU/25 cm2, respectively, with the highest ground microbe concentration found in the apartment entrance–foyer area. This area functions as the main gathering and dispersing point for residents, indicating that locations with the highest pedestrian flow face the highest ground microbe exposure risk.
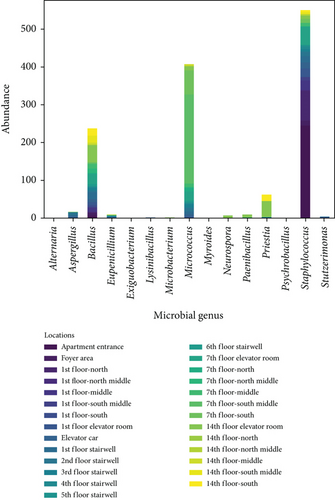
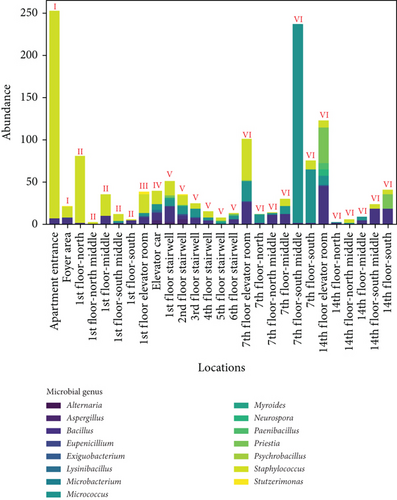
The average values of ground microbes in noncorridor spaces (apartment entrance–foyer area, 1st-floor elevator room, elevator car, and stairwell) were 0.5 times higher than in corridor spaces, which is much smaller than the difference in wall microbes between noncorridor and corridor spaces (1.0 times). This fluctuation is much smaller than the fluctuations in airborne and settling microbes (9.7 times and 1.4 times), indicating that pollution control of wall and ground microbes in the noncorridor spaces of the apartment transition spaces is necessary. Effective disinfection in these spaces is essential, but the intensity of disinfection for surface microbes, especially given their lower fluctuation, may not need adjustment.
Figure 9 presents the Shannon and Simpson indices for ground microbes across different locations in the apartment transition spaces. The figure indicates that both the Shannon and Simpson indices reached their maximum values in the elevator car (2.62 and 0.92, respectively). The standard deviations of the Shannon and Simpson indices in the apartment transition space, including and excluding the elevator car, differed by 38% and 10%, respectively.
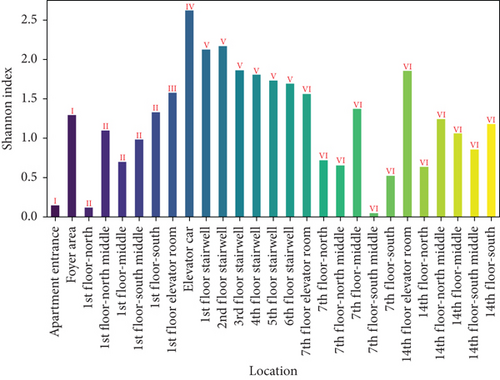
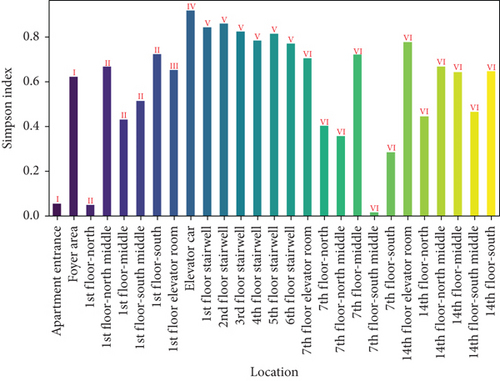
The Shannon and Simpson indices for wall and ground microbes also reached their maximum values in the elevator car due to the high pedestrian flow in this location. Comparing the standard deviation analysis results of Figures 7 and 9 for spaces including and excluding the elevator car, it can be concluded that, except for the elevator car (an enclosed space), the differences in richness, evenness, and dominance of wall and ground microbes in other spaces are not significant due to variations in pedestrian flow. The differences in the standard deviations of the Shannon and Simpson indices for ground microbes are smaller than those for wall microbes (38% and 10% compared to 52% and 15%), indicating that the distribution of wall microbes is more susceptible to variations in pedestrian flow.
From the changes in standard deviations of the Shannon and Simpson indices for airborne microbes, settling microbes, wall microbes, and ground microbes in spaces including and excluding the elevator car, it can be concluded that based on the calculation results of the Shannon index, the degree of impact from variations in pedestrian flow, from highest to lowest, is airborne microbes > wall microbes > settling microbes > ground microbes and, based on the calculation results of the Simpson index, the degree of impact from variations in pedestrian flow, from highest to lowest, is airborne microbes > settling microbes > wall microbes > ground microbes. Overall, airborne microbes are most affected by variations in pedestrian flow, while ground microbes are least affected.
3.3. The Microbial Exposure Risk Assessment Model During Residents’ Mobility in the Apartment Transitional Spaces
In this study, existing literature revealed that the BSLs of the collected microbes range between BSL-1 and BSL-2, with some microbial safety levels being disputed. For ease of calculation, this study assigns microbial exposure risk levels as follows: BSL-1 = 1, BSL-2 = 2, and disputed levels as 1.5. The value of ki is assigned as , and Li is assigned according to the BSL level of the microbe. is uniformly assigned as 0.5. In the Chinese standard GB 37488-2019, “Hygiene indicators and limits for public places,” it is stipulated that the total bacterial count in indoor air in public places should not exceed 1500 CFU/m3, and the total colony count on object surfaces in public places should not exceed 300 CFU/25 cm2. For ease of calculation, these values were divided by the number of microbial genera, 15, and then halved to derive the midpoint values. Consequently, in the risk assessment of airborne and settling microbes, Ni0 is uniformly assigned a value of 50, and in the risk assessment of surface microbes, Ni0 is uniformly assigned a value of 10.
Considering that the mechanisms of action of airborne microbes, settling microbes, wall microbes, and ground microbes on resident health are related to residents’ behavioral habits, in the evaluation of microbial exposure risk in the apartment transition spaces, Ni0 should represent the concentrations of airborne microbes, settling microbes, wall microbes, and ground microbes at different locations. Based on the above reasonable assumptions, the exposure risk of microbes (airborne microbes, settling microbes, wall microbes, and ground microbes) in the apartment transition spaces in this study was calculated, and a stacked bar chart was plotted, as shown in Figure 10.
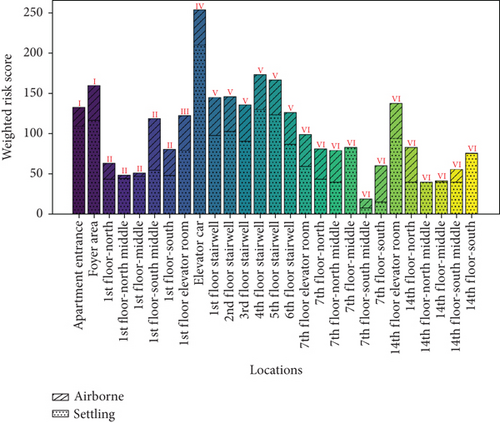
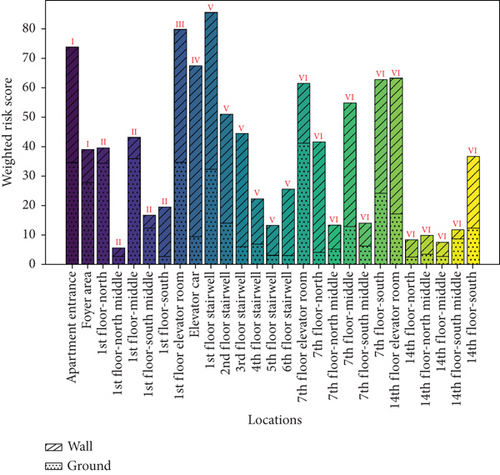
The microbial exposure risks caused by airborne and settling microbes are shown in Figure 10a,b. The figures indicate that the average score for airborne microbes (29.71) is significantly lower than that for settling microbes (70.66), and the average score for ground microbes (14.97) is significantly lower than that for wall microbes (22.58). However, due to the inconsistency in units, these values have limited comparability, and the scores for the four types of microbes need to be discussed separately. The maximum exposure risks for airborne and settling microbes were observed in the 1st-floor-south middle and elevator car, respectively, which do not correspond to the locations with the highest concentrations of airborne and settling microbes (both in the 1st-floor elevator room). The maximum exposure risks for wall and ground microbes were observed in the elevator car and 7th-floor elevator room, respectively, which do not correspond to the locations with the highest concentrations of these microbes (non-1st-floor elevator room–corridor and apartment entrance–foyer area, respectively). These discrepancies are due to the nonlinear amplification effect and saturation effect of different BSLs.
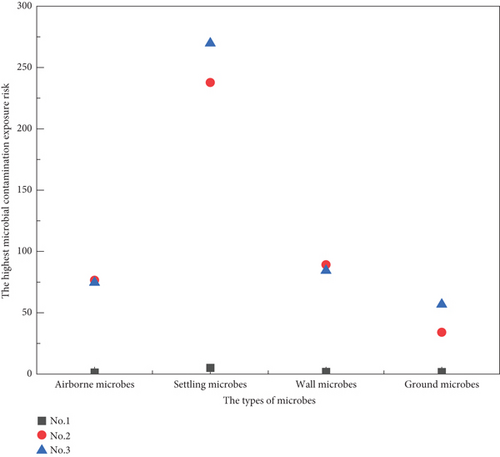
The highest microbial exposure risks faced by residents in the No. 1, No. 2, and No. 3 paths were calculated according to Equation (4), with the results shown in Figure 11. It can be seen that residents on non-1st floors taking the elevator in and out of the building (No. 2) face the highest exposure risks to airborne microbes and wall microbes (76.5 and 89.2, respectively), residents on non-1st floors taking the stairs in and out of the building (No. 3) face the highest exposure risk to settling microbes and ground microbes (269.8 and 56.8, respectively), and residents on the 1st floor face the lowest exposure risks to all types of microbes (1.3, 5.1, 1.8, and 1.7, respectively).
4. Discussions
4.1. Distribution Patterns of Microbial in the Apartment Transitional Spaces
The research results show that for airborne microbes, settling microbes, wall microbes, and ground microbes, the dominant genera are Staphylococcus, Bacillus, and Micrococcus, accounting for more than 70%. This phenomenon is primarily attributed to the widespread presence of these genera on human skin, respiratory tracts, and other mucosal surfaces. They are introduced into indoor environments in large quantities through human activities such as shedding, breathing, and contact. Furthermore, these microbes have strong environmental adaptability, enabling them to survive stably under relatively dry and ventilated conditions. The frequent human traffic leads to the continuous accumulation of these common microbes, thus dominating the detection results. This indicates that studies on controlling microbial exposure risks in the apartment transition spaces should focus on these three genera to achieve effective disinfection for most microbes. Effective disinfection measures (e.g., photocatalysis, UVC, and antibacterial materials) are key to improving the environmental quality of these spaces and ensuring the health of residents [64–66]. The results also show that the concentration difference of settling microbes between noncorridor and corridor spaces is as high as 9.7 times. Therefore, how to reasonably adjust disinfection intensity to adapt to the significant concentration differences of ground settling microbes in different spaces is an important direction for future research on microbial contamination control.
As for the outdoor microbial characteristics, this study conducted sampling at the apartment entrance, which represents the boundary between indoor and outdoor environments. However, due to the variability of outdoor environments, we did not perform detailed sampling of outdoor microbes. Future research will focus on further sampling both indoor and outdoor environments and clarifying the relationship and differences in microbial sources between the two, which will contribute to large-scale microbial contamination control.
4.2. Discussion on the Microbial Exposure Risk Assessment Model During Residents’ Mobility in the Apartment Transitional Spaces
In the microbial exposure risk assessment model during residents’ mobility in the apartment transitional spaces proposed in this study, multiple variables based on the characteristics of different microbial genera are involved. In this study, the determination of GX in the calculation of infection probability involves factors such as population characteristics, behavioral habits, and cleaning frequency. Previous research has also confirmed the association between human characteristics in built environments and surface microbes [67, 68]. However, it is worth noting that attention to surface microbes is necessary due to the varying contact frequencies of surface microbes among residents of different age groups. Children are more active and less knowledgeable about hygiene, with a higher probability of contacting floors and walls, while adults have a relatively lower probability. In future studies, the weaker immunity of children will be an important driving force for disinfection of surface microbes.
In this assessment model, the study uses the maximum values at different detection locations as the basic data for microbial exposure risk assessment results in relevant spaces and the maximum values of microbial exposure risk assessment results in each area as the evaluation standard. However, the sampling locations of these samples vary, and some locations may be rarely visited by some residents. For example, residents living near the first floor-north are unlikely to be active in the first floor-south. From this perspective, the microbial exposure risk assessment results may be overestimated. However, considering the characteristics of microbial transmission and the possibility of crossinfection among residents after infection, using higher microbial exposure risk assessment results as the evaluation standard is beneficial for environmental protection.
Moreover, this risk assessment model can be adapted to other environments with similar conditions, such as schools, hospitals, or office buildings, where high human traffic and close contact among individuals lead to similar microbial contamination risks. The flexibility of this model makes it a valuable tool for improving environmental quality across a wide range of public or semipublic spaces.
4.3. Conversion of Airborne and Settling Microbes in the Apartment Transitional Spaces
Existing standards (e.g., GB/T16293-2010 Test Method for Airborne Microbes in Clean Room (Zone) of the Pharmaceutical Industry and GB/T16294-2010 Test Method for Settling Microbes in Clean Room (Zone) of the Pharmaceutical Industry) do not explain the interconversion between airborne microbes, settling microbes, wall microbes, and ground microbes. In addition to being affected by temperature, humidity, and wind speed, the distribution of microbes is also related to the behavior and characteristics of resident activities, where characteristics such as stride length, body weight, and the contact area with the ground may be important factors affecting the conversion efficiency between different types of microbes [69–71]. Once this issue is resolved, a comprehensive assessment of microbial exposure risks for airborne microbes, settling microbes, wall microbes, and ground microbes can be achieved.
4.4. Limitations of this Study
In this study, microbial sampling was conducted under natural ventilation conditions (observed wind speed < 1.80 m/s) to closely mimic the actual environmental state of residents’ daily lives. However, the lack of strict control over ventilation and building characteristic variables may affect the accuracy of microbial distribution and exposure risk assessment. For instance, the stack effect caused by outside air (temperature difference, pressure difference, external wind speed, etc.) may alter microbial diffusion patterns through thermal convection and airflow. Under low wind speed conditions, settling microbes may remain suspended in the air for longer, while high wind speeds could enhance the resuspension of particles and microbes. Therefore, future studies should conduct comparative experiments by precisely controlling experimental conditions (e.g., temperature, pressure, and wind speed) and developing quantitative models to comprehensively analyze the impact of environmental variables on microbial distribution. This approach will improve the understanding of microbial distribution patterns in transitional spaces and further optimize microbial exposure risk assessment models during resident movement. Enhanced accuracy in reflecting risk characteristics under varying environmental variables will provide a scientific basis for improving environmental quality in transitional spaces.
Furthermore, environmental factors such as temperature, humidity, and illuminance may significantly influence microbial distribution patterns and concentrations. For instance, variations in temperature and humidity can directly regulate microbial viability and reproduction rates, while illuminance may indirectly affect microbial distribution by altering airflow patterns or microbial photosensitivity. However, due to the limitations of the experimental design, this study did not systematically quantify the specific effects of these environmental factors on microbial distribution. In future research, real-time monitoring of key environmental parameters (e.g., temperature, humidity, and illuminance) combined with multivariate statistical models could be employed to quantitatively assess the relationship between environmental factors and microbial concentrations. This approach could help to comprehensively reveal the dynamic characteristics of microbial contamination, not only supporting the optimization of microbial management strategies in transitional spaces but also enhancing the applicability of microbial exposure risk assessment models. For example, these models could be adapted to different scenarios or used to characterize microbial contamination fluctuations through environmental parameters within the same scenario.
5. Conclusions
This study conducted empirical experiments on a typical high-rise corridor-style apartment building to elucidate the distribution characteristics and biodiversity indices of airborne microbes, settling microbes, wall microbes, and ground microbes in the transition spaces of the apartment. The findings revealed that the dominant genera of airborne microbes, settling microbes, wall microbes, and ground microbes were Staphylococcus, Bacillus, and Micrococcus, collectively accounting for over 70% of the total microbial population. Research on controlling microbial exposure risks in the apartment transition spaces should focus on these three genera to achieve effective disinfection of most microbes. Effective disinfection measures (e.g., photocatalysis, UVC, and antibacterial materials) will be key to improving the environmental quality of these spaces and ensuring the health of residents. Additionally, the study found that the average concentration of settling microbes in noncorridor spaces was 9.7 times higher than in corridor spaces, far exceeding the difference in airborne microbes between noncorridor and corridor spaces (1.4 times). Given the significant differences in the concentrations of settling microbes across various spaces, it is essential to implement targeted strategic adjustments in disinfection intensity. This indicates the necessity of controlling settling microbe pollution in noncorridor spaces of apartment transition spaces. Strategic adjustments in disinfection intensity are needed to address the significant differences in settling microbe concentrations across different spaces. Based on the calculation results of the Shannon and Simpson indices, this study also elucidated the extent to which the biodiversity of different types of microbes is affected by variations in pedestrian flow. The comprehensive calculation results of these indices clarified that airborne microbes are most affected by variations in pedestrian flow, while ground microbes are least affected.
This study constructed a microbial exposure risk assessment model for a specific area in the apartment transition spaces based on the nonlinear amplification effects and saturation effects of different BSLs. Additionally, a microbial exposure risk assessment model during residents’ mobility in the apartment transitional spaces was proposed based on the movement characteristics of residents, clarifying the microbial exposure risks faced by residents along different flow paths. The findings of this study provide valuable insights and references for assessing and improving microbial exposure risks in similar environments, such as schools, hospitals, and office buildings, as well as other public or semipublic spaces.
Conflicts of Interest
The authors declare no conflicts of interest.
Funding
This work was supported by the National Key Research and Development Program of China (Grant No. 2022YFC3803200), the National Natural Science Foundation of China (Grant No. 52370194), and the Fundamental Research Funds for the Central Universities (Grant No. DUT23YG115).
Open Research
Data Availability Statement
The data presented in this study are available on request from the corresponding author.


