The Impact of Indoor Total Volatile Organic Compound Exposures on Cognitive Performance in a Controlled Chamber Environment: An Experimental Study
Abstract
Indoor levels of total volatile organic compounds (TVOCs) can influence students’ learning and productivity by affecting cognitive performance. To investigate whether TVOC affects cognitive performance in schools, especially in newly constructed or renovated buildings within the first 3 months, a single-blind experiment was conducted in a climate chamber. Then, 33 university students were exposed to three moderate TVOC concentrations: below 100, 1000, and 2000 μg/m3, all emitted by solvent-based paint. Ventilation (30 m3/h), temperature (22°C), relative humidity (50%), lighting, and noise levels were maintained at constant values for all exposure conditions. Cognitive performance was measured through reaction speed and accuracy using a computer-based test battery that included 10 randomized tasks; all participants completed the test three times. Participants’ perceptions of the environment were investigated through pretest and posttest questionnaires. The results indicate no statistically significant differences in reaction speed or accuracy were observed between exposure to medium–low (1000) and low (100 μg/m3) TVOC levels. Exposure to a medium–high level of TVOC (2000 μg/m3) significantly reduced task accuracy by 4.9% compared to the low level (100 μg/m3). No statistically significant effect on reaction speed was observed. Participants’ perceptions of air quality were rated significantly worse at both the 1000 and 2000 μg/m3 TVOC exposure levels compared to the low level. Overall, no significant differences in cognitive performance were observed between the medium–low and low TVOC exposure levels. Both accuracy in memory tasks and well-being were negatively affected when comparing the medium–high level to the low level of TVOC. These findings highlight the critical need for monitoring and controlling TVOC levels during the early stages of construction and renovation to improve indoor air quality. Future studies could investigate a broader range of VOC sources and incorporate additional strategy-based cognitive tasks.
1. Introduction
Higher education students spend a large amount of their time learning indoors. The quality of the indoor environment (IEQ) has a significant impact on both learning and teaching performance [1, 2]. When numerous students occupy a classroom or educational space, ensuring proper ventilation can become challenging, resulting in higher levels of indoor air pollutants [3]. Poor IEQ affects teachers and students, negatively impacting teaching effectiveness and students’ academic performance [2]. Ensuring good IEQ is essential for optimizing the performance and productivity of both students and teachers [4, 5].
Volatile organic compounds (VOCs) are common air pollutants that negatively impact indoor air quality. These compounds are released by building materials, occupants, and various equipment within a building, potentially leading to indoor air quality issues in different areas [6]. Formaldehyde and aromatic compounds are particularly concerning as they pose higher health risks [7]. Walls and ceilings make up approximately 60% of the total indoor space and are frequently painted [8]. While drying, paints release a considerable amount of VOCs. Total volatile organic compounds (TVOCs) refer to the combined concentrations of both identified and unidentified VOCs. TVOC is a valuable tool for assessing indoor air quality [9–11]. Building regulations in the United Kingdom recommend a maximum average of 300 μg/m3 as exposure limit over 8 h [12]. According to the European Standard EN 16798-1, a TVOC level below 1000 μg/m3 is classified as a “low polluted building” [13]. In practical situations, people may be exposed to moderate TVOC levels of up to 2000 μg/m3, which typically occurs in newly constructed or renovated spaces during the first 3 months after completion [14–18] and could also occur in classrooms with inadequate ventilation [19, 20]. For instance, Hori et al. [19] found that TVOC concentrations at a Japanese university were typically below the national standard of 400 μg/m3 during the day. However, these levels increased to over 2000 μg/m3 in the evening when ventilation was turned off. Kumar et al. [20] reported a TVOC range of 465.8 (145.3–1503.2 μg/m3) in winter and 321.8 (90.7–1,100.9 μg/m3) at a university library in New Delhi. TVOC level exceeding 2000 μg/m3 are uncommon in human occupied buildings.
Research on the impact of VOCs on cognitive performance has been ongoing, but definitive conclusions remain elusive. Early studies typically manipulated TVOC levels to be significantly high (up to 50000 μg/m3), which are not representative of conditions experienced in everyday building use. Many of these studies employed a consistent methodology, injecting a mixture of selected VOCs into environmental chambers. Mølhave, et al. [21] reported a decrease in memory function for digits at TVOC concentrations of 5000 and 25,000 μg/m3. However, subsequent studies failed to replicate these results, with no observed impairment in cognitive performance at 25,000 μg/m3 in any cognitive tests [22–24]. Health-related impacts across most studies were similar, indicating symptoms such as irritation of the eyes, nose, and throat, as well as an increased prevalence of headaches. In early studies, questionnaires served as the primary method for data collection, supplemented by a limited number of paper-based cognitive test batteries [21, 22, 24–26]. With the advent of the computer, numerous studies began to incorporate computer-based cognitive assessments [27–29]. The choice of cognitive test may significantly affect the outcomes. For example, in a study by Fiedler et al. [27], participants were exposed to a TVOC level of 26,000 μg/m3. Despite this elevated exposure, no significant alterations were noted in the results of the divided attention test. This particular test, originally created by Mills et al. [30] to evaluate the effects of alcohol and drugs, may not be suitable for measuring the cognitive impact of TVOC.
In recent years, there has been a limited number of studies focused specifically on VOC exposures. Indoor VOC studies can be broadly categorized into two distinct groups. The first category encompasses the monitoring of VOCs in actual indoor environments [31–35]. For instance, an office study by Allen et al. [34] found significant declines in strategy, information usage, crisis response, and focused activity at TVOC levels ranging from 500 to 700 μg/m3. Conversely, Nakaoka et al. [32] reported no significant performance differences detected at TVOC levels between 314 and 1674 μg/m3 in newly constructed laboratory houses. The second category employs commercially available building materials within controlled climate chambers [36–41]. Some research indicates that exposure to latex paint could lead to significant decreases in productivity [38]; exposure to atomized essential oils may result in increased impulsivity [40]. However, other studies have found no substantial cognitive impact, despite observing changes in brain activity [41–43]. The duration of exposure also varies across studies; field studies commonly assess exposure over an entire working day, while most laboratory experiments tend to last several hours. Although growing evidence suggests a link between VOC exposure and health symptoms, findings related to cognitive performance remain inconclusive [44, 45]. Additionally, utilizing building materials as a source often presents challenges in precisely controlling the TVOC concentrations.
Although existing research shows mixed cognitive impacts from VOC exposure, significant gaps remain. Early studies focusing on high concentrations yielded contradictory results, and onsite observational studies reveal inconsistent correlations between moderate TVOC levels and cognitive changes. Additionally, controlled experiments examining VOCs derived from building materials at educationally relevant concentrations are scarce, and methodological differences in sources, durations, and cognitive assessments complicate comparisons. The inconclusive results of earlier research underscore the necessity of standardized investigations that simulate onsite exposure scenarios. This study is aimed at exploring the potential effects of moderate TVOC levels on students’ cognitive performance within an educational environment. The hypothesis posits that cognitive performance will be significantly decreased at higher TVOC concentrations compared to lower concentrations. The findings will contribute to understanding the TVOC impacts on cognitive performance in educational facilities, especially in structures shortly after construction and renovation.
2. Methods and Material
2.1. Monitoring of Physical Environment
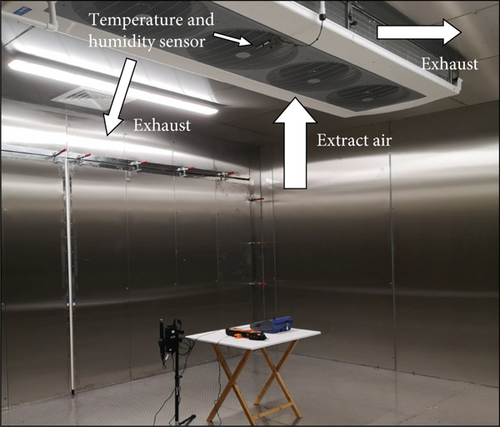
In this study, a repeated-measures experimental approach was implemented. Subjects were exposed in an environmental chamber to three different levels of TVOC, while maintaining constant physical environmental parameters throughout the exposure. The stainless steel chamber measured 4.4 m in width, 4.3 m in depth, and 3 m in height and was manufactured and installed by the JTS company. Inner air circulation was facilitated by four electronically commutated (EC) fans. Typical indoor environmental parameters, such as temperature, relative humidity, ventilation rates, and lighting intensity, were regulated using a Watlow F4T Programmable Controller. The air supply was derived from outdoor sources and filtered through a H13 HEPA multiwedge filter.
Cognitive performance is also influenced by other IEQ parameters, including indoor temperature [46, 47], noise levels [48–50], lighting [51], and ventilation [52, 53]. Thus, it is critical to control these variables in experimental conditions. In the study, ventilation, temperature, humidity, lighting intensity, and noise levels were maintained at consistent levels to eliminate any confounding influences on the primary independent variables being examined. Specifically, the ventilation rate was kept at 30 m3/h, corresponding to 8.3 L/s/person; the temperature was set to 22°C; relative humidity (RH) was maintained at 50%; the illuminance level was fixed at 660 lux; and noise levels were regulated by providing participants with noise-cancelling headphones featuring a 20 dB noise reduction rating. Details of the equipment used for monitoring the physical environment are provided in Supporting Information (available here).
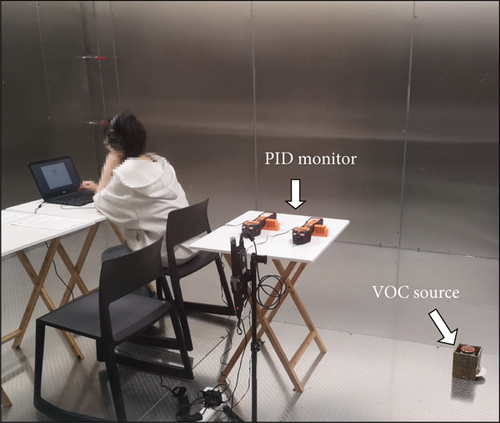
In terms of VOC measurement, gas chromatography-mass spectrometry (GC-MS) is widely recognized as the “gold standard” [54]. The GC-MS method allows for precise identification and quantification of individual compounds through the thermal desorption of samples collected in sorbent tubes, and it has been employed in numerous studies [19, 45, 55–58]. Although GC-MS offers high accuracy, it requires off-site analysis, which can be both time-consuming and costly [54]. As a practical alternative for real-time monitoring, photoionization detectors (PIDs) measure total VOC concentrations via light ionization, providing a precise, portable, and cost-effective detection method. PIDs have been utilized for real-time monitoring of total VOC levels in various studies [59, 60]. In this study, both VOC measurement methods were applied. To specify VOC concentrations under each condition, indoor air was sampled using Tenax TA sorbent tubes with a GilAir Plus sampling pump. The active air flow was 20 mL/min for 1 h, with two samples collected for each condition. The sorbent tubes were subsequently capped and sent to the HSE Science and Research Centre for analysis using the GC-MS system (instrument model: Perkin Elmer 680 GC equipped with a Perkin Elmer 600S MS). During analysis, absorbed VOCs are thermally desorbed at 320°C with helium flow, concentrated in the GC, and then ionized and detected in the MS. Additionally, Tiger PID gas detectors (manufactured by Ion Science Ltd, United Kingdom) were placed in the chamber to enable real-time monitoring and to trigger alarms if VOC concentrations exceeded preset points.
2.2. Assessing Cognitive Performance and Perception
Before collection of cognitive performance and survey data, research ethics approvals were obtained from the university (see the Ethics Statement section). This study utilized the computer-based testing system Behavioural Assessment and Research System (BARS) to assess cognitive performance [61]. The test is appropriate for different age groups (4–91 years) and language background groups. BARS has been utilized in many studies for assessing cognitive function under different conditions of chemical exposure [62–65]. Then, 10 tasks were used in this study to evaluate participants’ cognitive performance including attention, memory, motivation, response speed and coordination, and complex cognitive functions; details can be found in Table 1. The original 9BUTTON Response units were unavailable in the UK/EU due to testing requirements. Therefore, a standard laptop keyboard was used as the input device in this study. During each task, the software recorded response speed from the appearance of the prompt to receiving the button response, correct key, and the input key. The average response speed (millisecond) was derived by dividing the total response time by the total number of key presses, indicating the duration between stimulus display and response. The error rate (percentage) was calculated by dividing the total number of errors by the total number of key presses. The primary outputs for each cognitive task were the response speed (millisecond) and the error rate (percentage).
| Task | Symbol | Function measured |
|---|---|---|
| Continuous performance | CPT | Attention |
| Digit span | DST | Attention, number memory |
| Match to sample | MTS | Visual memory, delay |
| Progressive ratio | PRT | Motivation |
| Reversal learning | RLT | Working memory, learning |
| Selective attention test | SAT | Attention |
| Serial digit learning | SDL | Learning, memory |
| Simple reaction time | SRT | Response speed |
| Symbol digit | SDT | Complex function |
| Tapping | TAP | Response speed, coordination |
- Note: For further description of each task, see https://www.nweta.com/bars/tests/.
To gather participants’ perception of thermal sensation, air quality, lighting, and noise level during the experimental session, each participant was required to complete two paper-based questionnaires. The first questionnaire was completed after 20 min of exposure to the condition, with evaluations rated on a 7-point Likert scale. Participants were also asked to report their current condition such as food intake, caffeine intake, and exercise, as these factors could potentially confound their test performance [66–69]. Following the cognitive performance assessment, participants completed a post-assessment questionnaire in the chamber at approximately 60 min. This questionnaire posed the same questions as those in the 20-min survey. Participants also shared information about any physical symptoms experienced during exposure, such as headaches, dizziness, and irritation, which have been noted in previous studies [16, 21, 28, 33]. Copies of sample questionnaires are available in the Supporting Information.
2.3. Exposure Conditions
This study employed a 1 × 3 within-subject, single blind design. In three conditions, TVOC concentrations were set as 0–300 μg/m3 (low level), 1000 ± 200 μg/m3 (medium–low level) and 2000 ± 200 μg/m3 (medium–high level). At the baseline level (low level), no additional VOC source was introduced. The medium–low level was selected based on its classification under the “low polluted building” category in EN 16798-1. The medium–high level was chosen as the upper limit representing potential real-world exposure levels for students. A commercially available solvent-based paint (odorless at 2000 μg/m3, simulating realistic indoor environments with stable emission rates) was applied as the VOC source. TVOC levels were generated using a paint container, as illustrated in Figure 1. The container consisted of a jar and lids with varying opening diameters, which controlled the VOC release rate. TVOC concentrations remained stable for 1.5 h, with an accuracy of ± 300 μg/m3. Before the formal experiment, a pilot study was conducted to determine the material and verify this method to ensure repeatability.

Table 2 lists the 10 VOCs with detectable concentrations. Across all conditions, n-decane, o/m/p-xylene, and n-nonane were the three most abundant compounds, with higher concentrations than the others. o/m/p-Xylene exhibited elevated levels in all three conditions, consistent with its well-documented prevalence in indoor environments and its identification as a major VOC pollutant in urban school classrooms [70]. Although n-decane and n-nonane were among the most frequently detected compounds in this study, they are typically not associated with high-risk exposures [71]. The remaining compounds also pose relatively low toxicity risks [72–74].
| Parameter | Low level (baseline level) | Medium–low level | Medium–high level |
|---|---|---|---|
| n-Decane ∗∗ | 8.3 | 220 | 330 |
| o/m/p-Xylene | 44 | 220 | 305 |
| n-Nonane | 5.5 | 195 | 280 |
| Methylnonane isomer# | 2.2 | 81.5 | 121.5 |
| C3-alkylcyclohexane isomer† | 1.7 | 78.5 | 117.5 |
| Trimethylcyclohexane isomer ∗ | < LOD ∗∗∗ | 73 | 105 |
| n-Undecane | 3.6 | 44 | 68 |
| 2-Pentanone | < LOD | 28.5 | 35.5 |
| Acetophenone | 3.7 | 5.9 | 7.75 |
| Phenylacetaldehyde | < LOD | < LOD | < LOD |
- ∗Possibly 1,3,5-trimethylcyclohexane.
- †Possibly propyl cyclohexane.
- #Possibly 3-methylnonane
- ∗∗Numbers given in bold in the table have been quantified using known response factors, while the others use the toluene response factor.
- ∗∗∗LOD: limits of detection.
2.4. Experimental Procedure
G ∗Power was applied to assess the power of the study [75]. Previous VOC studies indicated the effect size was medium to high [34, 40]. Considering that this study involved acute exposure, an effect size of 0.4 was estimated for the sample size calculation. By inputting the test family as F test, α error probability as 0.05, statistical power as 0.95, correction among repeated measures as 0.5, and nonsphericity correction as 0.5, the sample size was estimated to be 30. The study comprised 33 participants, most of whom were postgraduate students (66.7%), Chinese speakers (84.8%), and 91% were in the age group 20–28 years (Table 3). All participants were nonsmokers, were not taking any prescribed medications at the time of the study, and had no learning disorders such as ADHD (attention deficit hyperactivity disorder). Participants were required to refrain from using any strong-smelling products (e.g., perfume) for at least 12 h prior to the experiment.
| Category | Values | |
|---|---|---|
| n | % | |
| Gender | ||
| Male | 11 | 33.3 |
| Female | 22 | 66.7 |
| Education background | ||
| Bachelor | 2 | 6.1 |
| Postgraduate | 22 | 66.7 |
| PhD | 9 | 27.3 |
| First language | ||
| Chinese | 28 | 84.8 |
| Other | 5 | 15.2 |
| BMI categories | ||
| BMI < 18.5 | 6 | 18.2 |
| 18.5 ≤ BMI < 25 | 18 | 54.5 |
| BMI ≥ 25 | 6 | 18.2 |
| Missing/unknown ∗ | 3 | 9.1 |
| Other categories | Mean | SD |
| Clo ∗∗ | 0.8 | 0.3 |
| Age | 25 | 4 |
- ∗Excluded from the analysis of confounders.
- ∗∗Based on participants’ description of their clothing in the questionnaire, the value can be calculated by the PMV-model from ASHRAE Standard 55-2017.
Participants were exposed to three different conditions on separate days, with a 3-week interval between sessions to reduce potential learning effects from the cognitive test batteries [29, 37]. Before each experiment, participants could choose from five available time slots (9:00–10:30, 11:00–12:30, 13:00–14:30, 15:00–16:30, and 17:00–18:30), which were offered throughout the week. The conditions and cognitive tasks were randomized using a Latin Square design to minimize order effects. As shown in Figure 2, the experimental procedure began with a 20-min introductory session to allow participants to acclimate to the chamber environment. At the 20-min mark, participants completed a 5-min pre-experiment assessment, followed by a 35–40 min cognitive test session. After completing the tests, participants were given 5 min to fill out a post-self-assessment questionnaire. The experiment setup (illustrated in Figure 3) tested one person at a time [76].

2.5. Data Analysis
Descriptive analysis was conducted to provide an initial overview of the experiment. For cognitive results, any values three standard deviations above or below the mean were considered outliers and removed from subsequent analysis. Regarding the data obtained from the BARS tasks, multivariable multilevel linear regression models were applied to compare the cognitive impacts across TVOC levels. Firstly, in a univariable multilevel linear regression analysis, TVOC levels served as independent variables and task results as dependent variables, with the low level designated as the reference category. Subsequently, each potential confounder from the questionnaire data was assessed in a separate univariable multilevel linear regression model as an independent variable, with BARS results (total of 20) as the dependent variable. Confounding factors showing significant effects across multiple tasks were considered for adjustment in the final multivariable regression model. This approach has been applied in several other BARS-based studies [62, 63, 77]. Limiting confounders helps avoid potential overfitting problems [78, 79]. In addition, participants’ perceptions of temperature, air quality, lighting quality, and noise level were analyzed using a 2 (20 vs.60 min) × 3 (TVOC level) two-way ANOVA, followed by post hoc tests. Tukey’s honestly significant difference (HSD) test was applied to minimize Type I errors. An univariable multilevel logistic regression model was applied to investigate the association between each symptom and TVOC level. The analysis was performed in RStudio (Version 4.3.3), with p value < 0.05 considered statistically significant.
3. Results
3.1. Measured Environmental Parameters in Each Condition
Table 4 indicates that the physical environment was maintained at the target level consistently across all conditions, with minimal fluctuations. The distribution of each parameter was normal. During each testing session, CO2 levels increased over time due to participants’ breathing. The maximum values recorded at the end of each session were approximately 928 ppm, remaining below 1000 ppm where little cognitive impact had been reported in previous studies [80, 81]. In low-level conditions, the chamber’s inner walls, furniture, and equipment were potential VOC sources. However, as the chamber and furniture were not brand new and had been pre-exposed to 28°C prior to the formal experiment, the chamber’s VOCs were likely insignificant and consistent across all conditions.
| Condition | TVOC (μg/m3) | Temperature (°C) | Relative humidity (%) | Ventilation rate (m3/h) | CO2 (ppm) |
|---|---|---|---|---|---|
| Low level, mean (SD) | 81 (57) | 22 (0.2) | 50 (0.4) | 31 (7) | 637 (81) |
| Medium–low level, mean (SD) | 1036 (121) | 22 (0.9) | 50 (0.3) | 29 (5) | 663 (88) |
| Medium–high level, mean (SD) | 2002 (118) | 22 (1) | 50 (0.5) | 31 (7) | 681 (109) |
3.2. BARS Cognitive Test Results
Figure 4 illustrates the average reaction times during the cognitive tasks. In eight out of 10 tasks, reaction speed was generally higher at elevated TVOC levels. According to the univariable regression model, only the CPT task demonstrated a significant difference between low levels, 333 (45 ms), and medium–high levels, 385 (72 ms), p = 0.003. Compared to the low level, the average reaction speed for the CPT increased by 23 ms (7%) when exposed to the medium–low level, and by 52 ms (16%) when exposed to the medium–high level (as detailed in Supporting Information). In summary, the CPT task was the only task to show a significant effect on reaction speed, with the observed differences being relatively minor. Therefore, based on the univariable model, it cannot be concluded that acute exposure to medium–low or medium–high TVOC levels has a significant effect on reaction speed.
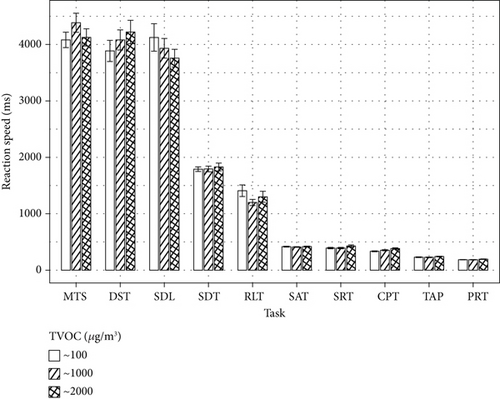
Figure 5 displays the mean error rates (%) for each cognitive task. Eight out of 10 tasks showed a numerical increase from low to higher TVOC levels. The error rates for the DST and SAT tasks increased slightly at the medium–low TVOC level, while a higher increase was observed at the medium–high level. Errors were not analyzed for the PRT task, as it focused on measuring keystroke speed, where participants were required to press a single button as many times as possible within a specified timeframe.
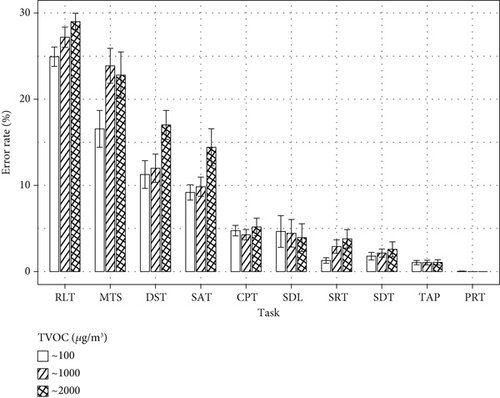
Univariable regression models (Supporting Information) indicated significant effects in the following five tasks: MTS, RLT, SAT, SRT, and DST. Across these tasks, the average error rate was 2.7% higher at the medium–low level compared to the low level and 4.9% higher at the medium–high level than at the low level. However, only the MTS task showed a significant difference between the medium–low and low levels. This suggests that the impact of acute exposure to medium–low TVOC levels is inconsistent. Therefore, acute TVOC exposure affects accuracy performance, but the effect is only evident at medium–high TVOC levels. The proposed hypothesis can only be partially accepted in terms of accuracy.
Then, 32 potential confounders were assessed using univariable regression models. BMI, test duration, first language, and the number of participations exhibited significant effects in more than five tasks (see Supporting Information). BMI showed a significant effect on five out of 20 tasks, with students classified as underweight demonstrating slightly better reaction speed and accuracy than those classified as normal weight. Students with longer test durations displayed both lower reaction speed and accuracy, which was significant in 13 out of 20 tasks. Additionally, native Chinese-speaking students showed superior cognitive performance in numerical tasks compared to those who spoke other languages, with a significant effect noted in seven out of 20 tasks. There was a practice effect in six out of 20 tasks, with slightly better cognitive performance observed during the third testing session. Gender was not considered a confounder since it only had significant effects in two out of 20 tasks.
The results of both the unadjusted and adjusted outcomes are presented in Table 5. Acute exposure to VOCs demonstrated a stronger impact on accuracy performance compared to reaction speed. In the multivariable model, after adjusting for additional confounders, significant effects were observed for the TAP task, β − coeff. = 22.44, 95% CI (6.06, 38.81); CPT task, β − coeff. = 45.6, 95% CI (11.33, 79.86); and PRT task, β − coeff. = 13.94, 95% CI (1.35, 26.53). Although there was a significant increase in response time at medium–high levels, the effect of VOCs on reaction speed remains inconclusive due to the absence of significant associations in the other seven tasks. Regarding accuracy (see Table 5), the MTS, RLT, SAT, and SRT tasks showed significant effects both before and after model adjustments, with a noticeable increasing trend in task error rates. The DST task exhibited significant effects in the unadjusted model, but no further effects were observed after adjustments (refer to Supporting Information). Complete adjusted multivariable regression tables, including selected confounders, are available in Supporting Information.
| TVOC level | Response time of BARS tasks | Error rate of BARS tasks | ||||||
|---|---|---|---|---|---|---|---|---|
| Univariable model | Multivariable model ∗ | Univariable model | Multivariable model ∗ | |||||
| β-Coeff. (95% CI) | p value | Adj. β-Coeff. (95% CI) | p value | β-Coeff. (95% CI) | p value | Adj. β-Coeff. (95% CI) | p value | |
| TAP | ||||||||
| C1 | Ref. | Ref. | Ref. | Ref. | ||||
| C2 | −1.52 (−17.69, 14.66) | 0.9 | 3.96 (−12.46, 20.37) | 0.6 | 0.2 (−0.62, 1.02) | 0.6 | 0.02 (−0.87, 0.92) | 1.0 |
| C3 | 13.98 (−2.19, 30.16) | 0.1 | 22.44 (6.06, 38.81) | 0.01 | 0.17 (−0.65, 0.98) | 0.7 | −0.06 (−0.96, 0.84) | 0.9 |
| MTS | ||||||||
| C1 | Ref. | Ref. | Ref. | Ref. | ||||
| C2 | 303.36 (−120.52, 727.25) | 0.2 | 346.74 (−116.84, 810.33) | 0.1 | 8.39 (2.09, 14.68) | 0.01 | 7.2 (0.14, 14.27) | 0.05 |
| C3 | 43.61 (−380.28, 467.49) | 0.8 | 169.32 (−298, 636.65) | 0.5 | 6.67 (0.32, 13.01) | 0.04 | 4.31 (−2.91, 11.52) | 0.2 |
| RLT | ||||||||
| C1 | Ref. | Ref. | Ref. | Ref. | ||||
| C2 | −206.44 (−445.76, 32.88) | 0.1 | −255.21 (−528.3, 17.88) | 0.1 | 2.48 (−0.51, 5.47) | 0.1 | 3.05 (0.09, 6.01) | 0.05 |
| C3 | −96.36 (−333.83, 141.11) | 0.4 | −209.44 (−484.73, 65.84) | 0.1 | 4.01 (1, 7.02) | 0.01 | 2.77 (−0.24, 5.77) | 0.08 |
| CPT | ||||||||
| C1 | Ref. | Ref. | Ref. | Ref. | ||||
| C2 | 22.75 (−5.83, 51.32) | 0.1 | 21.27 (−12.05, 54.6) | 0.2 | −0.43 (−2.48, 1.62) | 0.68 | −0.58 (−2.34, 1.19) | 0.5 |
| C3 | 51.88 (23.08, 80.67) | 0.001 | 45.6 (11.33, 79.86) | 0.01 | 0.35 (−1.69, 2.4) | 0.74 | −1.01 (−2.76, 0.75) | 0.3 |
| SAT | ||||||||
| C1 | Ref. | Ref. | Ref. | Ref. | ||||
| C2 | −4.61 (−26.2, 16.97) | 0.7 | −4.56 (−27.9, 18.78) | 0.7 | 1.44 (−3.16, 6.03) | 0.5 | 0.65 (−4.02, 5.31) | 0.8 |
| C3 | 1.58 (−19.84, 22.99) | 0.9 | −4.39 (−27.74, 18.96) | 0.7 | 6.17 (1.62, 10.73) | 0.01 | 4.82 (0.17, 9.47) | 0.05 |
| SDL | ||||||||
| C1 | Ref. | Ref. | Ref. | Ref. | ||||
| C2 | −191.94 (−732.81, 348.93) | 0.5 | −202.25 (−761.44, 356.95) | 0.5 | −0.9 (−5.69, 3.88) | 0.71 | 0.68 (−4.43, 5.79) | 0.8 |
| C3 | −366.91 (−907.78, 173.96) | 0.2 | −215 (−778.7, 348.7) | 0.5 | −0.46 (−5.24, 4.33) | 0.85 | 0.48 (−4.66, 5.61) | 0.9 |
| SRT | ||||||||
| C1 | Ref. | Ref. | Ref. | Ref. | ||||
| C2 | 2.19 (−37.09, 41.48) | 0.9 | 15.5 (−31.02, 62.03) | 0.5 | 1.48 (−0.61, 3.57) | 0.17 | 2.34 (0.27, 4.42) | 0.03 |
| C3 | 36.08 (−3.53, 75.68) | 0.08 | 42.34 (−4.52, 89.2) | 0.08 | 2.59 (0.48, 4.7) | 0.02 | 2.58 (0.48, 4.69) | 0.02 |
| SDT | ||||||||
| C1 | Ref. | Ref. | Ref. | Ref. | ||||
| C2 | 15.03 (−151.49, 181.55) | 0.9 | 34.43 (−141.58, 210.44) | 0.7 | 0.27 (−1.41, 1.95) | 0.8 | 0.8 (−0.94, 2.54) | 0.4 |
| C3 | −9.91 (−176.42, 156.61) | 0.9 | −59.34 (−235.35, 116.68) | 0.5 | 0.68 (−1, 2.36) | 0.4 | 0.78 (−0.99, 2.56) | 0.4 |
| DST | ||||||||
| C1 | Ref. | Ref. | Ref. | Ref. | ||||
| C2 | 195.24 (−335.84, 726.32) | 0.5 | 393.22 (−108.3, 894.75) | 0.1 | 0.03 (−4.61, 4.67) | 1.0 | −0.06 (−4.8, 4.68) | 1.0 |
| C3 | 335 (−196.08, 866.08) | 0.2 | 285.49 (−220.07, 791.06) | 0.3 | 5.06 (0.42, 9.7) | 0.04 | 3.33 (−1.48, 8.14) | 0.2 |
| PRT | ||||||||
| C1 | Ref. | Ref. | Ref. | Ref. | ||||
| C2 | 1.72 (−9.38, 12.82) | 0.8 | 4.87 (−7.75, 17.49) | 0.5 | 0 (−0.01, 0) | 0.2 | −0.01 (−0.02, 0) | 0.1 |
| C3 | 10.81 (−0.29, 21.91) | 0.06 | 13.94 (1.35, 26.53) | 0.03 | 0 (−0.01, 0) | 0.2 | −0.01 (−0.02, 0) | 0.2 |
- Note: C1, low TVOC level; C2, medium–low level; C3, medium–high level.
- ∗Model adjusted for BMI (underweight/health weight), first language, cognitive test duration, and participation times.
3.3. Questionnaire Results of Participants’ Perceptions of the Environmental Conditions
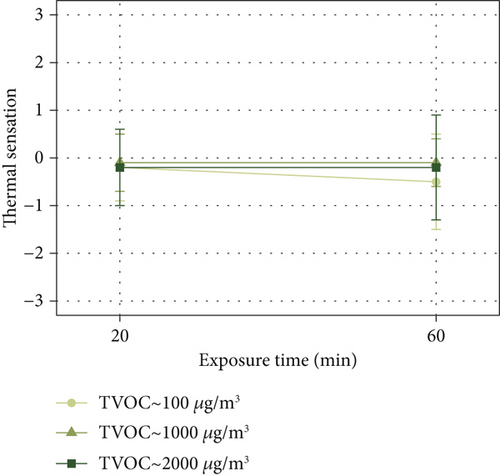
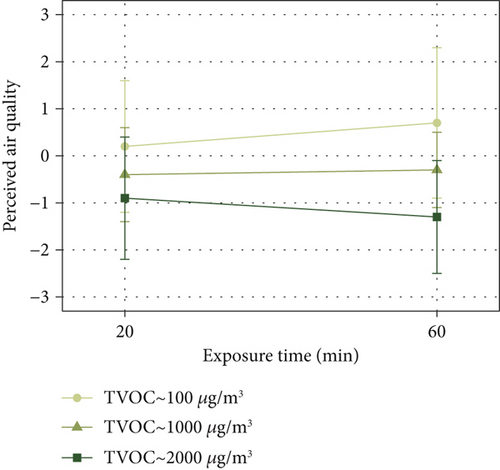
ANOVA was conducted to assess differences in perceptions of thermal sensation, air quality, lighting quality, and noise level. No significant main effects were found regarding thermal sensation across all conditions (Table 6). For perceived air quality, there was a significant main effect of TVOC level and a significant interaction effect between TVOC level and time. Results showed that participants perceived air quality as worse at higher TVOC levels, particularly with prolonged exposure (Figure 6b).
| Perception | ANOVA p value |
Pairwise comparison | |||
|---|---|---|---|---|---|
| Contrast | Exposure time | Mean diff. (SE) | p | ||
| Thermal sensation | |||||
| TVOC level | 0.3 | Na | Na | Na | Na |
| Time | 0.5 | Na | Na | Na | Na |
| Interaction | 0.3 | Na | Na | Na | Na |
| Air quality | |||||
| TVOC level | < 0.001 | C2-C1 | At 20 min | −0.58 (0.29) | 0.2 |
| C3-C1 | At 20 min | −1.12 (0.37) | 0.02 | ||
| Time | 0.6 | C3-C2 | At 20 min | −0.55 (0.25) | 0.1 |
| C2-C1 | At 60 min | −1.06 (0.33) | 0.01 | ||
| Interaction | 0.01 | C3-C1 | At 60 min | −2.03 (0.37) | < 0.001 |
| C3-C2 | At 60 min | −0.97 (0.26) | 0.002 | ||
| Lighting quality | |||||
| TVOC level | 0.3 | Na | Na | Na | Na |
| Time | 0.01 | Na | Na | Na | Na |
| Interaction | 0.9 | Na | Na | Na | Na |
| Noise level | |||||
| TVOC level | 0.1 | Na | Na | Na | Na |
| Time | < 0.001 | Na | Na | Na | Na |
| Interaction | 0.6 | Na | Na | Na | Na |
- Note: C1, low TVOC level; C2, medium–low level; C3, medium–high level.
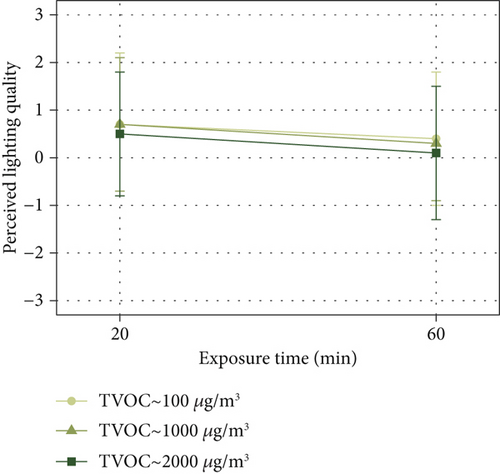
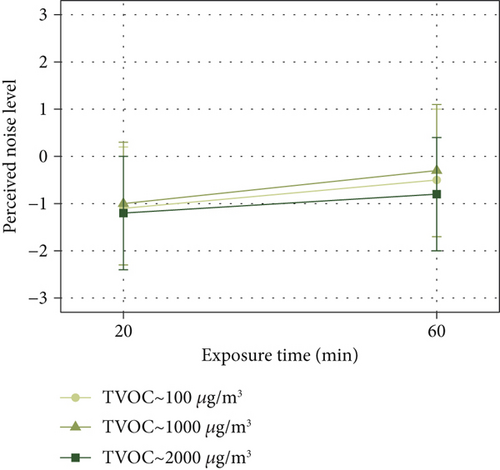
During the experiment, participants’ average perceived lighting quality ranged between “slightly bright” and “neutral” across all conditions (Figure 6c). Perceptions of noise levels were below “neutral” (Figure 6d). The ANOVA analysis for both lighting quality and noise level demonstrated significant differences between 20 and 60-min exposure durations. Additionally, perceptions of lighting quality and noise levels slightly shifted toward “neutral” after 60 min of exposure.
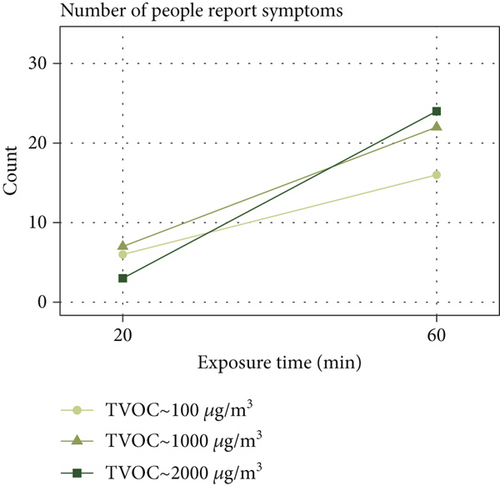
After the exposure, there was a marked increase in symptoms reported across all conditions (see Figure 7a), with increases of 10, 15, and 21 reports, respectively, under the three varying levels of TVOC. A chi-square test of independence indicated that this increase was statistically significant, p = 0.017. Participants exposed to higher levels of TVOC were more likely to report symptoms by the end of the experiment.
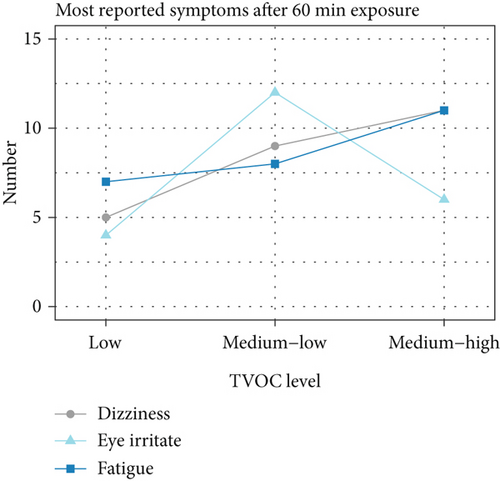
The most commonly reported symptoms included dizziness, fatigue, and eye irritation (see Figure 7b). However, univariable logistic regression analysis showed that only eye irritation was significantly associated with medium–low TVOC exposure, with a p value of 0.02. No significant associations were found for the other symptoms. The primary findings of this study are summarized in Table 7.
| Categories | Main results | |
|---|---|---|
| Indoor VOC measurement |
|
|
| Univariable multilevel model | Significant effect on reaction speed tasks | Significant effect on accuracy performance tasks |
| CPT | MTS, RLT, SAT, SRT, DST | |
| Confounders potentially impacting cognitive testing results | BMI underweight, cognitive test duration, first language, third time of participation | |
| Multivariable multilevel model adjusted by confounders | Significant effect on reaction speed tasks | Significant effect on accuracy performance tasks |
| TAP, CPT, PRT | MTS, RLT, SAT, SRT | |
| Subjective perception | Significant main effect on TVOC levels/exposure duration | Significant interaction effect |
| Air quality | TVOC levels | TVOC and exposure duration (at 20 min: C3-C1; at 60 min: C2-C1, C3-C1, C3-C2) |
| Lighting quality | Exposure duration | N/a |
| Noise level | Exposure duration | N/a |
| Temperature | N/a | N/a |
| Reporting symptoms |
|
|
- Note: C1, low level; C2, medium–low level; C3, medium–high level.
4. Discussion
4.1. Methodological Self-Reflection
The study population was limited to university students, with an overrepresentation of females and Chinese speakers. These findings therefore provide insights primarily relevant to educational settings with similar demographics. Future research could involve a more balanced study population and larger sample size to enhance the findings’ applicability to a wider range of populations. This study was powered to detect medium effect sizes and thus would be underpowered to detect smaller effects, though these were considered too small to be meaningful. Given this context, only a few tasks exhibited significant effects under medium–low exposure levels. In contrast, several other studies using a similar exposure range have reported significant impacts on cognitive performance [34, 40, 41]. The variations in exposure duration and VOC sources may contribute to the differences in observed cognitive impact, as these studies often involved longer exposure durations or different materials as sources of VOCs, complicating direct comparisons. For data collection, the BARS test primarily has been applied to assess neurobehavioral function under chemical exposures like oil spills [62] and heavy metal exposure [63]; hence, indoor VOC levels may be insufficient to produce significant effects on simpler tasks. Additionally, the BARS test lacks complex logic and decision-making components. Future research should incorporate both basic and more cognitively demanding tasks [82–85]. The use of laptop keyboards for reaction speed measurement may introduce false positives due to input latency. For consistency in methodology, this study employed a simple linear regression model to assess both speed and accuracy, similar to the analysis conducted by Caparros-Gonzalez et al. [63]. However, since the accuracy range is bounded, the true relationship is likely to flatten as it approaches these bounds [86]. Consequently, this model may not accurately predict accuracy under unrestricted TVOC levels. In built environments, encountering very high TVOC levels is unlikely. Thus, the model can still offer reasonable estimates when bounded outcomes are not close to zero or one [87, 88]. Future analyses might explore the potential of beta regression [89–91].
4.2. Impacts on Speed and Accuracy
Despite the unclear impact on reaction speed, multivariable analysis revealed that three out of 10 tasks (TAP, CPT, and PRT) demonstrated a significant effect at medium–high TVOC levels (Table 5). These tasks necessitate rapid responses to swiftly appearing targets within a short timeframe. Therefore, acute exposure to medium–high TVOC levels may affect instantaneous response capabilities. This finding aligns with several previous studies [26, 40]. However, the latency of the laptop keyboard may mean that differences in reaction speed are not substantial enough to provide conclusive evidence. Although the same laptops were used for all cognitive tests in this study to minimize latency differences between devices [92, 93], the imprecision of the keyboard (ranging from 10 to 50 ms) could introduce potential speed delays [94]. Consequently, the observed increases in reaction speed might still be considered a false positive.
Exposure to medium–high levels of TVOC significantly impacted accuracy performance, with an average error increase of 4.9% observed between low and medium–high exposure levels. This reduction in accuracy is numerically smaller than that reported by Allen et al. [34], who documented a 13% decrease in scores when TVOC concentration rose by 500 μg/m3. However, Allen’s study involved longer exposure (from 9:00 to 15:00), which may explain the more pronounced effects in their findings. The comparable ranges of reaction speed and accuracy observed in this study and previous BARS research suggest that task difficulty was well controlled [62, 63, 77] with no ceiling effects (where all participants scored full marks) or floor effects (where all participants scored zero) observed [95]. The SDL task exhibited a different trend, with both reaction speed and error rates decreasing at higher TVOC levels; however, these changes were not statistically significant, suggesting that the upper limit of TVOC exposure may not be sufficiently high to acutely affect the results of this task. Overall, acute exposure to TVOC may impair the accuracy of attention (SRT and SAT), short-term memory (MTS and DST), and working memory (RLT). Previous studies have reported similar effects, though the specific extent of decline was not detailed [40]. Satish et al. [38] indicated a decrease in participant productivity when exposed to latex paint, without specifying the range of effects. Furthermore, Gao et al. [41] found that memory performance was more adversely affected by VOCs during simple tasks than during complex ones, which partially supports the results of this study. While preliminary findings suggest potential learning impacts, practical implications require further investigation through more realistic learning environments and task-specific assessments.
Regarding confounders, firstly, underweight BMI contributed to slightly better reaction speed and higher accuracy, which is similar to findings in previous studies [96, 97]. However, another study indicates that people in the underweight BMI category tend to have underdeveloped lung function and may be more susceptible to the effects of air pollution, so their cognitive performance may decrease if the exposure is further extended [98]. Secondly, test duration was considered to be another confounder. The interval between training and test sessions, as well as repeat tests after error responses, contributes mainly to the delay in test duration, rather than to high response speed. As noted in a study by Rohlman et al. [99], participants felt tired during a longer test, leading to a potential impact on cognitive performance. Besides, participants feeling tired could also be the reason for a longer test duration. Thirdly, although cognitive performance was negatively affected by TVOC, the Chinese speaker category showed better performance on number remembering while showing lower performance in continuous attention tasks. A possible explanation is that the Chinese-based number system has a more straightforward structure; it may facilitate early mathematics learning compared to the English system [100]. Given the small sample size, this finding remains to be validated. Fourth, although this study employed a 3-week interval and counterbalanced the order of conditions, the third participation was still identified as a confounding factor. This suggests that a longer interval may be necessary in multiple-measurement experiments to mitigate the influence of learning effects [29, 37]. Furthermore, the univariable results indicated that the time slot (i.e., time of day) had no significant effect on cognitive performance. Therefore, it was not included as a confounding factor in the multivariable analysis.
4.3. Impacts on Perceptions
Participants reported a perception of poorer air quality at elevated levels of TVOC. This study deliberately selected a paint category with minimal odor to effectively assess the impact of concentration on perception. In contrast, several previous studies have shown that perceptions of air quality are more strongly influenced by the pleasantness of the odor than by the actual levels of TVOC present. For instance, Gminski et al. [37] and Skulberg et al. [39] reported that participants’ perception of air quality was “neutral” when they were exposed to pinewood panels with high TVOC levels because the wood smelled pleasant and dominated their perception. Similarly, Du et al. [40] observed that participants found atomized essential oils pleasant, even when their cognitive performance was adversely affected. Regarding lighting and noise perception, the results indicate a potential adaptation process during the experiment. Previous research has shown that the human body can adapt to noise and light levels during both short-term (tens of seconds) and long-term (hours) exposure periods [101–103]. In this study, lighting quality and noise level were less important than TVOC, as these parameters were designed not to negatively impact cognitive performance. Moreover, fluctuations in sound intensity [104] and luminance [105] have been shown to have a limited impact on cognitive performance. Although changes in lighting and noise perceptions were observed over time in this study, their interaction with TVOC exposure and potential influence on cognitive performance remains unclear. Future research should incorporate physiological or medical measures to complement self-reported data.
In contrast to certain studies that examined longer exposure durations, such as 4 h by Takigawa, et al. [16] and an entire working day by Ernstgård et al. [28], this study indicates that acute, brief exposure to VOCs can also trigger health symptoms. Previous studies have reported similar health-related symptoms associated with VOC exposure [31, 33, 35], while a limited number of studies have noted an absence of symptoms [36]. In conjunction with the results from GC-MS analyses, the high concentrations of o/m/p-Xylene may be responsible for the emergence of eye-related symptoms, since it was identified as the most irritating compound among the VOCs examined [106]. Furthermore, the increase in symptom reporting under low TVOC levels (Figure 7a) suggests that even the 40-min cognitive test may trigger discomfort. However, the study applied only one paint source, which may not accurately represent the complex mixture of VOCs present in real-world buildings. Future research should incorporate a variety of building materials to better simulate actual conditions.
5. Conclusion
TVOC level at 2000 μg/m3 shows significant effect on accuracy performance. Significant impacts were noted in attention, quick response, short-term memory, and working memory tasks, while the effect on reaction speed was unclear. Subjective perceptions of air quality worsened at higher TVOC levels, with the highest TVOC exposure triggering the most symptom reports. The current TVOC standard is generally applicable since cognitive performance is minimally affected at 1000 μg/m3. However, further higher TVOC exposure may negatively affect memory, wellbeing, and satisfaction with indoor spaces. Therefore, after new construction or renovation, monitoring TVOC levels is crucial, especially in buildings with insufficient ventilation where TVOC accumulation is more likely. If elevated levels are detected, installing air purifiers with activated carbon filters or enhancing mechanical ventilation can help mitigate these effects.
Ethics Statement
A low-risk ethics and data protection application was approved in June 2022, ref: 20220629_IEDE_PGR_ETH. The project was also registered with UCL Legal Services data protection reference: Z6364106/2022/07/61 social research.
Consent
All participants signed the informed consent before the first experiment, and they were paid 30 pounds for their participation. All personal data were securely stored under the code names.
Disclosure
This project has been pre-registered on the Open Science Framework [107] for transparency purposes [108]. Two modifications were made to the original protocol: The introductory session was extended from 15 to 20 min to allow adequate environmental adaptation time and an additional chi-square test of independence and logistic regression model were applied to supplement symptom analysis.
Conflicts of Interest
The authors declare no conflicts of interest.
Funding
No funding was received for this manuscript.
Open Research
Data Availability Statement
The data that support the findings of this study are available from the corresponding author upon reasonable request.


