The Reliability of CO2 Measurements Using Low-Cost Sensors: A Study of Sensor Positioning and Ventilation Strategies in Classrooms
Abstract
The COVID-19 emergency evidenced the value of keeping indoor spaces properly ventilated, which increased the interest in CO2 loggers. However, when monitoring, many significant variables are often overlooked, such as sensor specifications, the position of the system with respect to the airflow path (or occupants), and the relationship between these variables and the ventilation system of the room. With the purpose of properly standardizing future indoor air quality measurements in classroom settings, this study evaluated the results of a measurement campaign consisting of 33 individual measurements performed on site during 5 months in primary schools and university classrooms. This work uses dCO2/dt to identify CO2 tendencies while taking into account classroom topology and ventilation. Results show that variables such as their position and the ventilation strategy of the room often outweigh the sensor specifications, causing spatial discrepancies beyond 100 ppm. Along with the results, recommendations for future measurements are discussed in order to avoid nonrepresentative estimations of the CO2 level of indoor spaces.
1. Introduction
Monitoring the indoor environment in buildings generates essential information to keep the building’s energy consumption in check and provides a comfortable and healthy environment to the occupants [1]. This is of special relevance in the case of educational buildings, where a poor indoor environment can impact negatively on the learning process and increase absenteeism [2–5]. Indoor environmental quality can be evaluated through thermal comfort, indoor air quality (IAQ), acoustic comfort, and visual comfort [6]. Since the outbreak of COVID-19 in March 2020, the focus has shifted toward CO2, as it provides a means to assess the ventilation rate and therefore the risk of airborne infection transmission [7]. This gas is strongly related to human bioeffluents and can provide information about occupation densities and ventilation efficiency [8].
In order to mitigate the spread of COVID-19, as well as future pandemic situations, different countries set regulations or recommendations to limit CO2 levels by ensuring good ventilation conditions (VCs) [9]. For instance, with the objective of reducing transmission risks, both the Centers for Disease Control and Prevention (in the United States) and the Federation of European Heating, Ventilation and Air Conditioning Associations (in Europe) reduced their respective recommendations of indoor levels to 800 ppm during the pandemic [10, 11]. Similarly, in Spain, the Reglamento de Instalaciones Térmicas en Edificios (RITE) [12] recommended a general threshold of 800–1000 ppm CO2 levels in indoor settings [13–15]. Likewise, it is stated that 600–800 ppm of CO2 should not be exceeded in spaces classified as European standard IDA2 [16], which includes reading rooms, teaching classrooms, and similar areas. Based on these recommendations, many countries, including the United Kingdom [17] and Germany [18], as well as numerous local Spanish governments [19–21], promoted or enforced the use of CO2 meters in shared-use spaces. This initiative triggered a surge in the sales of these devices, especially low-cost sensors.
However, the specifications of the monitoring system, the sensor position with respect to the geometry of the room, and the VCs are often overlooked by the regulations and recommendations, even though previous studies show the heterogeneous nature of the CO2 concentration in occupied rooms. Differences in CO2 readings are significantly affected by air convection and breathing when placing the sensors close to the room occupants [22–24]. Based on numerical simulations, these differences can reach 10% in the proximity of occupants and windows, resulting in differences larger than 100 ppm [25]. These results were further confirmed through field studies that observed differences of up to 242 ppm in ventilated rooms [26]. To avoid such disturbances, the sensors should be placed away from doors, windows, or students to ensure comparable readings [27–29]. Hence, the sensors are often placed on the walls [30], but whether or not that placing provides representative measures for all of the room is often not considered.
Hence, the rising interest in controlling the air quality in indoor spaces demands a standard for such measurements. This would provide a framework for installing the monitoring device in a representative position of the room and the minimum system specifications for the monitoring tasks, making low-cost sensors highly relevant [31]. The demand for cost-effective systems and accessible calibration methods for achieving higher precision is increasing [32], but the balance between system cost and system performance is often overlooked.
However, such a standard does not exist as of yet. There are many open variables, such as the minimum number of sensors required to monitor a room depending on the ventilation, optimal sensor(s) position, required sensor specifications, and the effect of the ventilation strategy. Most research studies and building designers typically opt to place a single sensor per room, a practice that often leads to inaccurate readings [33]. Previous studies already simulated CO2 dynamics in indoor settings, but there is a lack of studies with real data acquired in teaching rooms as well as sensor placement recommendations. And even when the air quality of the room is completely monitored, the response measures are always reactive, activating ventilation systems only once the air quality falls below acceptable levels. Hence, the conclusion is that both indoor air monitoring as well as the guidelines for ventilation can be improved.
This manuscript presents a large multivariate study conducted across various classrooms in schools and universities. Gas and air quality sensors of diverse costs and specifications were deployed in these rooms, exploring different spatial layouts and ventilation strategies. The primary goal of the dataset is to identify optimal sensor positions concerning room VCs and occupancy when measuring temperature, CO2, and humidity. To achieve this, a statistical methodology is employed, leveraging the variability among readings from various sensor units and ambient conditions. The second objective is to improve the current methodology of the ventilation systems, looking for a more proactive approach and acting in advance to the low air quality readings. This second objective encompasses an analysis of the rate of CO2 variation, enabling the portrayal of CO2 distribution and its temporal evolution. This process allows the use of a new key performance indicator based on the derivative of the CO2 concentration (CO2), dCO2/dt, in indoor monitoring, which allows for a more preemptive action of the ventilation systems rather than reacting to the threshold values. Hence, the aim of this work is (i) to provide guidelines regarding the air monitoring of educational buildings using real data, such as the optimal sensor position and how it is affected by the ventilation strategy of the room; (ii) to find out how many sensors are necessary to ensure recommended CO2 levels in the whole room and how much precision they need for that; and (iii) to obtain a useful indicator to improve the reaction over the ventilation systems and control of the space occupancy. It also enables the study of indoor comfort and the efficiency of mechanical (Mec) ventilation [34, 35].
2. Methods
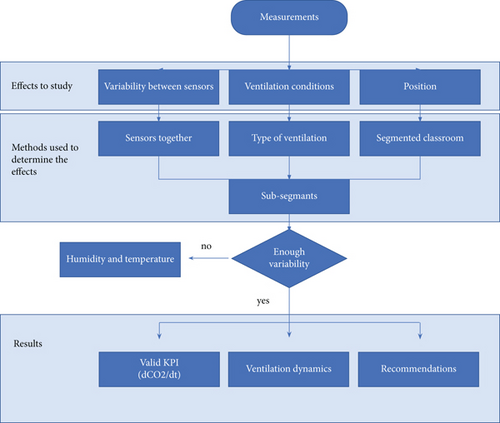
This section presents the equipment employed and the methodology followed when performing the monitoring campaign, as well as the statistical methods for the following data study. This includes the sensor specifications, the different ventilation strategies, the sensor position with respect to the room geometry, and the acquired dataset. Figure 1 shows the workflow of the data along with the information extracted from each step, from the objective effects to study, going through the methodology for each, and the results extracted.
2.1. Equipment and Data Collection
In order to collect the necessary data for this study, classrooms of universities and primary schools located in the Barcelona region were monitored during the 2021–2022 academic year. The monitoring campaign consists of 33 measuring sessions1.
In university settings, 24 measurements were conducted in different buildings of Universitat Politècnica de Catalunya (UPC). Specifically, 20 measurements were taken at Escola Tècnica Superior d’Enginyeria Industrial de Barcelona (ETSEIB, U1): 16 in three different classrooms (R1, R2, and R3), two in an office (O), one in a study room (SR), and another in the library (L). Additionally, three more measurements were conducted in two different classrooms at the Facultat de Nàutica de Barcelona (R4 and R5) and one in another classroom at the Escola Superior d’Enginyeries Industrial, Aeroespacial i Audiovisual de Terrassa (ESEIAAT) (R6).
Regarding school measurements, nine (S) were collected from three different schools located near Barcelona using seven different classrooms. The locations of these schools are shown in Figure S1 of the supporting information.
The duration of the measurements corresponds to the length of the teaching session plus a time interval before/after the lesson to capture the variation of the conditions once the occupants enter/leave the room. The duration of a lecture can be from 1 to 3 h. Classroom conditions were not modified under any circumstances; no adjustments were made to ventilation or climate control specifically for monitoring purposes, ensuring that classroom VCs remained unchanged.
During the data collection campaign, a total of five sensors were deployed in the monitored classrooms. The campaign uses commercially available integrated compact, portable devices ready for use: two units of Comet U3430 (S11 and S12), one unit of DeltaOHM HD32.3TC (S2), a Sensirion SCD30 (S3) sensor with a Raspberry Pi to acquire the sensor data, and one unit of Elitech RC5 (S4). Placing two units of the Comet U3430 enables the study of sensor variability in different positions. Cost and measured variables are listed in Table 1, and the technical specifications are shown in Table 2. All sensing units come factory-calibrated.
| Variables | |||||||||
|---|---|---|---|---|---|---|---|---|---|
| Sensors | Qty | Cost (€) | Air T | Rad T | Humidity | CO2 | VOC | Air vel. | |
| Comet | S1 | 2 | 300 | ✓ | ✓ | ✓ | |||
| DeltaOHM | S2 | 1 | 2000 | ✓ | ✓ | ✓ | ✓ | ✓ | ✓ |
| Elitech | S4 | 1 | 20 | ✓ | |||||
| Sensirion | S3 | 1 | 50 | ✓ | ✓ | ✓ | |||
| Sensor | Range | Resolution | Accuracy | |
|---|---|---|---|---|
| Air temp (°C) | S1 | −20 to 60 | 0.1 | ±0.4 |
| S4 | −30 to 70 | ±0.5 (20–40)/±1 (rest) | ||
| S2 | −20 to 80 | ±0.1 (20–60)/±0.2 (rest) | ||
| S3 | −40 to 70 | ±0.4 | ||
| Radiant temp. (°C) | S2 | −30 to 120 | 0.1 | 1/3 DIN |
| CO2 (ppm) | S1 | 0–5000 | 1 | ±50 + 3% from reading |
| S2 | 0–5000 | ±50 + 3% from reading | ||
| S4 | 400–10000 | ±30 + 3% | ||
| Relative humidity (%) | S1 | 0–100 | 0.1 | ±1.8 |
| S2 | 0–100 | ±2 (0–80)/±3 rest | ||
| S3 | 0–100 | ±3 | ||
| VOC | S2 | 0–5000 | 1 | Relative qualitative measurement |
| Air velocity (m/s) | S2 | 0.02–5 (0–80) | 0.01 | ±0.05 + 5% from reading |
The sensors were placed in different distributions for this study. To study the sensor precision and possible sensor discrepancies, the measurements where all the sensors were placed together in the same spot were used. On the other hand, the measures with the sensors in different positions served to study the effect of sensor position and obtain a representation of the CO2 distribution. Table 3 shows the measurements grouped according to the location of the sensors. It also shows the type of ventilation available in each room, either natural (Nat) or Mec, the date of each measurement, and the room identification number. Note that the complete campaign took place over several months, covering both summer and winter.
| Measure ID | Date | Classroom | Ventilation |
|---|---|---|---|
| Sensors together | |||
| T1 | 11/16/2021 | O1 | Nat |
| T2 | 12/15/2021 | O1 | Nat |
| T3 and T4 | 05/09/2022 | R5 and R5 | Nat |
| T5 | 05/11/2022 | R1 | Nat |
| T6 and T7 | 05/25/2022 | R1 and R1 | Nat |
| T8 and T9 | 05/27/2022 | R1 and R1 | Nat |
| T10 | 06/20/2022 | R3 | Nat |
| T11 and T12 | 06/21/2022 | L and SR | Mec and Nat |
| Sensors apart | |||
| A1 and A2 | 11/19/2021 | R1 and R2 | Nat and Mec |
| A3 | 11/22/2021 | R2 | Mec |
| A4 | 11/23/2021 | R2 | Mec |
| A5 | 11/24/2021 | R1 | Nat |
| A6 and A7 | 11/26/2021 | R1 and R2 | Nat and Mec |
| A8 | 11/30/2021 | R2 | Mec |
| A9 | 12/01/2021 | R1 | Nat |
| A10 | 12/14/2021 | R6 | Nat |
| A11 | 12/22/2021 | R4 | Nat |
| A12 and A13 | 03/01/2022 | S1 and S2 | Nat |
| A14 and A15 | 03/03/2022 | S3 and S4 | Nat |
| A16, A17, and A18 | 03/10/2022 | S5, S6, and S5 | Nat |
| A19 | 03/11/2022 | R1 | Nat |
| A20 and A21 | 03/31/2022 | S7 and S7 | Nat |
Nat ventilation can be crossed or single-sided (SS). The former means that windows and doors are opened on both sides of a classroom, allowing for air streams. The latter has only windows or a door opened on one side of the room. Mec ventilation, which is only available in classroom R2 and the L of the ETSEIB, activates the ventilation when the CO2 measurement overpasses 750 ppm. As for the vertical placement of the sensors, while other studies have used different heights ([36–38] with 1, 1.2, and 1.5 m, respectively), the sensors of this study were always placed at the same breathing height (110 ± 5 cm from the floor). This is done to minimize the CO2 differences present in different height strata [22] as well as to have all the measures representative of the breathing height.
In addition to the data collected by the sensors, the room occupancy and activities were carefully monitored by having a researcher note down the people coming in and out of the room. This also includes activities in regard to the ventilation, which involves noting down the time of each opening and closing of windows and doors. Also, a diagram of each classroom is made detailing the position and type of the windows, the doors, the ventilation grids, and the air conditioning points. These diagrams, in relation to the location of the sensors inside the room, allow a deeper analysis of the data when considering the sensor position [39, 40]. Figures S2 and S3 from the supporting information include pictures from a classroom during a measuring session.
2.2. Measuring Conditions
The data is sorted according to the different VCs and sensor positions. This section explains these VCs and how the sensors are distributed in a room.
- •
None: doors and windows closed.
- •
SS: door or window(s) open on the same side of the room.
- •
Cross: door and window(s) open on at least two sides of the room, allowing for crossed ventilation.
- •
Mec: there is an active ventilation system in the room.
All the monitored rooms that are classrooms (abbreviated in Table 3 as R for universities or S for schools) have a similar volume (160 ± 20 m3) and layout of windows and doors, which is represented in Figure 2 (exceptuating R2, which has Mec ventilation). This similar layout and volume between the monitored rooms simplifies the study of the acquired data. Each room is divided into six sections, as shown in the previously mentioned figure. This allows the position variable to be easily interpreted. The measures in those rooms that are not classrooms (such as the L) were performed with the sensors together in the same position. Since the attendance of students is similar in most measurements, averaging 20 students both in universities and schools, this results in an average of 8.15 m3 per occupant.
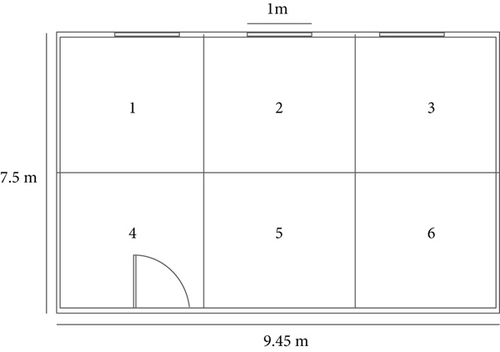
The position of the sensors is carefully recorded, and each sensor position is assigned to one of the construction sections of the classroom. Additionally, the final position of the sensors follows some rules to avoid direct human interaction and reduce the direct effect of nearby occupants with the sensors: No sensor was placed closer than 1 meter to any occupant; all sensor nodes were placed on top of desks at a height of between 80 and 110 cm; the sensors were placed at least 1 m from any wall. A representative diagram of a classroom with a typical location of the sensors and the occupants can be seen in Figure S4 of the supporting information.
2.3. Measuring Segments
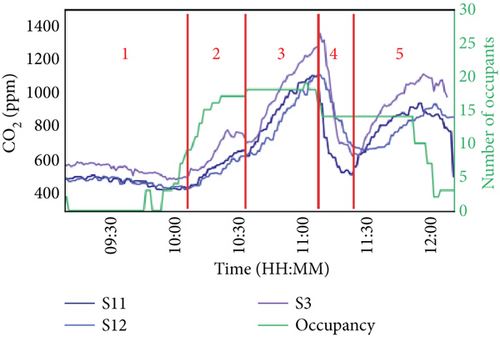
When a door or window is opened or closed during a measuring session, the CO2 levels adjust accordingly. As a result, each session is segmented based on the different VCs present. This approach allows each segment to reflect a relatively stable CO2 trend, facilitating comparisons between segments. These segments are hereinafter referred to as measurement segments (MSs).
When a door or window changes state, the room’s VC adjusts, causing the CO2 level to shift rapidly (typically within 3 min) as it moves toward a new equilibrium between ventilation and CO2 sources. As equilibrium is approached, this trend gradually slows until a plateau is reached. This rapid adjustment is used to define boundaries between MSs to ensure that only the steady-state portion of the signals is included.
Figure 3 represents a measurement session with vertical red lines marking the limits in CO2 trends caused by changes in the VCs, such as opening or closing a door or window. (1) In this specific case, the lecture begins with both windows and doors open, allowing for crossed Nat ventilation. (2) Shortly after 10:00, the windows are closed, reducing the ventilation level. (3) At 10:30, the door is also closed, preventing any ventilation. (4) After 11:00, both doors and windows are open again, leading again to initial conditions. (5) Next, just before 11:30, the windows are closed again, returning to SS ventilation. Finally, at 12:00, the lecture ends, and the measurement session ends. This results in five different segments with different VCs.
2.4. Data Processing
The first step is to synchronize and merge the timestamps of the different sensors to 1 min. The data is then divided into their corresponding MSs. The percentage of MS that have a set sensor distribution or ventilation is shown in Table 4.
| Distribution (%) | Ventilation (%) | ||||
|---|---|---|---|---|---|
| Apart | Together | None | Single-sided | Crossed | Mechanical |
| 53.8 | 46.2 | 15.4 | 34.6 | 38.4 | 11.6 |
To assess the impact of sensor variability on the data, it is crucial to compare the variability of both sensors of the same model and across different models during measurement sessions where all sensors are colocated. This comparison involves calculating the σMS between Sensors S11 and S12 and between all sensors in MSs where all sensors are together. Once it is established that differences between sensor models do not significantly affect the readings, the next step is to investigate whether sensor position within a room has an impact.
To test this, a Levene’s test [41] is performed using σMS as the variable. Each MS has an associated σMS value, and these values are grouped based on the sensor distribution: “apart” or “together.” Levene’s test is then applied to these groups to evaluate whether there are significant differences in variability. This test examines the absolute deviations from group means, making it robust against deviations from normality, which is particularly advantageous for our data.
Once the hypotheses regarding the sensor model and position are addressed, the effects of ventilation and sensor placement on the measurements are analyzed.
3. Results
3.1. Sensor Variability
Sensor variability is studied by comparing the deviation (σ) between sensors, according to the relative position and VCs. Figure 4 shows measured sensor deviation, including all measuring sessions. In particular, Figure 4(a) shows the deviation for two copies of the same sensor type (S11 and S12), while Figure 4(b) shows deviation including all the sensors (S11, S12, S2, and S3). It can be observed that, even within sensor specifications, deviations increase when incorporating different types of sensors, as expected due to the increased intraunit variability among sensors [43, 44].
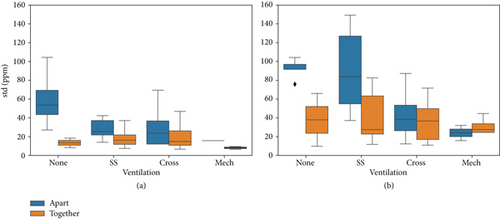
Including all ventilations, the mean σ of the S11 and S12 alone is 17.74 ppm, while it rises to 37.35 ppm when including all sensors, with the max difference reaching 80 ppm. However, the accuracy of the sensors when measuring CO2 ranges from 30 to 50 ppm (without including the uncertainty based on the reading; see Table 2). So the difference entailed by using different sensor models, while noticeable, remains within specifications. It should also be noted that when the sensors are apart, the variability in CO2 readings is higher, as expected. Especially under the lower ventilation conditions, where the difference between all sensors in “together” and “apart” configurations is approximately 50 ppm in both the none and SS ventilations. This confirms that sensor location has a relevant effect on CO2 measurements. The observed differences exceed 100 ppm, which is well above the sensor accuracy range (±50 ppm), allowing us to conclude that these variations are significant and not due to sensor noise.
The same process was followed to calculate the mean σ for air temperature and relative humidity (RH) (Figures S5 and S6 of the supporting information). The mean σ for temperature readings when the sensors were in the same position was 0.57°C (reduced to 0.08°C when considering only S1 and S2 sensors). This sensor variability shadowed the temperature differences found in different positions of the room. On the other hand, the mean σ for humidity measurements when the sensors were placed together was 0.35%, slightly above the sensor accuracy (±3%). Only in the scenario of Nat noncrossed ventilation (vent = SS) does the variability across the room exceed consistent sensor accuracy. Hence, the remaining data analysis and results focus exclusively on the CO2 measurements, as temperature variability between sensing units hinders the sensor placement, and humidity shows low spatial variability.
For humidity, the variability when sensors are separated remains mostly within the sensor accuracy limits. Only in a few cases with Nat noncrossed ventilation (vent = SS) does the variability exceed the sensor accuracy for humidity (±3%). Since the observed variability caused by sensor placement is of the same order or smaller than the sensor accuracy, it is not significant and does not provide meaningful insights. In other words, the indoor humidity variation is minimal.
For these reasons, the remaining data analysis and results focus solely on the CO2 measurements, as temperature variability between sensing units hinders the sensor placement study, while humidity does not present significant spatial variability to begin with.
Once that has been established, the next result needed to proceed is to confirm that the sensor variability is indeed greater when these are in different locations from each other.
3.2. Variability Due to Sensor Distribution: Apart or Together
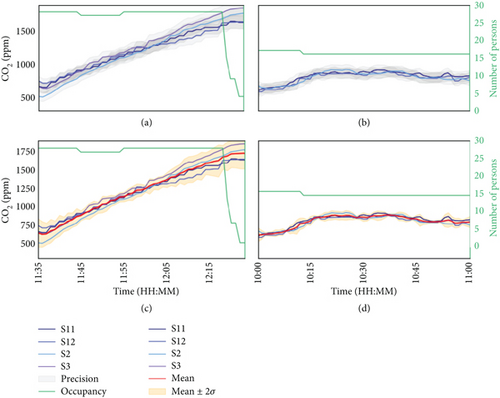
Upon performing a Levene’s test by using all σMS categorized by their sensor distribution (apart or together), a resultant score of 10.21 with a p value of p = 0.0023 confirms that the location of the sensors in a room introduces significant differences in their readings. A low p value such as the one obtained indicates a statistically significant difference in variances between the groups, which implies that the placement of sensors affects the variability of their readings. Such a conclusion can also be derived from Figure 4, where it is more evident for the low-VCs (referred to as none and SS). Since the discrepancy in the comparison between sensors placed together and apart is greater than that caused by using different sensors, this indicates that, despite the added uncertainty, positioning sensors in different locations introduces a significant variability beyond the sensors’ inherent accuracy. This is illustrated in Figure 5, which compares two different MSs with distinct sensor distributions. Figures 5(a) and 5(c) correspond to the signal measured by the sensors apart during non-VCs, and Figures 5(b) and 5(d) correspond to sensors together under SS ventilation. Figures 5(a) and 5(b) show the precision of each sensor, and Figures 5(c) and 5(d) show the mean value along with the upper and lower limits μj ± 2σj. The effect of the position is clearly greater than the limits of the sensor precision (Figure 5(a)), and the variance of the measurements is significantly greater when the sensors are apart (Figure 5(c)). The average σα when the sensors are together is 2.11 and 2.96 ppm/min for ventilation SS and cross, respectively, and 6.29 and 5.00 ppm/min when the sensors are apart.
However, this effect is intertwined with that of ventilation, as the difference among ventilation levels in Figure 6 hints. A representative example of the effect is shown in Figure 7, with the corresponding measuring segment for both sensor distributions.
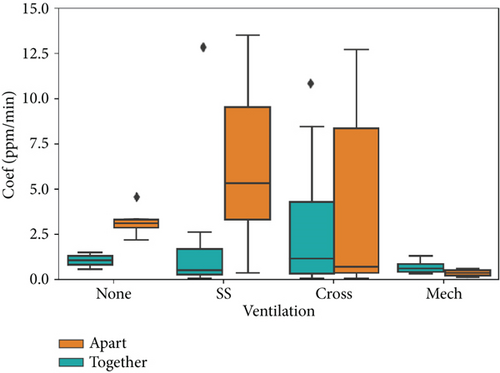
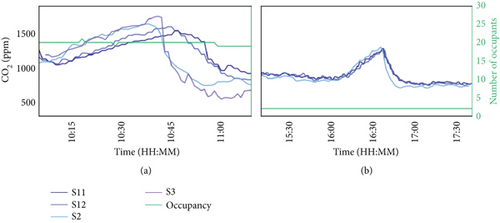
In the case of the top plot, there is no ventilation until 10:43, when Nat crossed ventilation is allowed. The sensors then react differently depending on their position in the room; while the S2 and S3 sensors experience an abrupt response, the S11 and S12 sensors have a less pronounced dCO2/dt. In this case, the S2 and S3 sensors were right in the air currents caused by the door and windows, while the S11 and S12 sensors were close to the corners of the room, leading to momentary CO2 differences beyond 500 ppm. This information also proves that the dCO2/dt is a metric that characterizes the ventilation behavior by location much better than its raw values. This phenomenon is further explained in Section 3.3. One can see that different sensor locations provide different readings due to the air circulation and the heterogeneous gas concentration. To better understand the effect of ventilation on the CO2 distribution of a classroom, Figure 6 represents a boxplot with σα according to the different VCs. This figure shows the variability of CO2 increases or decreases over time, distinguished by ventilation strategy.
Once it has been established that the ventilation system can cause different readings in different places of a room, the next step is to study further the effect of ventilation.
3.3. Effect of Ventilation
Figure 6 shows the impact of the ventilation setup on the CO2 concentration. Specifically, under Nat ventilation (vent = SS and cross), there is greater variability in the rate of CO2 increase or decrease, with maximum values around 14 ppm/min, more than three times the maximum values for none and Mec. This means that dCO2/dt has a significant variability difference depending on the location of the room since the values of CO2 do not change at the same rate in the room as a whole. However, for the other two VCs (none and Mec), there seems to be lower variability in that variable, with both maximum and mean values under the 3 ppm/min mark. That is probably due to the Nat currents present under Nat ventilation. Referring back to the effect of the sensor distribution in the readings, the same conclusion can be reached again by looking at Figure 4(a) and comparing the dCO2/dt by distribution in Figure 6; the position of the sensors does significantly alter the CO2 readings.
Hence, the feature dCO2/dt is sensitive to ventilation and sensor position. Figure 8 directly shows the average dCO2/dt (not the variability) measured by position and ventilation, including all MS where the sensors were placed apart from each other. In this case, when there is no ventilation at all, the position of the sensors has little effect on the measured CO2 build-up, as stated before; the whole room’s CO2 increases or decreases homogeneously. The maximum and minimum values of the derivative for each position do not grow apart more than 10 ppm/min, and neither does the difference between their mean values. However, some spatial differences start to be visible when there is Nat ventilation. It should be noted that the dCO2/dt, as measured by each sensor in each MS, remains almost constant as long as the ventilation system is also the same and the stationary period of the CO2 is not reached, which does not usually happen in real classrooms as observed in this dataset due to how often doors and windows open in a classroom. By definition, each MS has a single ventilation system and sensor spatial layout. This means that as long as these two variables remain constant, the dCO2/dt will do likewise until enough time passes to arrive at stationary conditions.

The first observation is that the lowest and negative values of CO2 build-up for each box are in Positions 1 and 2, which means better ventilation in those areas since negative values mean that the CO2 is decreasing. That ventilation is further improved when crossed ventilation is present (both windows and door), allowing efficient air currents, with differences with the minimum coefficients around 30 ppm/min between SS and cross. This result is in accordance with the layout, as those positions are both next to the windows and in proximity to the door, and a crossed ventilation implies an air current traversing from the windows to the door or vice versa. Positions 3 and 6, the areas farthest from that line of the air stream, are the ones that experience the least CO2 decrease when going from simple to crossed ventilation.
Another result from the same figure is that, when there is SS ventilation (vent = SS), there is a mix of positive and negative ratios of CO2 increase, tending more to an overall increase. This means that the CO2 actually keeps increasing in most of the occupied rooms with Nat noncrossed ventilation. In that case, the position of the sensor is crucial for control, as it might lead to bad decision-making.
Figure 9 provides a visualization of the CO2 concentration trend for the different ventilation strategies along with a fitted linear regression model. Each level of ventilation is formed by the aggregation of data points of two to four different MSs with the same ventilation system and a duration of at least an hour. With no ventilation (vent = none), the CO2 can reach unhealthy levels in mere minutes. Nat ventilation (vent = SS and cross), although preventing critical CO2 levels, is still somewhat inefficient at ventilating a room. Lastly, Mec ventilation (vent = Mec) keeps the CO2 levels constantly low and steady.
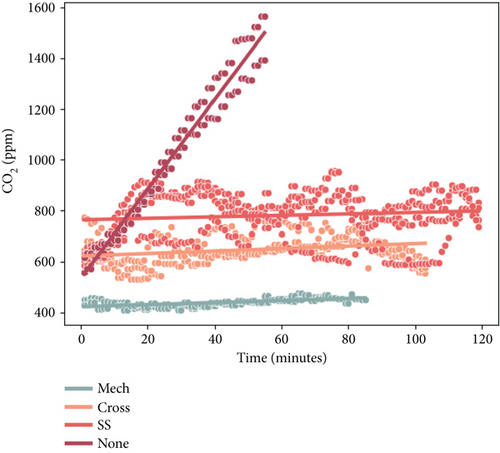
Finally, besides being the most effective ventilation system, Mec ventilation also overrides any position effects. As only one classroom with Mec ventilation is studied, this result suggests that it is only applicable in classrooms with efficient enough Mec ventilation. This is visible in Figures 4, 6, 8, and 9. The homogeneity in position is only visible with Mec ventilation, even in the most stable of the other cases (i.e., when the dCO2/dt are identical in nonventilated situations [Figure 4]), the position of the sensor results in differences in the readings.
4. Discussion
Prior to sensor deployment, one needs to choose the sensor specifications for the CO2 monitoring system. The differences observed between different devices are within the sensor specifications for CO2 and RH. These results show that, as long as the sensor accuracy is ±50 ppm or better, the sensors will properly capture the CO2 differences in a room. However, the sensor accuracy available for this study (Table 2) is not enough to find significant differences with sensor location regarding RH or temperature (Figures S5 and S6 of the supporting information). In the case of CO2, the required sensor specifications can be achieved without high-end instrumentation. Indeed, it has been found that a better setup is to deploy a network of low-cost sensors rather than a single sensor with better functionalities. This strategy allows the CO2 distribution in the room to be better captured, which in turn also provides information about the local air change efficiency in the room. Monitoring devices with higher costs often provide extra functionalities rather than a significant improvement in sensor specifications.
The experimental campaign enabled the study of the impact of different ventilation strategies on CO2 dynamics and indoor distribution. These effects must be taken into account when performing measurements regardless of the sensors used. The case of no ventilation (vent = none) means that there are no air currents in the room that affect its ventilation. Hence, under this condition, CO2 accumulation is subject to room occupancy, creating small spatial differences of dCO2/dt (Figure 6). These observed differences translate into different spaces of the room reaching the stationary condition of the CO2 values at different times. Specifically, the average σ between CO2 readings when the sensors are apart in a sealed room is 97.24 ppm. This means that in a room with no ventilation, the distribution of CO2 depends on the position of the occupants, with differences of up to 100 ppm, which is in accordance with what is found in [45], where authors simulated none, or very low, ventilation in a small chamber. This indicated that, in a nonventilated room, the position of the sensing device becomes relevant: the readings will depend on whether it is on a wall or close to the occupants. It is not always possible to place the sensors mid-room, so an alternative solution is to set an offset of no less than 100 ppm in these circumstances to compensate for the CO2 differences.
The sensor location under no ventilation remains relevant as long as the volume per occupant is not too low (< 6 m3 per occupant), or else it becomes evident that unsafe CO2 levels are reached within a few minutes. The average volume per occupant of this study (8.15 m3) makes the CO2 levels rise at such speed (at least 40 min for 1000 ppm) that the information given by the CO2 sensors still remains useful to know when to ventilate again. Since CO2 concentration increases rapidly as a function of occupancy in nonventilation spaces [36], the 8.15 m3 per occupant in this study makes it so that it takes long enough (~30 min) to reach unsafe levels of CO2 during nonventilated lectures.
The dCO2/dt can be used to monitor a room regardless of sensor position; however, in order to find where the maximum CO2 accumulations are, the recommended approach is to find the spot of maximum CO2 readings before definitely placing the sensor for further measurements. The following guidelines explain where this spot should be looked for depending on the ventilation.
In the case of Nat ventilation (vent = SS or cross), there are air currents that interact with the CO2 distribution in the room, resulting in a sensor on a wall having significant differences in the readings from a sensor standing on a line of current (e.g., between a door and a window). Specifically, sensors placed in the airflow stream will experience greater negative dCO2/dt values since CO2 flows more easily in these locations than it does outside the air currents. Similarly, if one needs to ensure that CO2 levels stay low under Nat ventilation, the monitoring sensors should be placed near the room occupancy, which is measuring directly at the point of interest. Again, when that is not possible, the alternative solution requires placing the sensors apart from the air streamlines (such as at walls and corners). That is, sensors should be placed far from windows and doors and locations directly between them. In this way, the device will be reading the highest CO2 concentration values in the room. In this scenario, the dCO2/dt can be a powerful tool for calculating in advance how much time the windows can stay closed and when to ventilate again.
A local CO2 monitoring project at the UPC [46] had recently installed sensors in classrooms to monitor CO2 as a part of an energy monitoring and efficiency project. When deploying the sensors, they decided on the place where one might expect higher CO2 concentration levels. Given the complications of placing the sensors among the students, the alternative is to place the sensors on the wall opposite the windows (equivalent to Position 5 in Figure 2). Their assumption proves accurate under Nat ventilation, but only as long as it is SS, as seen in Figure 8. The moment both windows and doors are open, Position 5 stops being the most favorable place for measuring maximum CO2 levels, as it is caught under the air streams formed between the door and windows. Sensors in these lines of the stream will experience greater negative dCO2/dt values as CO2 flows more easily in these locations than in the other sections of the room. Sensor positions apart from those streams become the least favorable ones. Nevertheless, in the case of no ventilation at all, the highest CO2 values are read where the occupancy is since the only force moving CO2 is diffusion and buoyancy-driven flows.
Thus, it can be concluded that there is no universally optimal sensor position, as it depends entirely on the type of ventilation. Most classrooms have variable ventilation, and as shown, indoor air currents change significantly based on the number of doors and windows open. However, there are two ways to improve measurements. The first is to deploy multiple sensors both within and outside of primary airflow areas to detect differences. The second is to supplement the sensors with ventilation data, allowing for a postprocessing step to adjust CO2 levels based on these variables, as CO2 readings can vary by up to 100 ppm. When this is not feasible, applying an offset to the CO2 levels offers a practical solution. In this study, where most classrooms share the same layout and dimensions, a recommended offset of around 100 ppm is suggested when sensors are not in the least favorable locations. This offset approximates the CO2 variation observed between the least and most favorable positions under steady-state conditions.
This offset would only be useful in classrooms without means of Mec ventilation since it is the safest way to keep a room properly ventilated. It is the system that always keeps the CO2 and dCO2/dt values at their minimum, regardless of the location of the sensors (Figures 4, 6, and 9).
It has also been noticed that having Nat noncrossed ventilation does not always ensure a drop in CO2 levels, as seen in Figures 8 and 9. The actual rate of CO2 buildup or decrease in such situations, though having a small average absolute value, will depend on the position, the occupancy, and the current CO2 value. This means that in a classroom, when aiming at decreasing CO2 levels, opening a door or a window may not be enough. Crossed ventilation is necessary to ensure healthy levels of CO2 indoors. A similar result is found in [47].
Based on the minimum CO2 concentrations observed across all measurements, typically ranging from 400 to 500 ppm, it can be inferred that the efficiency of ventilation in this study is not adversely influenced by outdoor CO2 levels. The relationship between indoor and outdoor CO2 concentrations is governed by the air exchange rate (AER) [48], which quantifies the rate at which outdoor air replaces indoor air within a given space. This exchange leads to a gradual decline in indoor CO2 concentrations toward outdoor levels, following a decay pattern. Higher AERs result in a more rapid stabilization of indoor CO2 concentrations at values similar to those outdoors. In this study, indoor CO2 levels in fully ventilated classrooms consistently stabilized around 500 ppm, suggesting that the concentrations indoors match those outdoors. This observation indicates effective air exchange and minimal impact from external factors, such as traffic, due to the low CO2 levels present outdoors.
As a final note, this work remarks on the significance of dCO2/dt as a robust metric for room monitoring, similar to the tracer gas decay test, extending beyond the conventional focus on CO2 levels alone. This metric is influenced by sensor placement and ventilation settings, but once these variables are established, it tends to exhibit relative stability. This implies that, by incorporating spatial information, the CO2 derivative can effectively characterize the CO2 profile of space with stationary ventilation, ensuring that classrooms remain adequately ventilated in an energy-efficient manner and preemptively identifying potential risk scenarios.
The inverse relationship also holds true; once the room and ventilation systems are well characterized, dCO2/dt can be leveraged to predict room occupancy or evaluate the effectiveness of ventilation protocols. This is due to it remaining constant until almost saturation point, which is achieved before the highest limit recommended levels of dCO2/dt. This versatility highlights the potential of dCO2/dt as a valuable tool for optimizing indoor environmental quality and resource utilization [49].
5. Conclusion
In an effort to standardize the IAQ measurements performed in classrooms, which experienced an increase in popularity since COVID-19 spread in 2019, this study focuses on the different conditions that may affect such measurements, these being different sensor specifications, classroom ventilation strategy, sensor position, and how they are intertwined. Studying this variability using the projection in time of the CO2 readings rather than the direct CO2 values has proven to be a useful approach, allowing us to understand how the CO2 increases or decreases depending on the subtleties of position and ventilation.
It has been found that often the accuracy of the sensors does not have as much impact as the other environmental variables such as VC or sensor position. The most dominant variables are the strategy to ventilate the room, in combination with the exact position being measured, modifying the local CO2 readings in values beyond the sensor accuracy. Every ventilation system has its pluses; having no ventilation leaves the room CO2 at the mercy of its sources, which in time can create differences in the order of 100 ppm of CO2. Noncrossed Nat ventilation does not ensure the decrease of CO2 in the room, and both crossed and noncrossed Nat ventilation create air streams that modify the CO2 distribution depending on the topology of the room, making sensor position relevant. On the other hand, Mec ventilation overrides environmental variables, though it is a costly solution and not always accessible. In terms of sensor placement, the highest CO2 values will occur away from airflow pathways (i.e., away from doors, windows, or any open spaces between them) when Nat ventilation is present. When ventilation is absent, placing sensors close to the occupants will capture the highest CO2 concentrations.
The development of CO2 classroom maps remains a viable path to add more precision to the monitoring devices. It provides information on the number and position of sensors needed to accurately monitor a classroom. In this work, we propose future monitoring studies to correct the CO2 values using ventilation and position data. Lastly, the feature dCO2/dt has been used for predicting classroom occupancy and ventilation in settings with well-defined dimensions, as long as the occupancy and ventilation remain constant. The validation of this hypothesis, however, is reserved for future investigation.
Conflicts of Interest
The authors declare no conflicts of interest.
Funding
This study was supported by the Spanish Ministry of Economy and Competitiveness (http://www.mineco.gob.es) (PID2020-117366RB-I00 and PID2021-122952OB-I00), the Networking Biomedical Research Centre in the Subject Area of Bioengineering, Biomaterials and Nanomedicine (CIBER-BBN, Spain), the initiatives of Instituto de Investigación Carlos III (ISCIII), Share4Rare project (Grant Agreement 780262), ISCIII (grant AC22/00035), ACCIÓ (grant Innotec ACE014/20/000018), and Pla de Doctorats Industrials de la Secretaria d’Universitats i Recerca del Departament d’Empresa i Coneixement de la Generalitat de Catalunya (2022 DI 014). This study is also supported by the “ComMit-20 (2020PANDE00116)” project funded by L’Agència de Gestió d’Ajuts Universitaris i de Recerca (AGAUR) through the Pandèmies 2020 programme; the MOVE4EDU (modular ventilation system integrated with urban food production in educational buildings) project reference PID2021-126845OB-C22 funded by MCIN/AEI/10.13039/501100011033/FEDER, UE, and by the European Union “NextGenerationEU”/PRTR; and the Catalan Agency AGAUR under their research group support program (2021 SGR 00341). B2SLab is certified as 2021 SGR 01052.
Acknowledgments
The authors would like to express their gratitude to all the students and staff from the primary schools who participated in this project (CEIP Lola Anglada Esplugues de Llobregat, CEIP Vall de Palau Sant Andreu de la Barca, and Institut Escola Pere Lliscart L’Hospitalet de Llobregat). The authors also thank participants from the Universitat Politècnica de Catalunya (Escola Tècnica Superior d’Enginyeria Industrial de Barcelona; Facultat de Nàutica de Barcelona; Escola Superior d’Ingenieries Industrial, Aeroespacial i Audiovisual de Terrassa). J.F. and L.C.C. also acknowledge the Serra Húnter Program.
Endnotes
1The dataset is made available in a public repository at doi:10.5281/zenodo.14621676.
Open Research
Data Availability Statement
The dataset used in this study is available for download from a public repository at 10.5281/zenodo.14621676.


